
Gold & Precious Metals
My favorite indicator for real time Gold demand is the amount of Gold in the GLD and its fluctuations over time. As we wrote in our book, the driving force for Gold is investment demand which is driven by changes in real interest rates. Western-based investment demand from big money (i.e Stan Druckenmiller and George Soros) shows up mostly in the ETFs and specifically, GLD. The amount of Gold in GLD has risen steadily even as Gold consolidated a few months back and has been stable in recent weeks even as Gold and gold stocks correct their Brexit breakouts.
The chart below includes the price of Gold, the amount of Gold in GLD (bottom) and the rolling quarterly change in the amount of Gold in GLD. Even as Gold consolidated for several months in the spring, the amount of Gold in GLD increased. Over the past few weeks Gold has retreated by $65/oz yet the GLD has only lost 2% of its Gold. Moreover, note that the recent demand surge (quarterly change) is the second strongest of the past 10 years.
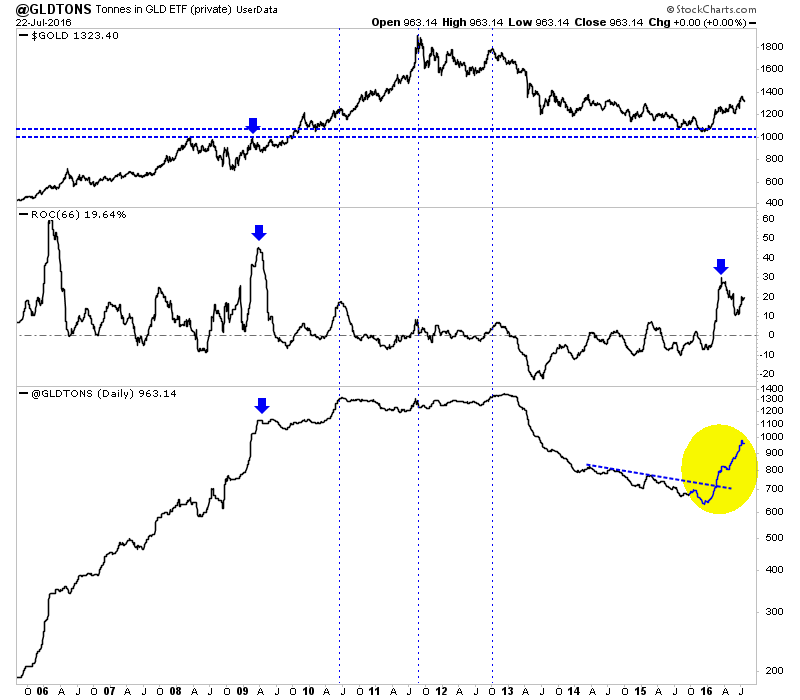
Tonnes in GLD Trust
Note how strong demand for Gold was from 2006 to the middle of 2010. Even though Gold corrected 30% during the financial crisis, GLD only experienced minor outflows of Gold. After Gold bottomed in October 2008, demand exploded.
Interestingly, demand peaked in the middle of 2010 and went sideways for a few years before succumbing to the bear market. That lack of strong demand in 2011 while Gold surged, in hindsight was a warning sign.
In short, this data (amount of Gold in GLD) can be somewhat of a leading indicator for the sector. It has been in the past and it has worked well so far this year. Unless we see huge outflows from the GLD then there isn’t much reason to be concerned with the current correction in Gold and gold stocks.
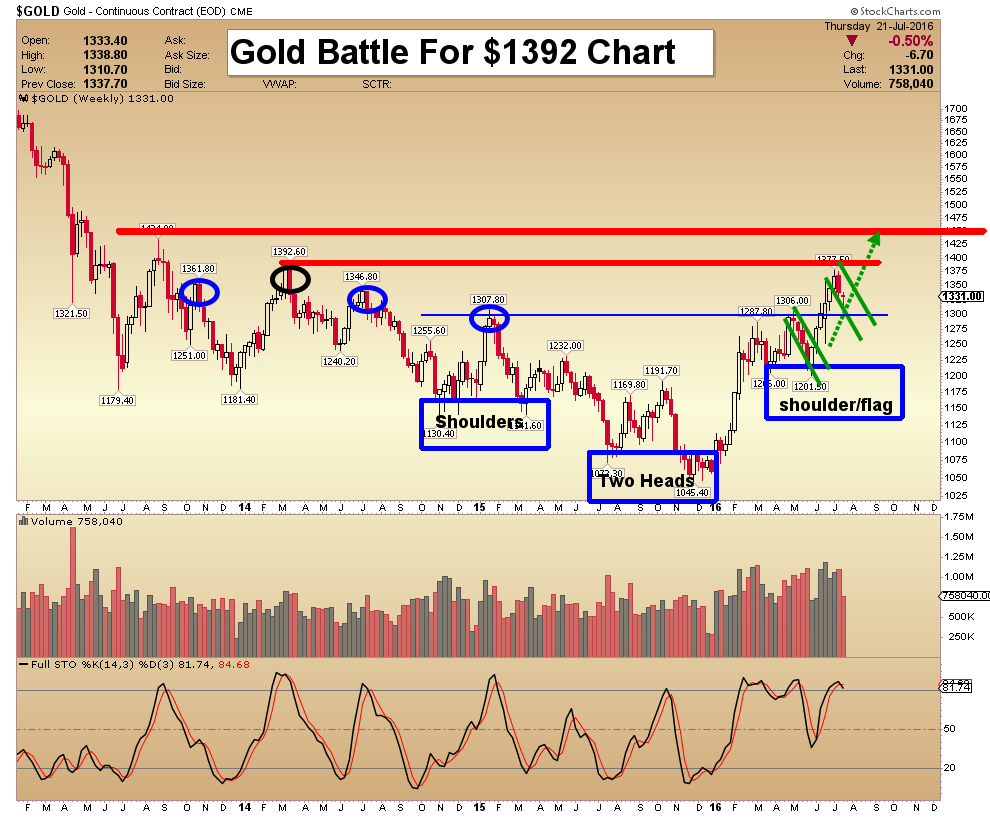
Turning to the technicals, we find that Gold appears headed for a test of support at $1275 to $1300. That would be a retest of the area from which Gold exploded in the wake of Brexit. It also marks previous resistance. Gold’s primary trend remains bullish as it holds comfortably above key long-term moving averages shown in the chart (which are equivalent to the 20-month and 40-month moving averages).
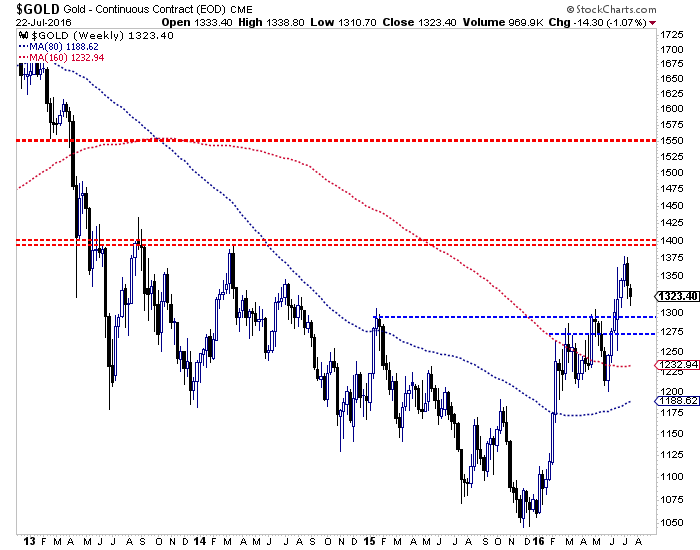
Gold Weekly Candle Chart
Like Gold, the gold miners and junior gold stocks could be retesting their Brexit breakout. The stocks may be forming a bear flag (yellow) which would lead to another move lower. If that plays out then look for a test of the support points shown, including the 50-day moving averages.
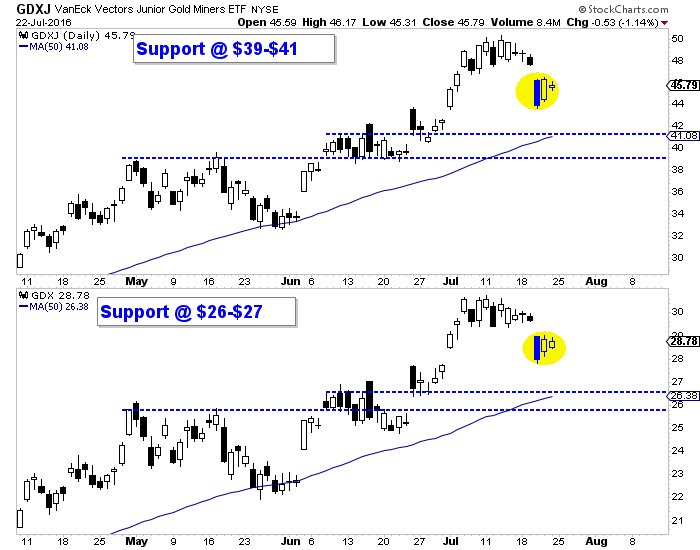
GDX, GDXJ
While Gold and gold shares are correcting now, the real time data coming from GLD suggests Gold demand is and should remain firm. Traders and investors are advised to monitor flows in and out of GLD in order to keep tabs on real time investment demand for Gold. This is one of the many things we monitor to stay in tune with market trends. The short-term trend is down and further weakness would bring about a good buying opportunity in select companies.
Jordan Roy-Byrne, CMT, MFTA
related:
Morris Hubbartt’s Gold’s Correction: Key Technical Highlights

Today’s videos and charts (double click to enlarge):
Gold & Silver Bullion Video Analysis
Precious Metal ETFs Video Analysis
SF60 Key Trades Video Analysis
SF Trader Time Key Trades Video Analysis
Thanks,
Morris
related M/T Ed: Climbing Gold and Silver’s Wall of Worry
About Super Force Signals:
Our Surge Index Signals are created thru our proprietary blend of the highest quality technical analysis and many years of successful business building. We are two business owners with excellent synergy. We understand risk and reward. Our subscribers are generally successfully business owners, people like yourself with speculative funds, looking for serious management of your risk and reward in the market.
website: www.superforcesignals.com

Confidence is slippery, even when you are a metals investor sitting atop the best performing assets of 2016. It doesn’t help when 4 years of a miserable bear market remains fresh in our memories. Any weakness in prices and it can feel like markets are getting ready to plunge right back to $13 silver and $1,000 gold.
That feeling is called the “Wall of Worry”, and bulls are going to have to climb it by staying in the market even if their emotions are telling them to bail. Let’s review the last 6 weeks because they are quite instructional.
June 1st: Silver closed at $15.97 and gold at $1,213. Precious metals prices stood well below the highs put in at the end of April and plenty of people declared the end of metals bull run.
There was plenty of reason to worry. At the time, markets were obsessed with Federal Reserve policy and sentiment was darkening.
 The year had opened with turmoil in the stock markets. The S&P 500 was plummeting in response to a December rate hike with the expectation of more hikes to come. Precious metals surged as investors sought refuge from crumbling stocks.
In mid-February Fed officials responded to the collapse in stock prices by reversing their rhetoric on interest rates. They reaffirmed their undying commitment to growth and prosperity through freshly printed cash!
Metals got another boost and the S&P 500 took off like a rocket.
So much so that, by June, schizophrenic officials had reversed direction once again. They sounded an economic “all clear” and began jawboning about raising rates. Some thought they might even get around to hiking as soon as the FOMC meeting in the middle of the month.
June 3rd: The Bureau of Labor Statistics (BLS) released a disastrous jobs report for May, missing even the most conservative estimates by a mile. The consensus on more rate hikes simply blinked out of existence. Forget higher interest rates, investors began wondering if Negative Interest Rate Policy would soon be making its U.S. debut.
Gold prices jumped by $80/oz to $1,299/oz over the following 2 weeks. Silver raced ahead by $1.50 to $17.54/oz.
Then, in the days leading up to the Brexit vote, metals prices take a beating. Everyone is watching, but no one expects the British to vote “Leave.”
June 23rd: United Kingdom voters shock people everywhere. Stock markets crash, there is turmoil in the foreign exchange markets and people wonder if Brexit represents the kick-off for the next worldwide financial crisis.
 Not only were interest rate hikes back off of the table, central bankers stood out front and did what they do best: they assured markets that no one need pay for their sins. They stood at the ready to provide “liquidity,” also known as unlimited cash to prop up overleveraged and mismanaged banks and hedge funds who lost bets they couldn’t afford on Brexit.
The turmoil and safe haven buying drove the gold price from $1,257 to $1,367 by July 8th. Silver jumped from $17.32 to $20.31 over the same period.
July 8th: Stock markets shrugged off the turmoil following the Brexit vote. Two days of heavy selling immediately after Brexit were followed by relentless buying.
Only investors were split. Some bought risk assets like stocks, figuring the hysteria surrounding Brexit was overdone.
Others bought safe haven assets including Treasuries and metals. They saw European banks in a lot of trouble. Italian banks needed a bailout and much larger banks – Deutsche Bank and Credit Suisse – were signaling the possibility of collapse as their share prices traded below the 2008 crisis lows.
Cue the next U.S. employment report. This time the BLS puts out a blockbuster number that beats expectations by a mile. That report and the continuing rally in stocks undermine interest in safe haven assets. People once again start whispering about the Fed raising interest rates. Metals and bonds both drifted lower.
So what have we learned? World events are unpredictable – perhaps even more so lately. And, in bull markets some of the biggest moves happen suddenly, when people least expect it. Blink and you’ve missed it. So you just have to hang on to your convictions, and your position, even when worry sets in.
Everyone seems to think that gold, silver, platinum, palladium and related miners are all on a moonshot now and will triple, quadruple and more — all without ever looking back.
The hate mail I’m receiving for not telling my subscribers to jump on board and chase them all to the moon is beyond belief.
But all that does is convince me why 90% of investors almost always lose money in the markets. They act like herds, chasing the latest trend. They buy the highs and bail out at the lows, in herds. Even my own subscribers show that tendency, as I can tell from their incoming emails.
Fact: No bull market goes straight up, and no bear market goes straight down.
Fact: The majority of investors act out of some kind of peer pressure, chasing highs, selling lows, always getting trapped and spilling blood.
Fact: Bull markets always retrace at least 50% to 70% of their prior rally. In the case of the first leg up, the retracement can be as much as 80% or more. Ditto, inversely, for bear markets.
Fact: Investors who chase markets almost always lose money.
I know a lot of my followers are chasing gold and silver and mining shares now. And I can tell you with near certainty, that if you are, you’re going to end up losing a lot of money.
Simply look at my latest Artificial-Intelligence Neural Net (AI) forecast of the gold data and cycles, based on thousands of data points and combined in billions of ways to come up with the most accurate forecast.

Yes, it was wrong on Brexit and the target date of June 27 turned out to be a high instead of a low. But cycle inversions are rare, and the market almost always gets back on track, so to speak, with the AI model.
I would not want to be heavily long precious metals or miners looking at this chart. It’s showing the potential for a steep slide into October.
The only way that might change is if gold were to close above $1,404.50 at the end of the month. And so far, gold can’t even get through the first major level of resistance at $1,368.
What to do if you’re heavily long gold, silver or miners? If it were me, I’d take my profits. If you’re reluctant to do so, for whatever reason, at least hedge your holdings with inverse ETFs such as DUST for mining shares … GLL for gold and ZSL for silver.
By the way, the dollar is about to explode to the upside, which will put further downside on the precious metals.
Stay safe and best wishes,
Larry
P.S. I want to send you a complimentary issue of my flagship newsletter Real Wealth Report … just click here to download now!
related:
It’s been a stellar six months for gold investors. The yellow metal has surged 28 percent year-to-date, its best first half of the year since 1974. And now there are signs that the rally is just getting started.
That’s the assessment of analysts from UBS and Credit Suisse, who see gold entering a new bull run. According to UBS analyst Joni Teves, gold could climb to $1,400 an ounce in the short term on macroeconomic uncertainty, dovish monetary policy and lower yields.
“These factors,” Teves writes, “justify strategic gold allocations across different types of investors” and should encourage hesitant investors to participate.
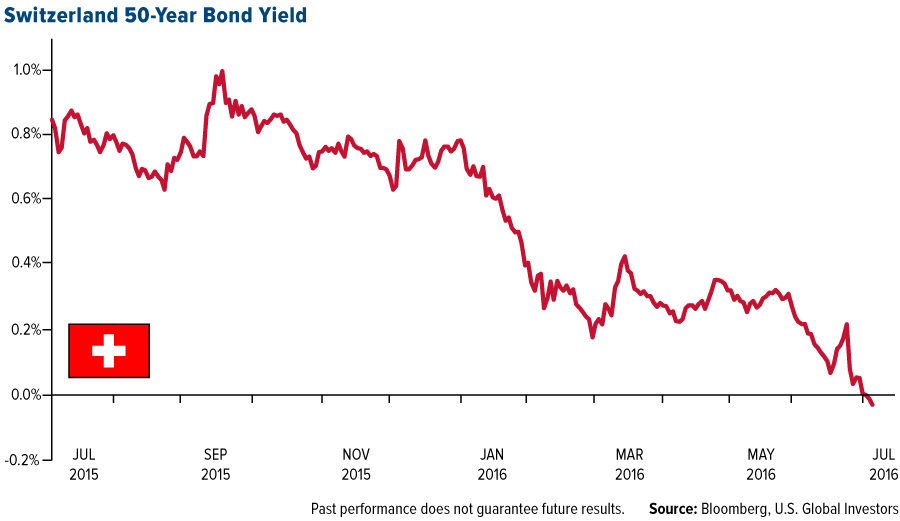
Already-low bond yields around the globe have fallen even further in Brexit’s wake, many of them hitting fresh all-time lows, including yields in the U.S., U.K., Germany, France, Australia, Japan and elsewhere. For the first time ever, Switzerland’s entire stock of bond yields has fallen below zero, with the 50-year yield plunging to negative 0.03 percent on July 5.
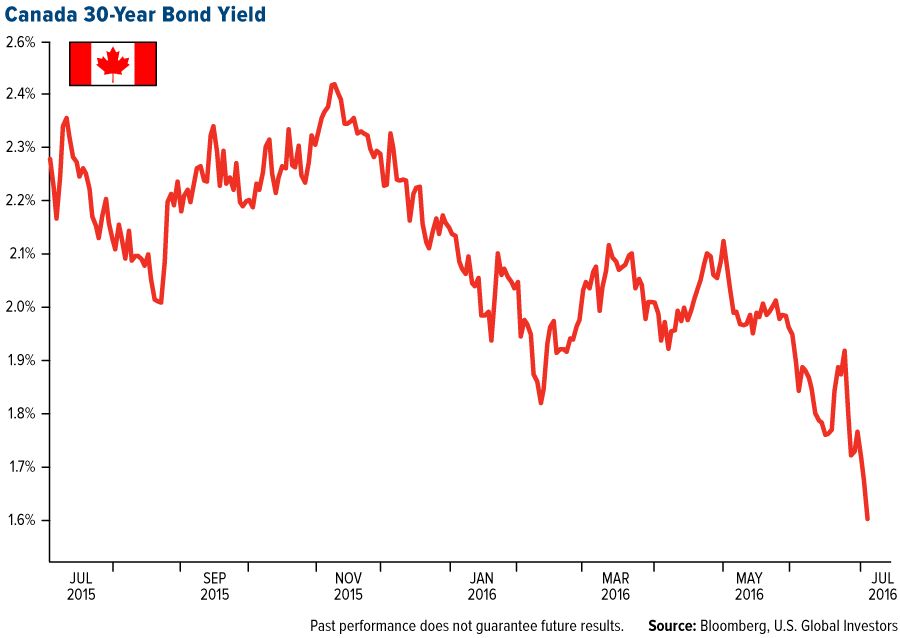
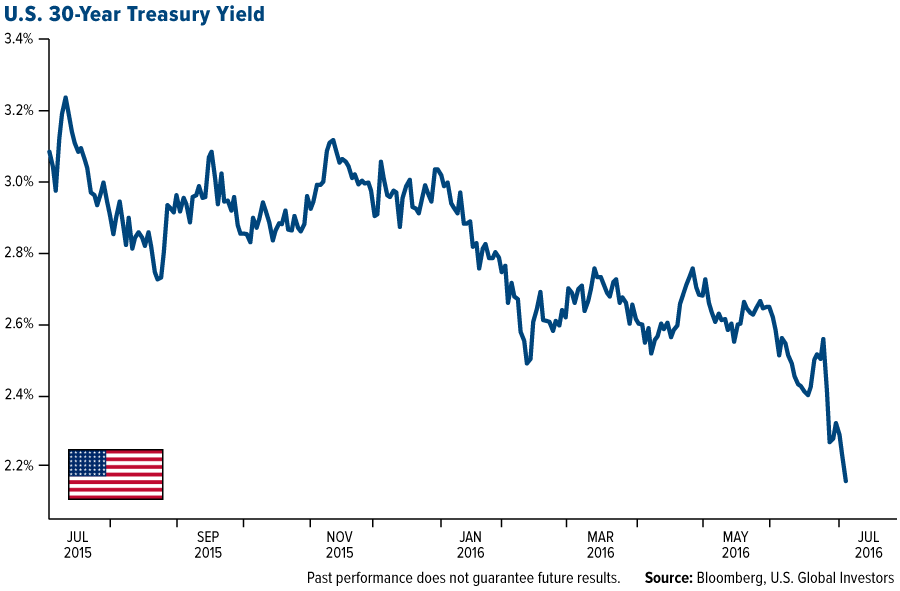
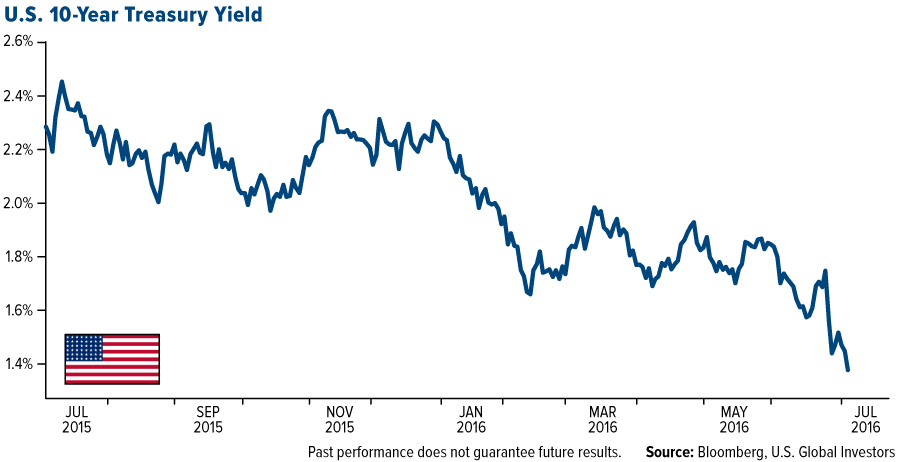
Canada’s 30-year bond yield also plunged to a record low, as did yields on the 10-year and 30-year Treasuries.
About $10 trillion worth of global government debt now carry historically low or negative yields, which are “creating negative growth” in the world economy, according to billionaire “bond king” Bill Gross in his recent Investment Outlook.
Anemic yields are also contributing to gold’s attractiveness right now. Since Britain’s June 23 referendum, the precious metal has rallied more than 8 percent, helping it achieve its best first half of the year in more than a generation.
Negative Real Rates Fuel Prices
Joining UBS in forecasting further gains is Credit Suisse, which sees gold reaching $1,500 by as early as the start of next year. As Kitco reports, Credit Suisse analyst Michael Slifirski writes that “the surprise Brexit vote has solidified and intensified macro and political uncertainty and extended the time frame for a negative real rate environment in the U.S. and potentially abroad.”
This is precisely what I told BNN’s Paul Bagnell this week, using Canada as an example. The Canadian 10-year yield is sitting just below 1 percent, while inflation in May came in at 1.5 percent. When we subtract the latter from the former, we get a real rate of negative 0.5 percent—meaning inflation is eating your lunch. Like negative bond yields, negative real rates have in the past accelerated momentum in gold’s Fear Trade.
We need only look at the end of the last upcycle in gold to see this to be the case. When gold hit its all-time high of $1,900 in August 2011, real interest rates were around 3 percent. A five-year Treasury bond yielded only 0.9 percent, and that’s before inflation took 3.8 percent. But as real rates rose, gold prices fell. Now the reverse is happening.

Gold Miners Rally
The appreciation in bullion is helping to push up gold mining stocks. The FTSE Gold Mines Index, which tracks seniors such as Barrick Gold, Newmont Mining and Goldcorp, is up a phenomenal 125 percent year-to-date.
Our own Gold and Precious Metals Fund (USERX) and World Precious Minerals Fund (UNWPX) are both performing exceptionally well, with USERX returning close to 80 percent for the one-year period and UNWPX surging nearly 100 percent during the same period.

Managed by Ralph Aldis, named a Metals and Mining “TopGun” by Brendan Wood International last year, the Gold and Precious Metals Fund holds four stars overall from Morningstar out of 71 Equity Precious Metals funds, based on risk-adjusted returns, as of June 30, 2016.
With gold having possibly entered the early stages of a new bull run, it might be time to consider gold stocks. I invite you to visit our gold funds page to learn more about what’s driving gold right now.
Please consider carefully a fund’s investment objectives, risks, charges and expenses. For this and other important information, obtain a fund prospectus by visiting www.usfunds.com or by calling 1-800-US-FUNDS (1-800-873-8637). Read it carefully before investing. Foreside Fund Services, LLC, Distributor. U.S. Global Investors is the investment adviser.

-
I know Mike is a very solid investor and respect his opinions very much. So if he says pay attention to this or that - I will.
~ Dale G.
-
I've started managing my own investments so view Michael's site as a one-stop shop from which to get information and perspectives.
~ Dave E.
-
Michael offers easy reading, honest, common sense information that anyone can use in a practical manner.
~ der_al.
-
A sane voice in a scrambled investment world.
~ Ed R.
Inside Edge Pro Contributors

Greg Weldon

Josef Schachter

Tyler Bollhorn

Ryan Irvine

Paul Beattie

Martin Straith

Patrick Ceresna

Mark Leibovit

James Thorne

Victor Adair