


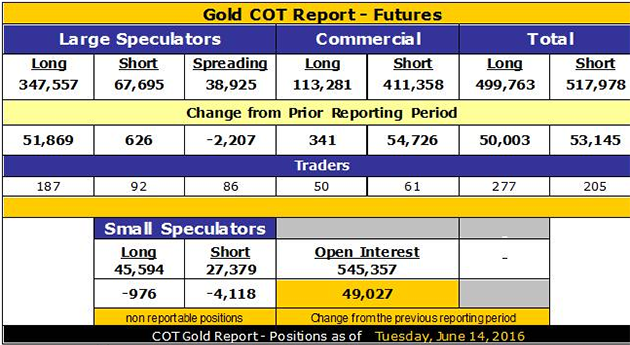
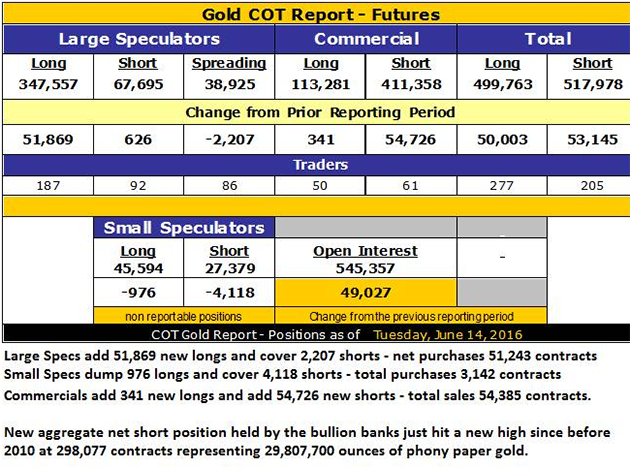
With Friday’s Commitment of Traders Report, the ridiculous has just metastasized into the sublime as the Commercial Cretins have just gone “over the top” and added another 5.4M “ounces” to their synthetic gold short position. At 298,077 contracts declared short, they are now carrying the largest short position in Crimex history. The scary part is that these figures don’t include the big rise in open interest yesterday and you just KNOW that it ballooned out due to more Cartel shorting.
While these numbers are synonymous with prior tops like in 2008 and 2011, the difference today lies in two realities: 1) The Shanghai Gold Exchange is keeping the Crimex and LBMA (London Bullion Market Association) thieves at bay through some voracious arbitrage, and 2) Raw demand from the Far East and from Western investment pools are keeping inventories tight. If this was back in 2011–2015, the market would be limit down on Monday as the criminals have their way with us. However, this is a NEW bull market and dips are to be bought while holding onto your core position for dear life as I have been trying to do with my GDXJ (Market Vectors Junior Gold Miners ETF) position. I can’t tell you how many times I have had to lock myself in the wine cellar during trading hours because the temptation to “SELL!” was so overwhelming.
The tape action yesterday was a perfect example of a textbook “sell signal” with a double top, an outside reversal and a key reversal all being lumped into one butt-ugly trading session. However, as I have written about for ages now, technical analysis rarely works at major turns in gold, and as one prominent gold guru lamented this morning: “No one would have predicted a near $40 reversal when gold was at $1,318 at 10:30 a.m. EDT!” That’s because the technical picture was letter perfect having been created—no, GROOMED—by the bullion bank trading desks with every intention of trapping in the big algobot-run funds that were chasing momentum and the technical funds that were “buying the breakout.”
So if you are getting PAID to provide people with half-assed, quasi-decent “advice,” what do you say to the poor sad-sack soul who studies technical analysis and takes countless online courses on candlestick analysis? I’ll tell you what you say—go get a refund for all of those courses because when markets are this rigged, it is useless. To prove my point, had that reversal yesterday been in copper or Proctor and Gamble stock or the Australian dollar, I would have been short going into yesterday’s close. Because it was gold (and/or silver), I refrained from acting because the right thing to do in markets this phony is the opposite of what conventional “analysis” would command. Result? Up $20 and back over $1,300. Voila!
The bullion banksters and their well-armed trading desks pulled off a wondrous reversal, but have now arrived into somewhat of a “pickle” in that the movie reel that they thought would play out with the bad guys winning and gold following through to the downside on what should have been another Freaky Friday where gold and silver get clobbered. Since it DIDN’T, they now have to await selling from the Asian markets in order to give them the slightest chance of a downside flush this coming week.
What IS a certainty is that the PMs are trading in a totally bizarre fashion, and anyone who fails to pay attention to Commercials are indeed paying no attention to “that man behind the curtain” who most certainly is pulling levers and spinning dials frantically in order to secure the desired effect while being short nearly 30 Moz of phony, synthetic gold that closed within a whisker of a new closing high for the move. There must be carloads of Pepto and adult diapers being handed out to the Cretins as the wait in agony for the Sunday night opening.
The central banks are now in deep credibility “trouble” due to the fact that not one shred of the $57 trillion spent bailing out the global banking industry has served to improve the lot and lifestyle of the middle class. Prices are spiralling northward everywhere including food and housing and services, while the policy-makers are reacting with the highly deflationary “NIRP” (negative interest rate policy) that now exists for 16% of all issued bonds in Europe and appears to be coming to a U.S. bond market close to you. These “great and powerful” central bankers are now rarely able to move markets with a single sound bite, and when they are able, it is usually to the downside. The fact that Yellen & Co. were unable to convince the bond market that growth was “robust” is a sign that the era of central bank domination is beginning to fade.
This coming week is going to be a very volatile week with all of the shenanigans going on in Europe and the vote in the U.K. Maintaining a core position in the miners amidst all of this volatility is painfully difficult if you allow yourself to get mesmerized by the short-term noise, but I find that spending a few bob on hedges is well worth it, as I’ve done with my big GDXJ position. The astounding thing that I rarely write about is the seven-week performance of the 357 Magnum Portfolio now sporting a 45% advance largely due to the incredible move in Iconic Minerals (ICM.V) which closed at $0.41 up 105% since it was added at $0.20 in late April. I helped with the recent $0.20 financing so insofar as that should constitute a disclaimer of sorts, let it be known.
related:be sure to read the excellent Clive Maund’s Gold Market Update
Originally trained during the inflationary 1970s, Michael Ballanger is a graduate of Saint Louis University where he earned a Bachelor of Science in finance and a Bachelor of Art in marketing before completing post-graduate work at the Wharton School of Finance. With more than 30 years of experience as a junior mining and exploration specialist, as well as a solid background in corporate finance, Ballanger’s adherence to the concept of “Hard Assets” allows him to focus the practice on selecting opportunities in the global resource sector with emphasis on the precious metals exploration and development sector. Ballanger takes great pleasure in visiting mineral properties around the globe in the never-ending hunt for early-stage opportunities.
Disclosure:
1) The following companies mentioned in the interview are sponsors/billboard advertisers/special situations clients of Streetwise Reports: None. The companies mentioned in this article were not involved in any aspect of the interview preparation or post-interview editing so the expert could write independently about the sector. Streetwise Reports does not accept stock in exchange for its services. The information provided above is for informational purposes only and is not a recommendation to buy or sell any security.
2) Michael Ballanger: I or my family own shares of the following companies mentioned in this article: None. I personally am or my family is paid by the following companies mentioned in this article: None. My company has a financial relationship with the following companies mentioned in this article: Iconic Minerals. I determined which companies would be included in this article based on my research and understanding of the sector. Statement and opinions expressed are the opinions of the author and not of Streetwise Reports or its officers. The author is wholly responsible for the validity of the statements. The author was not paid by Streetwise Reports for this article. Streetwise Reports was not paid by the author to publish or syndicate this article.
3) This article does not constitute investment advice. Each reader is encouraged to consult with his or her individual financial professional and any action a reader takes as a result of information presented here is his or her own responsibility. By opening this page, each reader accepts and agrees to Streetwise Reports’ terms of use and full legal disclaimer. This article is not a solicitation for investment. Streetwise Reports does not render general or specific investment advice and the information on Streetwise Reports should not be considered a recommendation to buy or sell any security. Streetwise Reports does not endorse or recommend the business, products, services or securities of any company mentioned on Streetwise Reports.
4) From time to time, Streetwise Reports LLC and its directors, officers, employees or members of their families, as well as persons interviewed for articles and interviews on the site, may have a long or short position in securities mentioned. Directors, officers, employees or members of their families are prohibited from making purchases and/or sales of those securities in the open market or otherwise during the up-to-four-week interval from the time of the interview until after it publishes.
All charts courtesy of Michael Ballanger


