Gold & Precious Metals

Clive Maund’s Gold Market Update

While the long-term outlook for gold could hardly be better, the short to medium-term outlook deteriorated substantially last week, with an important chart reversal on Thursday that was not negated by Friday’s bounceback, latest COTs coming in very bearish with record readings, and the $5,000 an ounce gold crowd hawking their wares more aggressively than ever – it’s not they are necessarily wrong, it’s just that they are naturally most vocal at tops, when they can suck in the most hopefuls.

As you may know, we have not been raving bullish on gold in recent months, largely because of the offputting COT structure, and this was not an unreasonable stance given that gold has only risen by about $20 from its early March highs as we can see on its latest 6-month chart below. Last Thursday was an important day for gold; in the early trade it advanced to new highs, but reversed violently intraday to close well down on the day on high volume, leaving behind a classic “shooting star” reversal on its chart. As we can see it didn’t reverse where it did by chance – it reversed right at the restraining upper boundary of the pattern that has formed over the past several months – and it is now becoming increasingly clear that this pattern is a flat-bottomed broadening formation. These patterns are normally bearish in purport, although the price sometimes leaps out of the top of it and spikes before reversing and dropping hard. This interpretation is supported by the latest COTs, which look horrendous, it has to be said, which we will now take a look at.

gold1year190616

….read much more HERE


….don’t miss Victor Adair on Crude Oil Hits Its Peak

Gold: The Battle For $1307

Today’s videos and charts (double click to enlarge):

gold 1307

Gold & Silver Bullion Video Analysis –

US Bonds, Dollar, & Stock Market Video Analysis –

Precious Metal ETFs Video Analysis –

SFT & SF60 Swing Trades Video Analysis –

SF Juniors Key Charts Video Analysis – 

Thanks,

Morris

website: www.superforcesignals.com

related:

George Soros Making Big Bets On Gold

About Super Force Signals:
Our Surge Index Signals are created thru our proprietary blend of the highest quality technical analysis and many years of successful business building. We are two business owners with excellent synergy. We understand risk and reward. Our subscribers are generally successfully business owners, people like yourself with speculative funds, looking for serious management of your risk and reward in the market.


  1. All institutional eyes are on the Brexit vote. In the short term, it’s the main driver of gold price discovery. 
  2. Please  click here now. In the big picture, a “Stay” vote is mildly positivefor the gold price, because England will want special privileges with its EU membership. That means other EU member countries will soon demand special privileges, too.
  3. A “Leave” vote is even more positive for the gold price, and if it’s followed by a rate hike from Janet Yellen in July, global stock markets could begin a horrific down cycle.
  4. Please  click here now. Gold is very sensitive to the price action of the US dollar against the Japanese Yen.
  5. Japan is the world’s largest creditor nation, and America is the world’s largest debtor nation. The Brexit turmoil is causing Japanese citizens and institutions to repatriate money from abroad. That puts heavy downwards pressure on the US dollar.
  6. Please  click here now. Double-click to enlarge. This hourly bars chart of the dollar versus the yen looks like a train wreck chart. 
  7. When the world’s largest creditor class goes into “risk-off” mode, powerful institutional money managers buy gold aggressively.
  8. Please  click here now. I’ve suggested that the SPDR fund (GLD-NYSE) could hit 900 tons in June, and as of this morning, it’s already at 896!
  9. During the “QE heydays” of 2009 – 2011, highly levered hedge funds were aggressive SPDR fund buyers. Sadly, that leverage meant they couldn’t hold their positions when the price dipped.
  10. Now, a lot of unleveraged private banks and value-oriented institutions are the buyers. They won’t be shaken from their positions, and they are buying gold consistently.
  11. In contrast to gold, the US stock market has substantial headwinds facing it. Value players don’t want anything to do with that market. 
  12. With QE finished, and a July rate hike looking imminent, the US stock market is looking very vulnerable. 
  13. Please  click here now . Double-click to enlarge this hourly bars chart of the Dow. It looks very toppy. For another look at that chart, please  click here now. Double-click to enlarge. 
  14. There’s a big head and shoulders top forming.
  15. The May unemployment report was truly abysmal, and the US business up cycle is about eight years old. It’s either ended, or close to ending. 
  16. Statements from Janet Yellen that the economy looks good are simply not enough to allay concerns from American money managers and creditors in Japan, about the inherent dangers in the US stock market.
  17. A rate hike that follows Brexit turmoil could put the Dow into crash mode, and send gold straight towards $1400.  
  18. Please  click here now. Double-click to enlarge this daily gold chart. 
  19. In the short term, my 14,7,7 series Stochastics oscillator suggests gold is now a bit overbought, but any weakness should be seen as a buying opportunity.
  20. Gold has a solid floor of bullish fundamentals underneath it now. That means the downside is very limited, but it’s difficult for Western money managers to overwhelm supply when India is in quiet mode, as it is now. 
  21. So, it’s important that gold market investors exhibit patience. Gold has really been trading sideways from mid-February, in a loose rectangular price pattern. Chinese New Year buying ended in February, and India is still one to two months away from serious Diwali-related dealer buying.
  22. The bottom line is that as Asian physical demand strengthens, Western money manager buying will push total global demand above total supply, and the next major leg higher for gold will be underway!
  23. Please  click here now. Double-click to enlarge. That’s the GDX hourly bars chart. Some analysts think that gold stocks have come “too far, too fast”, and perhaps bullion will outperform the gold stocks now. 
  24. I beg to differ. If gold can make it to the $1400 area, the profits made by gold companies can increase dramatically, and that would unleash a fresh round of powerful institutional buying. Gold stocks should not only continue to lead bullion in the second half of 2016, but they appear poised to increase that outperformance!

Thanks! 

Cheers
st

Jun 14, 2016
Stewart Thomson  
Graceland Updates
website: www.gracelandupdates.com

related:

George Soros Making Big Bets on Gold

George Soros Making Big Bets on Gold

George Soros has joined fellow billionaire investors Stan Druckenmiller and Ray Dalios on investing big in gold. Precious metals expert Michael Ballanger explains what is behind these moves.

111

Global Asset Allocations

This week George Soros once again came out with his very large directional “bets” for the S&P 500 and for gold and, needless to say, Mr. Soros is once again shorting the S&P and buying gold and gold miners, joining Ray Dalio, Stanley Druckenmiller and Michael Ballanger (just kidding) in a decidedly unpopular stance. Carl Icahn came out in agreement during a CNBC interview this week that left the interviewer near-speechless and groveling in the mud of anti-Wall Street rhetoric. 

In the meantime, some of the smartest investors I know are SOOOO bullish on gold that they are buying huge baskets of penny explorers under a nickel because of the leverage contained when the public finally decides to re-allocate to include gold (and mining stocks). A fund manager I know said to me, “Must be the top!” in reference to this, but it really can’t be the top after a five-month rally representing the largest recorded quarterly advance in mining shares since recordkeeping began. 

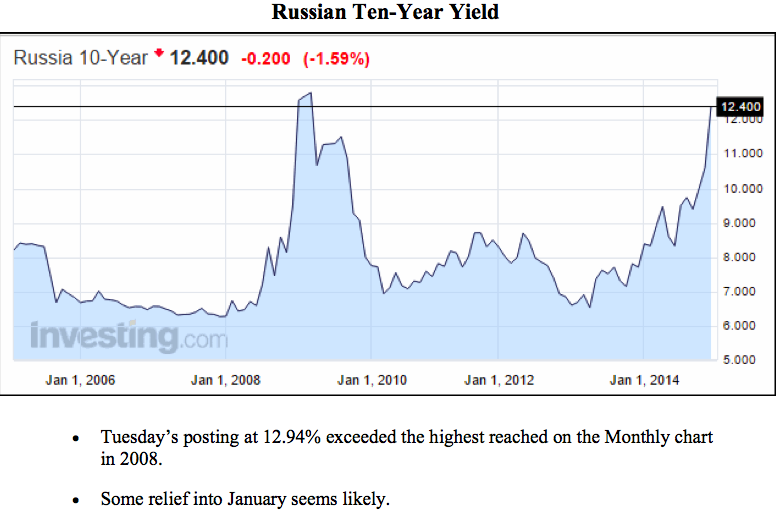
Look at the chart above and think what would happen if we were to get a shift from bonds to gold; 49% of global asset allocations reside in bonds while 1% reside in gold. Now, consider these two facts: 
1. Since the 2008 financial crisis, governments have issued $57 TRILLION in new, fresh-off-the-press, paper in order to keep the system afloat. 
2. Most of the global banking cartel has made a move toward negative interest rates, which means that there is tremendous risk in carrying a 49% allocation to bonds. 

Now imagine the impact given that the total dollar value of all aboveground gold reserves plus the value of every major gold producer on the planet is a mere fraction of the value of the global bond market. The panic-driven rush to the gold sector seen in the first quarter will pale by comparison if, as and when the larger pension funds decide that maybe—just maybe—a reduction in bond exposure in favor of gold exposure might be considered “prudent.” 

As far as the indiscriminate inhaling of penny mining issues with little or no regard for quality or valuation, I commented on the TSX Venture Exchange on May 23rd with the TSXV at around 680, and in a few short weeks it has broken to 715 on big volume. Whether or not it is well-advised to buy penny mining issues up nearly 60% in a few months is NOT the issue; it is losing one’s position when one has been a buyer all through 2014 and 2015 and is now finally up money and in some cases, HUGE money. You take all of the risk in 2015 and then sell at a breakeven or small profit in 2016? I don’t think so. . . 

222

On May 31, I posted a chart with the following comment: “I am tiptoeing back into the world of ‘Long Volatility’ with a one-fifth position in the UVXY (ProShares Ultra VIX Short-Term Futures) July $10s for $2.40,” after which the VIX (Volatility S&P 500) cratered for a week, taking the UVXY down from $10.45 to $9.35 and the calls down into the $1.80 range. Today (June 10), the VIX has exploded out of the gate with a 17.3% move to above $17 with the triple-leverage, public-screwing ETF (UVXY) gaining a similar 17% move to over $12.00. I added a few more of these calls on Tuesday at $1.95 and am now sitting on a 40% position and might add more this afternoon. I will be selling 50% at $5.50 and riding the balance to what I think could be $15–25 if we get the storm that I see on the horizon. 

333

COT Report
More of the same shenanigans we have been forced to live with since Day One. 

444

There are very large and very ominous storm clouds way off on the horizon and the reason I know they are coming our way is that there is a lot of pacing, panting and scratching going on with strange snarling and growling noises emanating throughout the room. That’s always an omen of volatility coming down the road because that type of behavior is consistent with trouble. 

Originally trained during the inflationary 1970s, Michael Ballanger is a graduate of Saint Louis University where he earned a Bachelor of Science in finance and a Bachelor of Art in marketing before completing post-graduate work at the Wharton School of Finance. With more than 30 years of experience as a junior mining and exploration specialist, as well as a solid background in corporate finance, Ballanger’s adherence to the concept of “Hard Assets” allows him to focus the practice on selecting opportunities in the global resource sector with emphasis on the precious metals exploration and development sector. Ballanger takes great pleasure in visiting mineral properties around the globe in the never-ending hunt for early-stage opportunities. 

Want to read more Gold Report articles like this visit our Streetwise Interviews page. 

related: New Leg Higher For Gold

Disclosure:
1) Statements and opinions expressed are the opinions of Michael Ballanger and not of Streetwise Reports or its officers. Michael Ballanger is wholly responsible for the validity of the statements. Streetwise Reports was not involved in any aspect of the article preparation or editing so the author could speak independently about the sector. Michael Ballanger was not paid by Streetwise Reports LLC for this article. Streetwise Reports was not paid by the author to publish or syndicate this article. 
2) This article does not constitute investment advice. Each reader is encouraged to consult with his or her individual financial professional and any action a reader takes as a result of information presented here is his or her own responsibility. By opening this page, each reader accepts and agrees to Streetwise Reports’ terms of use and full legal disclaimer. This article is not a solicitation for investment. Streetwise Reports does not render general or specific investment advice and the information on Streetwise Reports should not be considered a recommendation to buy or sell any security. Streetwise Reports does not endorse or recommend the business, products, services or securities of any company mentioned on Streetwise Reports.
3) From time to time, Streetwise Reports LLC and its directors, officers, employees or members of their families, as well as persons interviewed for articles and interviews on the site, may have a long or short position in securities mentioned. Directors, officers, employees or members of their families are prohibited from making purchases and/or sales of those securities in the open market or otherwise during the up-to-four-week interval from the time of the interview until after it publishes.

All charts courtesy of Michael Ballanger

U.S. Silver Imports Surge To New Monthly Record

With leading indicators pointing to a decline in economic activity, U.S. silver imports surged in March. How much did U.S. silver imports increase?  They jumped by nearly 20% compared to the previous month.  If we take a look at the chart below, we can see how much U.S. silver imports in March increased compared to January and February:

Total-U.S.-Silver-Imports-JAN-MAR-2016

…..read more HERE

related:

Don’t miss Ace analyst, Martin Murenbeld spelling out where gold’s going HERE