
Gold & Precious Metals
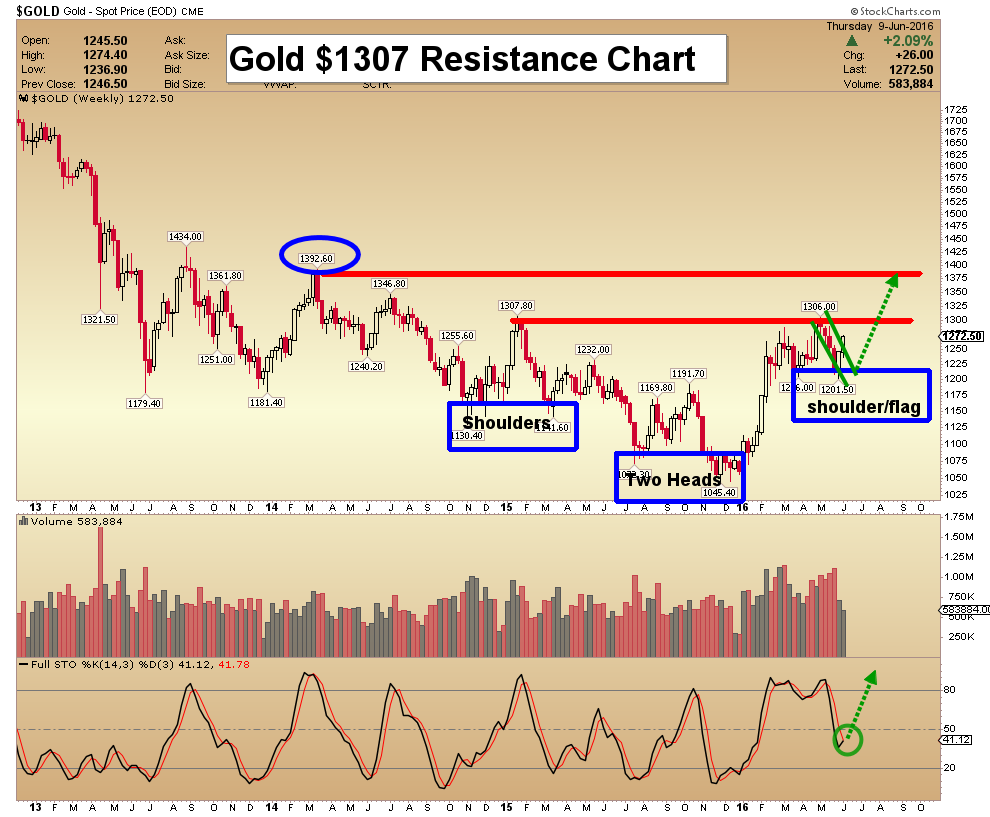
Ever since that abysmal payrolls number hit the wires, gold has performed exceedingly well. Morris Hubbart makes his case for higher prices:
Gold & Silver Bullion Video Analysis
US Bonds, Dollar & Stock Market Video Analysis
Precious Metal ETFs Video Analysis
SFT & SF60 Key Swing Trades Video Analysis
SFJ Key Junior Stocks Video Analysis
Thanks,
Morris
related” Top 10 gold producing mines

“no way are the metals or miners going straight up from here. No way are they on a rocket rise that will never look back. And no way should you jump on board with both feet. You’ll surely lose it all”
Gold’s bounced a bit, and now, everyone wants my head. They figure — again — that gold is ready to blast off to $1,300 … then $1,350 … then $1,500 and even higher, without ever looking back.
They say the background environment for gold — and other precious metals and mining shares — has never been more bullish.
I say, baloney! Yes, gold has bottomed, last December. Yes, gold, the precious metals and miners are in new bull markets that will see much higher prices and could last for years.
But no way are the metals or miners going straight up from here. No way are they on a rocket rise that will never look back. And no way should you jump on board with both feet. You’ll surely lose it all.
For one thing, gold is still extremely overbought. It would be very hard for gold to make much upside progress being so overbought.
For another, according to the most recent Commitments of Traders report (COT), gold and silver still have way too many speculative long positions open versus commercial short positions.
That’s a recipe for a hard fall, not a continued rally.
For yet another, the precious metals are entering the seasonally weak summer months, a period of lackluster physical demand around the globe.
And for yet another, Janet Yellen is still poised — in my opinion — to raise rates in June, rather than July. Even if I’m wrong, so what? Then she will likely raise rates in July.
Then, of course, there’s the U.S. dollar, which is still holding its own, biding its time, but ready to break out to the upside again, and soon.
I also urge you to take another look at the Artificial Intelligence forecast chart of gold that I showed you last week, repeated here.
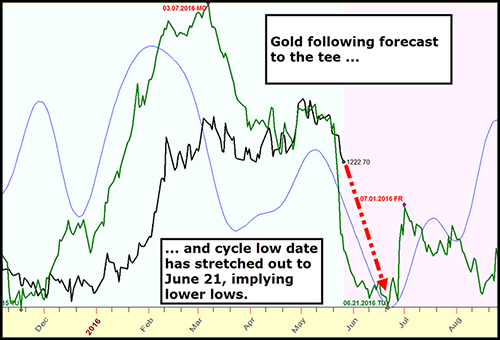
That forecast has not changed!
What about silver, platinum, and palladium?
All pretty much the same. They will follow gold’s lead.
What about the mining sector, which has started to pull back?
I’m as anxious as you are to load up on miners. But they too are extremely overbought and overvalued right now.
In fact, according to a recent report from Morgan Stanley Australia, miners are now extremely overvalued. Example: Newcrest Mining (NCM.Australia) trading at $21.76 Australian Dollars, compared to fair value of $A12.90. That’s 68% overvalued.
Northern Star Resources (NST.Australia) trading at $A4.74 compared to fair value of $A3.45. That’s 38% overvalued.
Morgan Stanley is right. Be patient: The pullback I have forecasted has started, is still on track, and should bottom later this month.
Then it will be time to load up!
Best wishes, as always …
Larry
http://www.moneyandmarkets.com
related: Given the correction Rambus Chartology has an excellent take on Gold Stocks: Be Prepared
There are two patterns I’m watching very closely in here on the HUI which will be a proxy for the rest of the PM stock indexes. This first chart is daily chart which shows the three small consolidation patterns that have formed since the January low. The top pattern basically completed its fourth reversal point today which is an expanding falling wedge. One of two things will most likely happen tomorrow. If this is the correct consolidation pattern then we will most likely see a breakout gap above the top rail which should lead to the next impulse move up. The second scenario would be to see the top rail hold resistance and a move down to the bottom rail of the expanding falling wedge where the 38% retrace would come into play around the 183 area. This pattern is complete except for the breakout.
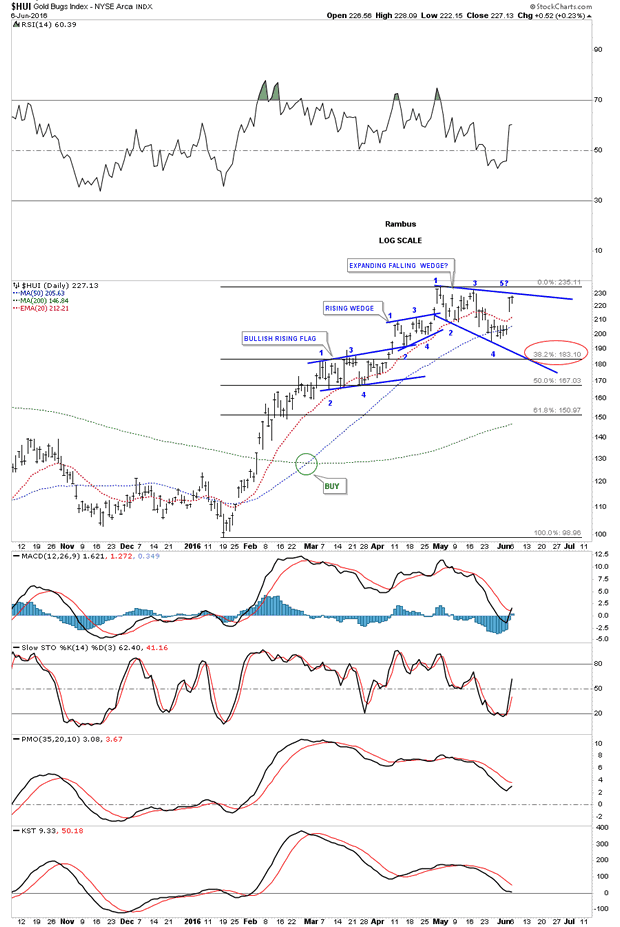
Below is another daily chart we’ve been following which shows a possible bigger consolidation area forming with the second reversal point coming into play at the top of the trading range. If and that is a big if, if the top of the trading range does hold resistance then we’ll need to see one more decline toward the bottom of the trading range to complete the 3rd reversal point, which would then setup the all important area to begin the fourth reversal point back up to the top of the trading range to complete whatever consolidation pattern develops. We won’t know what pattern we have until we have the four reversal points in place. As bullish as this sector seems right now it’s hard to imagine that big gap getting filled but it’s a possibility. There are no laws though that says the gap has to get filled, it’s just that most of the time they do get filled at some point.

This next daily chart for the HUI would be the most bullish pattern we could ask for. The initial rally that began at the January low to the April high could be called a flag pole. Whatever consolidation pattern we get starting from the April high would be called the flag. The blue trendlines shows the two most likely patterns that may form the flag. I’ve also added a horizontal dashed line at the top and bottom of the trading range that would show a rectangle. So there is a possible triangle, falling flag or rectangle that could form the flag. The most important thing to watch right now is what happens up here at the top of the trading range.The blue arrows would measure the halfway point from where ever the last reversal point takes place in the bull flag. The higher the last reversal point the higher the price objective.
If the HUI gaps up big tomorrow morning then the first chart we looked at, the expanding falling wedge, will most likely be the next consolidation pattern that leads the next impulse move up. The bottom line is to be prepared for either scenarios.

I’ve been watching the $CDNX for clues also, which may have given us a big one today. I wanted to wait for the end of the day to see if the price action held above the top rail of its small blue rising wedge. It did and closed at the high for the day. The blue bullish rising wedge would equate to the first pattern we looked at on the HUI which was the falling expand wedge.The blue arrows measures the first impulse move up that was separated by the bullish expanding rising wedge as the halfway pattern. The red arrows measures the second impulse move up if the blue bullish rising wedge works out as a halfway pattern. The rally would probably last four to five weeks before the price objectives are reached. Again have your favorite PM stocks ready to go in case this scenario plays out.

related:
“Silver does have a history of climbing in price higher and faster than just about any other asset and a multitude of factors now point to another massive price move higher ahead”
After studying the silver market closely for more than three decades, I find it nearly unbelievable that its single most important price factor is widely unknown. Admittedly, the vast majority of the investment world has little interest in silver and that’s unlikely to change any time soon. But underappreciation has its merits in the investment world…..continue reading HERE
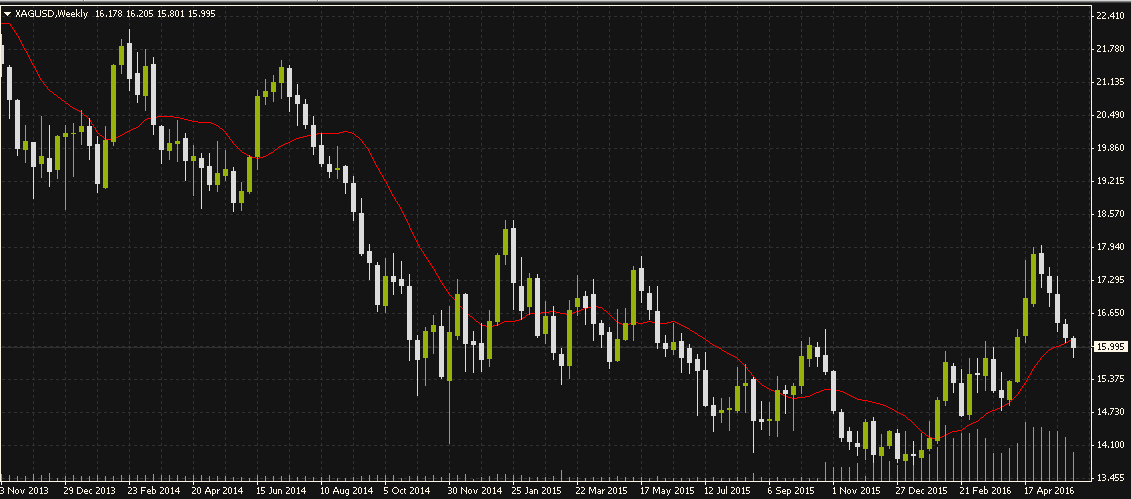
Weekly Chart Above – Last price $15.99 at 11:02 pm June 2nd
related by Larry Edelson:


-
I know Mike is a very solid investor and respect his opinions very much. So if he says pay attention to this or that - I will.
~ Dale G.
-
I've started managing my own investments so view Michael's site as a one-stop shop from which to get information and perspectives.
~ Dave E.
-
Michael offers easy reading, honest, common sense information that anyone can use in a practical manner.
~ der_al.
-
A sane voice in a scrambled investment world.
~ Ed R.
Inside Edge Pro Contributors

Greg Weldon

Josef Schachter

Tyler Bollhorn

Ryan Irvine

Paul Beattie

Martin Straith

Patrick Ceresna

Mark Leibovit

James Thorne

Victor Adair