
Gold & Precious Metals
“the latest Commitment of Traders (COT) report shows yet again another record high of speculative long positions in the gold market. Do not underestimate this. It is extremely bearish.”
Just last week — in one of my strongest warnings yet — I told you that gold’s decline wasn’t over. I received a lot of flak for that one. After all, many of the very best analysts in the world and some of the top hedge fund managers were all very bullish on gold.
But gold did indeed slide. Quite a bit, falling from as high as roughly $1,257 last Monday to as low as $1,206 on Friday.
So what’s next for gold? For silver? For the other precious metals? For mining shares?
My answer: After a brief bounce, still lower for all of them.
Why? Three chief reasons:
First is the degree of the slide into June 21 shown on this chart. It’s very sharp, very steep.

It’s my latest artificial-intelligence forecast chart of gold. You can clearly see that not only is gold following the green forecast line to a tee, but that there is also no bottom in sight until around June 21.
Second is the fact that gold has now closed well below an important support level at $1,226.
That’s bearish for gold heading into June. On a bounce, we may see a retest of the $1,226 level, but then gold would head to new lows in late June.
Third is the fact that the latest Commitment of Traders (COT) report shows yet again another record high of speculative long positions in the gold market. Do not underestimate this. It is extremely bearish.
At a record number of long positions in gold — even more long positions than when gold went over $1,900 in September 2011 — this is indeed a very bearish sign. It means that despite the recent selloff in gold, the longs have not yet been spooked enough into a panic.
That panic will soon come, probably in June, and it will likely push gold down to the major support levels at $1,160 to $1,140.
Ditto for silver and the other precious metals, as well as for most mining shares.
So what should you do if you didn’t listen to me and you got caught in this rally and in mining shares … and you are now facing the potential for steep losses?
A. You can sweat it out and hold your positions and hope you come out the other side okay.
B. You can hedge using inverse ETFs for gold, silver or miners, such as GLL, ZSL,
and DUST. Or …
C. You can exit your positions on a bounce … and get back in when the metals and miners bottom in the latter part of June.
If it were me, I’d choose “C.” But that’s just me.
Meanwhile, I am overjoyed with the decline in the precious metals. And so are my subscribers. I forewarned them of this decline and I have them fully prepared now to capitalize on it as the decline comes to a close in the latter part of June.
In fact, they’re going to be positioned in such a way that I expect them to make a lifetime of profits — a few times over — in just the next three to five years, as gold works its way back up to its destiny of over $5,000 an ounce.
Thing is, most investors won’t participate. Many will get burned because of the recent pullback, and they won’t come back into the metals market, if at all, until it’s too late.
Others won’t be buyers because — as I’ve said all along — the new bull market in precious metals and miners won’t be built on the backbone of inflation …
But instead, on the backbone of governments gone madly insane, authoritarian, and bankrupt.
For evidence, all you have to do is scan the globe and you’ll clearly see the trouble the world is in. From the Middle East and Russia to the Far East and Europe. And from Europe to the United States.
The handwriting is on the wall. All you have to do is time your investments right.
Best wishes, as always …
Larry
.….for Free Report from Larry click HERE
….related: Record Surge In Demand For Gold

SWOT Analysis: Global Demand for Gold Is Highest Ever For a First Quarter
– Strengths
- Investors seek safe haven investments in a time of economic fragility and uncertainty caused by negative interest rates, reports China Daily. The article continues by pointing out that buying U.S. Treasuries or other sovereign debt from Western countries has also become a “less attractive option for central banks because of their low yields.”
- This week the World Gold Council reported that in the first quarter of 2016 global demand for gold was 1,290 tons – the highest ever for a first quarter
- The best performing precious metal this week was silver, down 1.82 percent.
- According to data from the Commerce Department on Thursday, orders for U.S. capital goods declined unexpectedly in April for a third straight month, reports Bloomberg. With American manufacturers continuing to pull back, this could indicate a lesser chance for the Federal Reserve to raise rates in June.
- The global manufacturing purchasing managers’ index (PMI) is on track to decline in May, reports Cornerstone Macro. The research group believes this is a likely outcome given declines in the May Japanese and eurozone manufacturing PMIs, as well as a probable decline in the U.S. manufacturing PMI. Cornerstone points out a handful of important global tailwinds in its report including low interest rates and healthy U.S. growth, but says there are even more headwinds that include a China slowdown, excess emerging market debt and a Brexit risk, to name a few
– Weaknesses
- The worst performing precious metal for the week was platinum, down 4.40 percent.
- Gold traders are bearish for a second week – the first successive week since mid-April – as bets increase on an interest rate move from the Fed, reports Bloomberg. The Fed Funds futures show the odds of a rate increase by July seen at 52 percent, up from 48 percent at the end of last week.
- Following a pause in the dollar’s rally this week, Bloomberg reports that gold snapped six days of losses, rebounding from the lowest level in seven weeks. The article continues, stating that gold is still headed for the biggest monthly drop since November on speculation the U.S. Federal Reserve will increase U.S. borrowing costs as early as next month, denting demand for bullion.
- As Venezuela’s economic crisis deepens and the government faces concerns that it could struggle to honor bond payments, the country held the biggest gold sale by a central bank in eight years, reports Bloomberg. According to data from the International Monetary Fund, Venezuela cut its gold reserves by 16 percent in the first quarter, following a 24 percent reduction in 2015.
– Opportunities
- The Fed may be bluffing on a rate hike, according to Mark Matthews, Head of Investment Research at Julius Baer Group. In an interview with the Economic Times, Matthews discusses the Fed’s history of contradicting itself, most recently on its stance back in February and March. “I think they did not like the fact that the market was not pricing in any rate hikes this year,” Matthews said. “They wanted to have some implicit threat of a rate hike in the market and they have largely achieved that now.”
- Analysts at RBC Economics have come out stating that despite the “surprisingly hawkish” minutes from the Fed, raising rates in June is “nearly impossible.” In a report released Tuesday by RBC, the group stated “We think a lot of things have to align in order for the Fed to justify a lift at the July confab. September is still complicated by Money Market reform, and November falls right on top of the U.S. presidential election.”
- Deutsche Bank, in a recent note, says that by preparing markets for future interest rate hikes, the Federal Reserve potentially hampers its ability to actually carry out those hikes in the future, reports Business Insider. The article continues by stating, that said in another way, “The Fed appears stuck in a negative feedback loop wherein suggestions that higher rates are coming create the unsettled conditions that ultimately force the Fed to keep rates right where they are.
– Threats
- UBS believes that gold is set to “roll over,” reports Bloomberg, forecasting bullion to drop back to $1,150 an ounce. The yellow metal could tumble as the U.S. dollar “erodes demand with the Federal Reserve opting for not one, but two rate increases before the year-end,” according to UBS Group AG’s wealth-management unit. Not everyone sees a retreat in gold however. Citigroup raised its year-end target by $100 to $1,250 an ounce, reports Bloomberg.

- In an interview with CNBC this week, Dennis Gartman cautioned investors on when he believes they should come off the sidelines for gold. He says the time to be bullish on gold is not until after the first interest rate hike of the year. Assuming that a rate increase will happen in 2016, he thinks investors should avoid the precious metal in the near term, as he expects an active market to remain after the central bank acts, reports CNBC.
- Retailers in Hong Kong are forecast to see the worst downturn in gold sales in at least 15 years, reports Bloomberg. Fewer mainland shoppers are spending less money on jewelry, the article continues, and China’s economic slowdown and anti-corruption campaigns have hurt luxury retailers in Hong Kong with visits by Chinese tourists.
Frank Holmes – US Global Investors
related: Clash of Titans Propels Gold

Last week we highlighted our gold stocks bull analog chart which showed the gold stocks correcting at least 20% at this point during both the 2008-2009 and 2000-2001 recoveries. We concluded that gold stocks were likely to continue to correct in the days and weeks ahead. While that has played out so far, we should also note that Gold is suddenly looking more vulnerable.
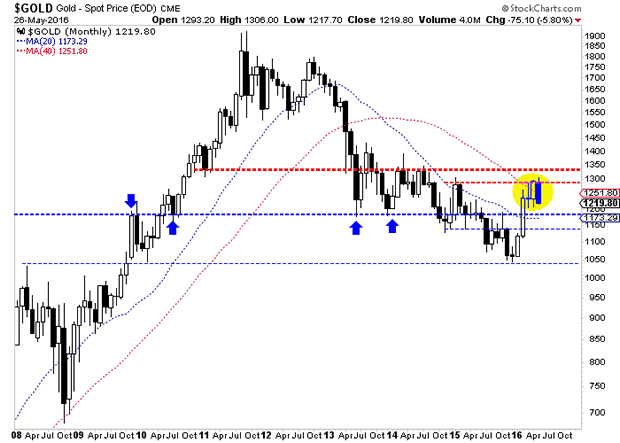
Unless Gold has a big bounce the next two days then its monthly chart will show a bearish engulfing candle for the month of May. That implies weakness in June. Key support levels are $1180 and $1140. The bearish reversal in May takes Gold back below its 40-month moving average at $1252. The 40-month moving average has been an excellent trend indicator for Gold throughout its history and it is the last line of defense for bears. They defended it, now bulls will need to defend $1180 and $1140.
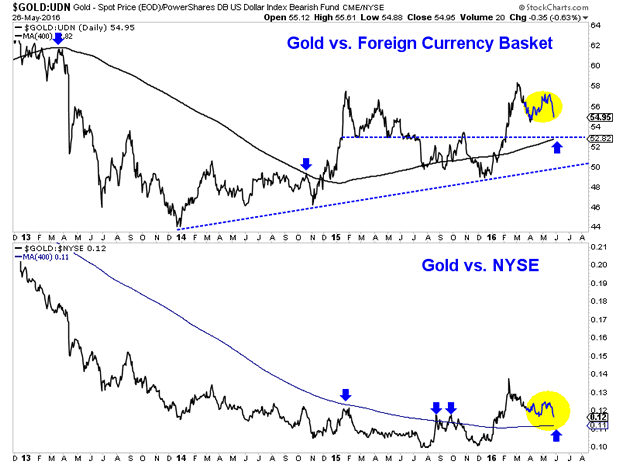
Equally as troubling for bulls, Gold has lost strength in real terms as it is acting poorly against foreign currencies (FC) and the equity market. Since Gold/FC touched a 3-year high in February it has undergone a sustained correction. Meanwhile, Gold/equities has already retraced most of its winter gains. Look for these ratios to continue lower and test their 400-day moving averages.
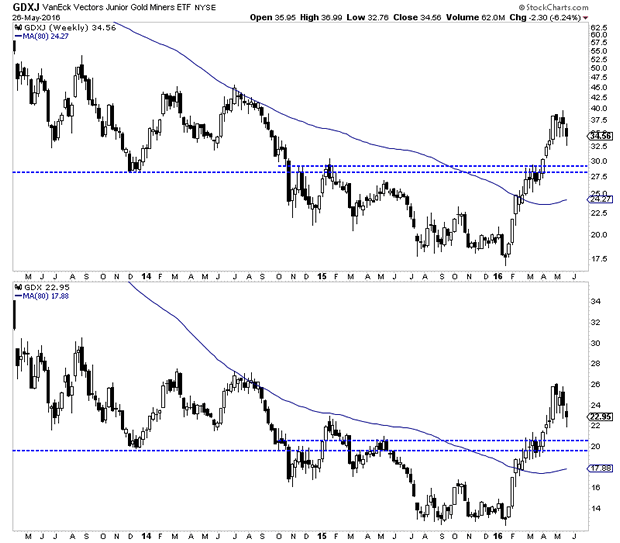
Meanwhile the miners have obviously begun a correction. GDX and GDXJ were already off 16% and 17% respectively at Wednesday’s lows. Even though the miners did not reach their 2014 resistance highs they still reached the second most overbought point in the past 20 years. GDX’s parent index, $GDM’s distance above its 100 and 200-day moving averages was the second greatest in the past 20 years. That leads us to believe that the correction is likely to be greater than the routine 20%.
The weekly charts of GDX and GDXJ are shown below with the blue lines showing downside support targets. GDX should find good support around $20 while GDXJ should find support at or below $30. A move just below $20 equates to a 25% correction in GDX.
The precious metals sector has begun a sizeable correction and it figures to continue into June. Gold needs to regain strength soon in real terms or it could undergo a deeper and longer retracement of its recent rebound than initially anticipated. We will continue to take first cues from the miners which should continue to lead the sector in the weeks and months ahead. Those who have been waiting for a buying opportunity could have their first chance in the weeks ahead.
also from Jordan Roy-Bryne: Gold Stocks Following Bull Analogs

-
I know Mike is a very solid investor and respect his opinions very much. So if he says pay attention to this or that - I will.
~ Dale G.
-
I've started managing my own investments so view Michael's site as a one-stop shop from which to get information and perspectives.
~ Dave E.
-
Michael offers easy reading, honest, common sense information that anyone can use in a practical manner.
~ der_al.
-
A sane voice in a scrambled investment world.
~ Ed R.
Inside Edge Pro Contributors

Greg Weldon

Josef Schachter

Tyler Bollhorn

Ryan Irvine

Paul Beattie

Martin Straith

Patrick Ceresna

Mark Leibovit

James Thorne

Victor Adair