
Gold & Precious Metals
This year’s first quarter is one for the history books. Not only did gold appreciate at its fastest pace in 30 years, but demand for the yellow metal was the strongest it’s ever been on record.
Let me repeat that: the strongest it has ever been.
Demand surged 21 percent from the same period a year ago, according to the latest World Gold Council (WGC) report. Most of this demand was driven by investment, with net inflows into gold ETFs reaching 363.7 tonnes, a seven-year high.

Meanwhile, demand for bars and coins shot up 55 percent year-over-year, from 11.8 tonnes to 18.3 tonnes. Appetite for American Eagles coins jumped 68 percent.
Bad News Is Good News for Investors Who Have Diversified with Gold
Uncertainty over the world economy, not to mention central bank policy, continues to act as a major catalyst for demand, heating up the Fear Trade. With many countries currently locked in a global race to see who can devalue their currencies the fastest, investors are seeking better, more reliable stores of value, and gold is happy to oblige.
 This was the message shared by Wayne Allyn Root, the “Capitalist Evangelist,” whose presentation I had the pleasure to see at the MoneyShow last week in Las Vegas. The week before last I said I would be speaking at the event, which was founded in 1981 by my dear friend Kim Githler, and I had no idea how popular Root really was. A businessman, politician and author, Root was the vice presidential candidate for the Libertarian party in 2008 and this year endorsed Donald Trump for president. At the MoneyShow, he packed the room with 1,400 people. Whole crowds turned out to hear him sermonize on entrepreneurship, individual rights and the importance of owning tangible assets such as precious metals and rare coins as a hedge against inflation and today’s uncertain financial markets. Owning gold, he said, is no longer a luxury but a necessity.
One of Root’s most interesting data points is just how much purchasing power the dollar has lost since 1913, the year the Federal Reserve was created: A million dollars then is worth about $25,000 today. Gold, on the other hand, has not only held its value but appreciated. One million dollars in gold in 1913 would now be worth more than $60 million.
Other huge names that presented at the MoneyShow included Gary Shilling, Art Laffer and Craig Johnson, a Piper Jaffray CFA and President of the Market Technicians Association. I had an enjoyable dinner with Craig, who called the current rally a “FOMO” rally. (I only recently learned, from my niece, that FOMO stands for “fear of missing out” and is widely used on social media.)
Another illuminating presentation I’d like to mention was conducted by IBD’s Amy Smith, who convincingly spoke on how the 2016 elections might change the stock market. The most actionable takeaway was that most blue chip stocks have typically done well no matter who occupies the White House, confirming my own attitude that, at the end of the day, it’s the policies that matter, not the party. The most compelling example she used was Netflix, whose stock has been a steady climber throughout both Bush 43 and Obama’s presidencies.
A reasonable, well-positioned portfolio, then, consists of strong, entrepreneurial names; gold (I always recommend a 10 percent weighting: 5 percent in gold stocks, 5 percent in physical bullion); and short-term, tax-free municipal bonds, which have historically done well even in times of economic turmoil, such as the tech bubble and the financial crisis.
Follow the Smart Money
The smart money is indeed flowing into gold right now. Earlier this month I shared with you the fact that hedge fund manager Stanley Drukenmiller, notable for having one of the best money management track records in history, cited gold as being his family office fund’s number one allocation. Druckenmiller is joined by billionaire Paul Singer, whose hedge fund oversees $28 billion. In his letter to clients last month, Singer wrote: “It makes a great deal of sense to own gold… Investors have increasingly started processing the fact that the world’s central bankers are completely focused on debasing their currencies.”
About a third of global debt right now comes with a negative yield.
Elsewhere in the letter, Singer suggested that gold’s phenomenal first quarter, in which the metal rose 16.5 percent, is “just the beginning.” Further loss of confidence in central bankers’ ability to jumpstart growth could take the metal even higher.
This is the assessment of Paradigm Capital, who wrote in a recent report that “a standard gold price rally, a percentage exceeded or achieved in four of five major upcycles since 1976, would take us to around $1,800 ounces over the next three to four years.”
Lucara Diamond Sparkles Brightly

It seems only natural to follow a discussion on gold with one on diamonds. Just as gold demand is largely driven by the Love Trade, especially in India and China during religious and cultural festivals, diamonds rely largely on celebratory lifestyle events such as engagements, weddings and anniversaries.
Lucara Diamond has given us another reason to celebrate.
The Vancouver-based company was founded by billionaire Lukas Lundin, an old friend. We believed in his vision to build a profitable diamond company in South Africa, and we were one of its earliest investors. In any case, Lucara just sold an incredible 813-carat diamond for $63 million, a new record for a rough gem. Known as “The Constellation,” the rock was discovered in the company’s Karowe mine, located in Botswana, the second largest diamond producer following Russia. In 2013, diamonds accounted for more than 80 percent of the small African country’s export earnings and 26 percent of its GDP.
As part of the deal, Lucara retains a 10 percent interest in the diamond, allowing the company to continue to profit from the stone after it’s been polished and cut.
The Constellation’s record might be short-lived, however. Another Lucara diamond—the 1,109-carat “Lesedi La Rona,” the second largest diamond ever discovered—is scheduled to be auctioned off next month at Sotheby’s and could very well fetch an even higher price.
We’ve been very happy with Lucara’s leadership and performance. So far this year, its share price has appreciated 75 percent and is now trending at a nine-year high.

The mid-tier company posted a stellar first-quarter net income of $17.1 million, up 185 percent from the same period a year ago. Total sales averaged $649 per carat, compared to $278 per carat in 2015. This is especially impressive considering overall diamond prices have declined more than 10 percent over the last 12 months, according to the Zimnisky Global Rough Diamond Price Index, mainly due to subdued demand and excess supply.
Frank Holmes
CEO and Chief Investment Officer
U.S. Global Investors
related: Massive Silver Rally During The Coming US Dollar Collapse


The gold stocks started to correct this week as large caps were off 13% at Thursday’s low. Both juniors and large caps have made tremendous gains since the January 19 bottom and are ripe for some profit taking. The Fed minutes provided the catalyst for such and we should also note the tendency for gold stocks, while in a bull market to peak in May. History argues that the miners could correct at least 20% now before moving higher.
Below is the HUI Bull Analog chart which is updated through Wednesday. At this point in the 2008-2009 recovery the HUI corrected 22% and at this point in the 2000-2001 recovery the HUI corrected by 20%.

Next is the bull analog of our custom Junior Gold Index. The index contains 18 stocks and a median market capitalization of ~$300 Million. Note how the current recovery has tracked the 2008-2009 recovery with precision. If that continues, juniors would continue to trend higher while enduring two 26% corrections in the next four months.
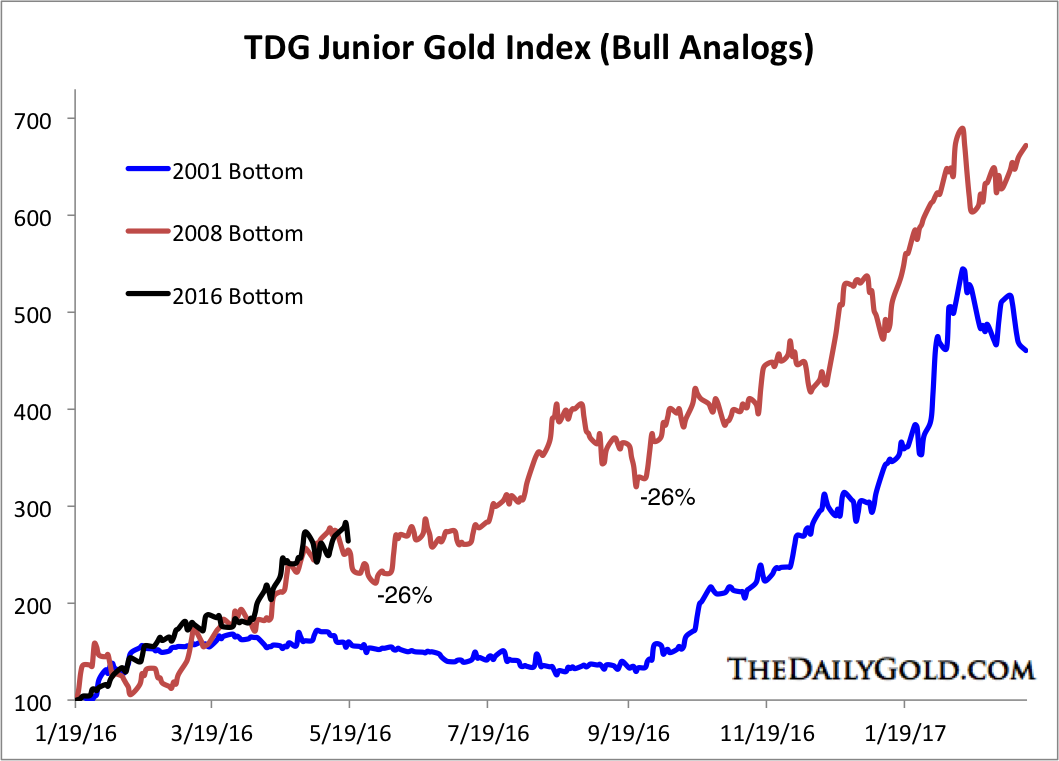
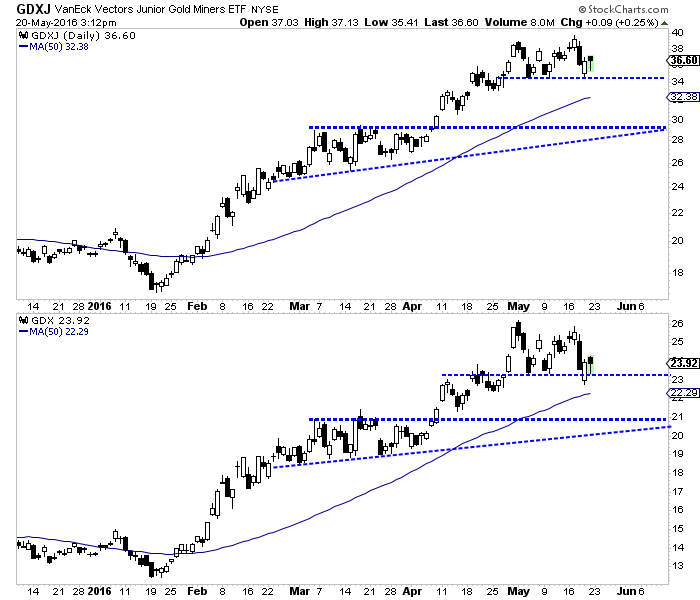
Although the analogs urge caution in the short-term, the miners will close the week on strength. The key supports are $34 for GDXJ and $23 for GDX. If the miners break support next week then look for support at $21 GDX and $30 GDXJ. Do note that GDXJ continues to show more strength than GDX.
The strong close to the week gives hope that the miners could make a final push higher although we think that is the less likely outcome. History, which is a powerful yet overlooked and ignored indicator suggests that the gold stocks should continue to correct in the days and weeks ahead. The good news for bulls, as we can see is history also suggests the gold stocks should trend higher in the months and quarters ahead. If miners become even more overbought and reach the 2014 highs then we would consider hedging. Otherwise we are content to buy and hold. Those on the sidelines are best advised to buy if the current correction reaches a 20% threshold.
Jordan Roy-Byrne, CMT
Go to The Daily Gold for premium content
related:
Billionaire George Soros Cuts US Stock Position – Buys Barrick Gold
I have written extensively about how the current silver bull market is similar to the 70s ($3.80 to $50.00). Despite these similarities, silver will (ultimately) perform much better than during the 70s.
The fractal analysis of the US Dollar Index (below) shows some more similarities and differences between the 70s era and now. I believe that these further supports the expectation that silver will perform much better than it did during the 70s.

On the chart, I have marked two fractals (1 to 3). Both fractals exist in similar conditions – relative to the relevant Dow/Gold ratio peaks (1966 and 1999). Both fractals span over the period of the first phase of the silver bull market during the 70s and the current era (2001 to 2016), respectively.
If the comparison is justified, then the US Dollar index will fall significantly during the coming months. Given the fact that silver has traditionally had its strong rallies during times when the US Dollar Index was falling, this bodes well for a silver rally. Note that this does not mean silver only rallies when the US Dollar Index goes down.
One of the differences between the two patterns is the fact that from point 2 to 3 (the period when silver made a correction from its peak), the US Dollar Index actually moved down on the 70s pattern, whereas it was moving up on the current pattern. This is probably why the correction for silver was much deeper since the April 2011 peak ($50 to about $14) as compared to the silver correction since the February 1974 peak ($6.7 to $3.8).
The silver bottom of the 70s pattern (point 3 – Jan 1976) came in while the US Dollar Index was still in an upward move. This would have been an obstacle to a quick rise of the silver price (indeed, silver was still stuck in a consolidation long after the silver bottom.
On the current pattern the silver bottom (point 3 – December 2015) came in at exactly the peak of the US Dollar index (December 2015). This means that the first part of the current silver rally has much less resistance from US Dollar strength as compared with the 70s rally. This is likely to continue provided that the December 2015 US Dollar Index top is actually the peak.
The silver bottom of the 70s pattern (point 3 – Jan 1976) came in before the Dow peak (September 1976). This means that the Dow was still rising, which is also an obstacle to a quick rise of the silver price. This would have contributed to silver being so slow to get out of the starting blocks after the January 1976 bottom.
On the current pattern the silver bottom (point 3 – December 2015) came in after the Dow peak (May 2015). This is ideal, given the fact that silver and the Dow move in opposite directions (I have written about this extensively). Again, this means that the current silver rally since December 2015 has much less resistance (from Dow strength) as compared with the 70s. This will continue, with silver rising even faster when the Dow goes into its next leg down (which could be brutal).
During the 70s, when the US Dollar index went from point 3 (January 1976) to January 1980 (some time after its bottom), silver actually went from about $3.80 to $50. If the current pattern on the US Dollar Index plays out as expected, and silver has a similar rally to that of the 70s, then silver could go to $184. Given that the expectation is for silver to outperform the 70s rally, it is likely to exceed the $184 level.
One difference that this chart does not necessarily show is the strong likelihood that the coming US Dollar collapse will not be like the previous ones, since this will bring the collapse of the monetary system (again, I have written about this extensively). This will guarantee a sudden and quick rise of silver (in any measurement), to the extent that the US Dollar price of silver will not matter.
Check out Hubert Moolman’s premium service.
related: Silver Demand Highest On Record
 Summary:
George Soros has reduced his U.S. listed stock holdings by a 1/3, added a $264 million stake in Barrick Gold and bought a large bullish option contract position in GLD.
Fellow billionaire Stanley Druckenmiller calls Gold his “largest currency allocation”.
related:
Good Times Roll For Junior Gold Stocks

-
I know Mike is a very solid investor and respect his opinions very much. So if he says pay attention to this or that - I will.
~ Dale G.
-
I've started managing my own investments so view Michael's site as a one-stop shop from which to get information and perspectives.
~ Dave E.
-
Michael offers easy reading, honest, common sense information that anyone can use in a practical manner.
~ der_al.
-
A sane voice in a scrambled investment world.
~ Ed R.
Inside Edge Pro Contributors

Greg Weldon

Josef Schachter

Tyler Bollhorn

Ryan Irvine

Paul Beattie

Martin Straith

Patrick Ceresna

Mark Leibovit

James Thorne

Victor Adair