
Gold & Precious Metals
Everyone wants to see my head on a silver platter. Or make it a gold platter. Why? Because they think I’ve completely missed the gold rally and if I don’t tell them to get on board now, they will forever have lost their chance to get in as gold ultimately works its way to over $5,000 an ounce.
Well, sorry everyone. Gold isn’t going to $5,000 an ounce tomorrow. So let’s get things straight about the gold market right now.
First things first. Gold has recently rallied up to its point of maximum resistance at the $1,306 level basis the June futures contract. While it did yield a minor buy signal last Friday, Monday’s almost perfect test of weekly and monthly overhead resistance at $1,306 so far continues to look like a major failure is being set up.

Moreover, it appears that gold and other precious metals are still poised to turn violently down.Here is my latest neural net chart of gold. As you can clearly see, the called-for April 29 high, which came exactly on cue, is indicating the model is still calling the shots.
So as of right now, all we have seen is a test of maximum weekly resistance at the $1,306 – $1,307 level.
Therefore, what we are facing is either:
A) A major collapse heading into late May, or …
B) A soon-to-be revealed “cycle inversion.”
If gold can start trading lower here and generate some intraday sell signals, then it will continue to follow the model into a late May low which could be even lower than I originally expected.
If, on the other hand, gold holds in this region and then closes above the $1,307 level, we will most likely see gold continue higher into late June or even mid-July reaching as high as the $1,450 level.
If you are a long-term bull on gold, you do not want to see that happen. The most bullish pattern for gold to form now is to pull back on time into a late May low and then begin its next rally.
If gold instead inverts and produces a June/July high between $1,400 and $1,450, then the second half of the year for gold will be absolutely devastating. Ditto for mining shares.
Let’s pause for a moment and think about what is really driving gold. It’s not inflation. There is none to be seen virtually anywhere on the globe. It is not outrageous demand from central banks as so many seem to be touting now as all my sources indicate that central bank purchases of gold are muted at this time.
In my opinion, what is driving this rally from a fundamental point of view is what I have been telling you all along, the main force that will be responsible for gold’s new long-term bull market.
That force is the rising tide of the cycles of war and geopolitical instability and discontent rising all over the world. Europe we know is a basket case — its economy is in the gutter. Its leadership is totally lacking.
In the Middle East, the region is in its worst shape ever, both economically speaking and ethnically speaking. Saudi Arabia is in financial straits. ISIS has rolled over the entire Middle East. Sunnis and Shiites are at each other’s throats. ISIS is expanding into Europe and Western Africa.
Further north, Russia is clearly claiming the Baltic region with its latest maneuvering of the MIG barrel rolls within 25 feet of U.S. aircraft.
And then there’s China clearly taking control of the South China Sea, standing squarely against not just Vietnam, Cambodia, Malaysia, Brunei, and the Philippines but also the United States of America.
Right here at home in the U.S., we have perhaps the most divisive nasty political primary process seen in the history of this country.
This is, as I warned a long time ago, the single major force that is going to drive gold’s new bull market, ultimately taking it to over $5,000 an ounce by 2020. I have no doubt about it.
But that does not mean that gold and other precious metals are going to go straight up. And if you think that way, I guarantee you that you will lose your shirt. Buying the wrong rallies, and selling into the lows.
You must remain focused and disciplined. That means sticking with the neural net models and the two alternative forecasts that are available at this time. The top alternative is that gold and the other precious metals remain on track for a sharp decline into the end of May.
The second alternative — lower probability — is a cycle inversion as noted previously that could take gold up into the mid-$1,400 level before a much more prolonged and probably steeper correction begins.
Stay tuned and best wishes,
Larry
Also from Larry: What’s Up With Gold and Mining Shares?
P.S. How Rich Will You Be? As the Dow doubles, some stocks will see explosive gains of 300%, 400%, 500% and more. Savvy investors who make the right moves will become very rich! Click here for my free report and to find out how it could make you rich beyond your dreams.

Larry Edelson, one of the world’s foremost experts on gold and precious metals, is the editor of Real Wealth Report and Supercycle Trader.
Larry has called the ups and downs in the gold market time and again. As a result, he is often called upon by the media for his investing views. Larry has been featured on Bloomberg, Reuters and CNBC as well as The New York Times and New York Sun.

Federal Reserve officials hinted at a rate hike as soon as next month, but that prospect did little to support the U.S. dollar or hinder precious metals. Gold and silver prices have surged to new highs for the year while the dollar made a new low.
Perhaps markets have already priced in another modest rate hike. Or maybe the markets simply aren’t taking the hint! Fed officials’ constant posturing and innuendo have long been contradictory and unreliable – and the Fed’s economic forecasts have usually been wrong.

One thing is for certain – the metals are getting lots of renewed speculative interest and support from some good looking technical charts. Silver gained more than 16% in April, outperforming gold’s rise of close to 5% – all of which came in the final week of the month.
And both metals closed above key overhead resistance on Friday and are looking strong so far this week. Open interest in silver futures made a new record in last week’s Commitment of Traders (CoT) report. Gold open interest isn’t far behind with more than 500,000 open contracts.
Some speculate the bullion banks, who are increasingly short, would like to orchestrate a price correction. Thus far, however, large sell orders have been sopped up by an overwhelming number of buyers. Anyone selling heavily short into this impressive rally certainly has to be nervous. It’ll be worth watching the CoT report this week to see if there is evidence of the shorts beginning to cover.
Gold/Silver Ratio Confirming Upturn in Metals Markets
Silver started a bit slow out of the gate in 2016, but it hit its stride in April. The white metal is now up 29% (or $4/oz) since January 1, eclipsing gold’s 22% gain.
Silver outpacing gold is good news for metals bulls, and not just for the obvious reasons. The move is an important signal that we can expect sustained higher prices for both metals.
The gold/silver ratio is calculated simply by dividing the gold price by the silver price to see how many ounces of silver it takes to buy one ounce of gold. This ratio has been a good indicator of market turning points. Why? Because silver historically leads the way, either up or down. Some investors questioned the recent rally in metals prices until silver confirmed the move higher by heading to the forefront.

After peaking at 83 in February, the gold/silver ratio has fallen sharply. The good news for metals investors is that the move may be just getting started. The ratio currently sits at just over 72, still in extreme territory.
Furthermore, the last time we saw the ratio as high as we saw it just two months ago was at the end of 2008. That marked the beginning of a spectacular run for the metals, especially silver. Silver went from under $10 an ounce all the way to $48 in less than 30 months, and the gold/silver ratio fell from the low 80s down to 32 by the spring of 2011.

So if history repeats, the ratio could be headed back below 40. In fact, a powerful bull move could drive the ratio well below 40. If markets revert to the long-term average set over the course of centuries, as many expect, we could easily see fewer than 20 ounces of silver needed to buy an ounce of gold.
related: “Precious Metals: Profit Booking Delight”
About the Author:
Clint Siegner is a Director at Money Metals Exchange, the national precious metals company named 2015 “Dealer of the Year” in the United States by an independent global ratings group. A graduate of Linfield College in Oregon, Siegner puts his experience in business management along with his passion for personal liberty, limited government, and honest money into the development of Money Metals’ brand and reach. This includes writing extensively on the bullion markets and their intersection with policy and world affairs.
- Gold and related assets continue to stun most analysts and investors as they surge relentlessly higher against American fiat currency.
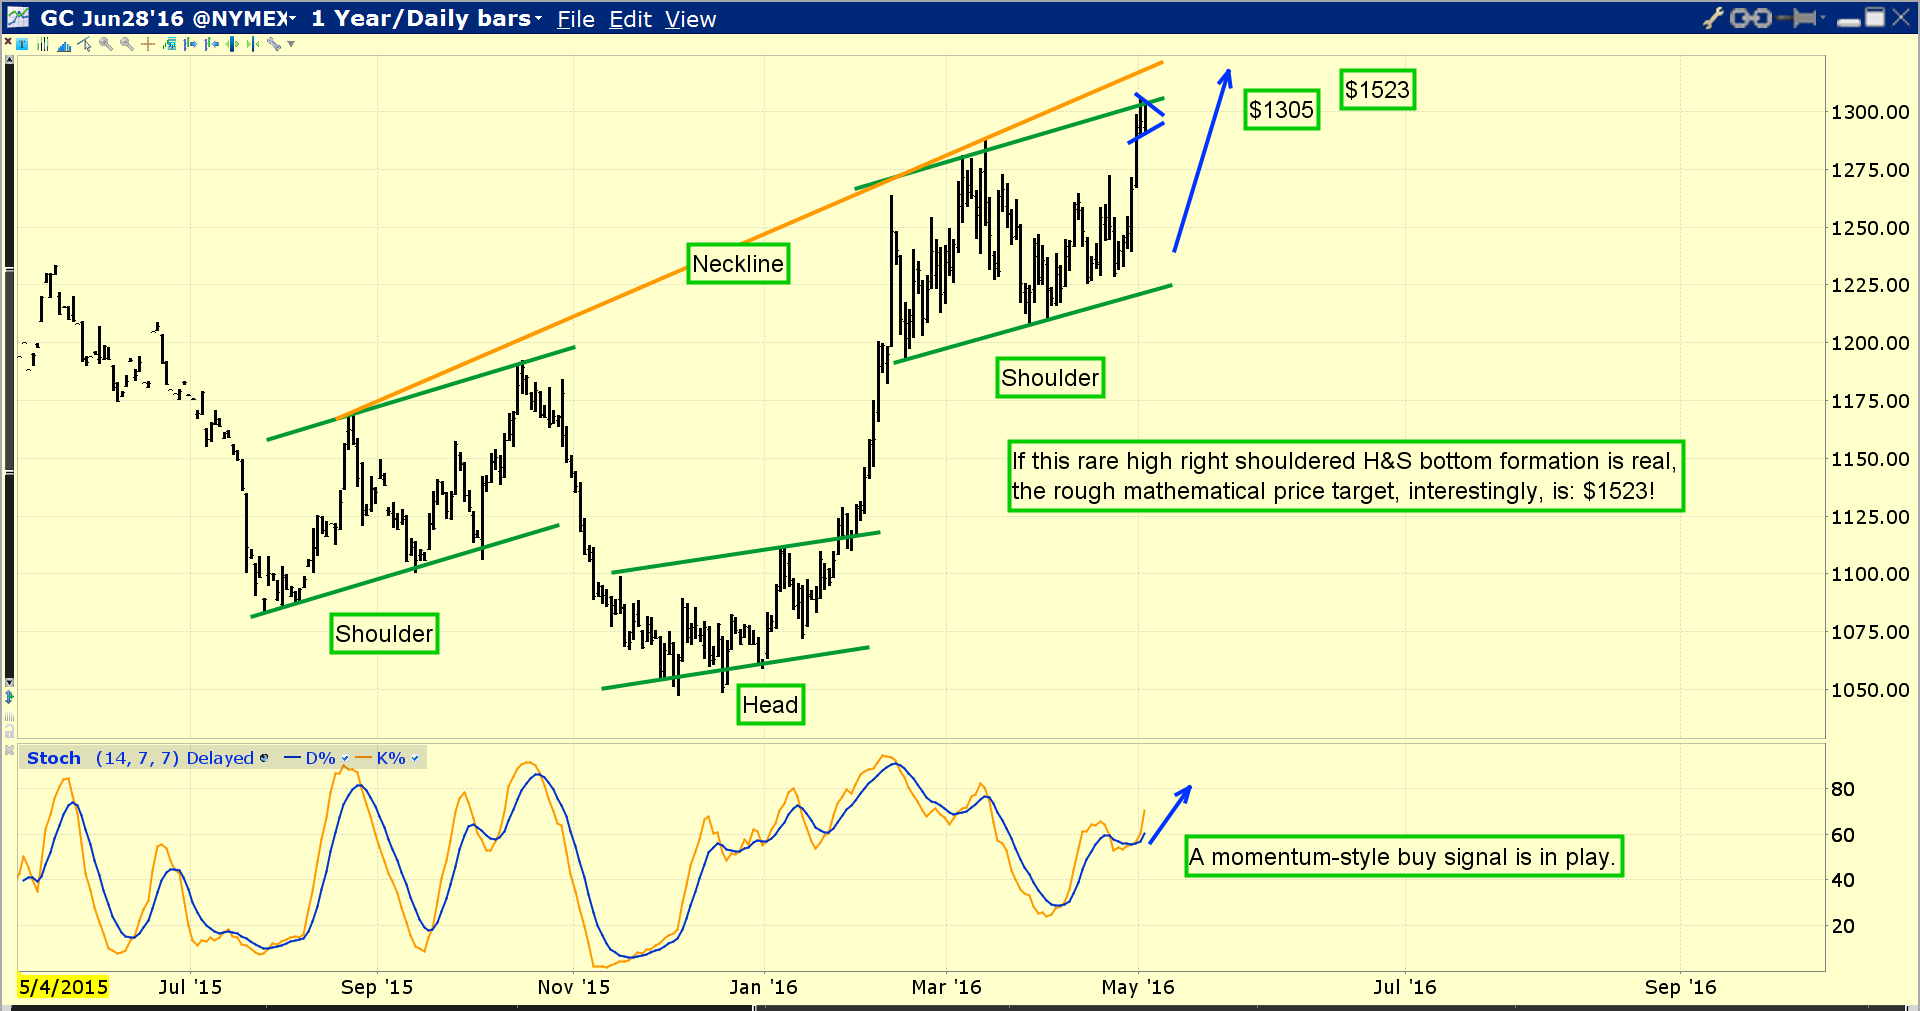 Double-click to enlarge this spectacular daily gold chart (to the right)
 - While gold has risen dramatically, the powerful inverse head and shoulders bottom pattern now in play suggests that the upside fun may soon accelerate.
- Please click here now. Double-click to enlarge this weekly bars dollar versus yen chart.
- In my professional opinion, the head and shoulders top pattern on this dollar-yen chart was created by bank and FOREX money manager concerns about a new upcycle for inflation. That is beginning to appear as the US business cycle peaks.
- If inflation becomes a problem, the Fed will have no choice but to hike rates, creating a surge out of global stock markets that will dwarf the flows that happened after the December rate hike.
- The huge liquidity flows into the world’s key risk-off assets of gold and the yen that I predicted would follow the Fed’s first rate hike has already stunned almost everyone, including top analysts at Goldman Sachs.
- On that note, please click here now. Goldman was clearly shocked by the latest BOJ (Bank of Japan) announcement. Their analysts are now openly asking the BOJ not to intervene in the FOREX market to buy the dollar.
- It appears Goldman is very concerned that if the BOJ prints yen and buys the dollar, the BOJ could be overwhelmed by market forces betting against them, and the yen would blast higher anyways. That would create a powerful new leg higher for gold, silver, and precious metal stocks!
- Gold has been rising against the dollar since the Fed’s rate hike in December. I think the upside action can continue, but it’s going to start becoming more “interesting”; substantial volatility is poised to become a major theme in the short term.
- The bottom line is that a one hundred dollar sell-off in gold is likely soon, but so is a near-immediate recovery to another intermediate trend high from there.
- For investors who didn’t understand the dollar-yen and dollar-gold symbiotic relationship, this rally has been shocking. Many gold community investors bravely bought at lower prices, but they sold it quickly, for very tiny profits.
- If they do buy again now, sharp sell-offs could quickly spook them out of their new positions. That’s a tough situation to be in, and there’s only one solution: Intestinal fortitude.
- Investors need to understand that to most value investors, the overall price of gold is now low. That’s also true for gold stocks, because the gold bullion rally has raised mining company profits. So, core positions across the sector can be accumulated here, provided the investor brings the required intestinal fortitude to the table to manage the increased volatility they will have to endure.
- I would not buy any trading positions now, even though gold may continue to surge hundreds of dollars higher before any major sell-off occurs. I’m running a light sell program in the $1300 – $1350 area for my trading positions, but it’s certainly not a “top call”.
- Please click here now. Double-click to enlarge this monthly bars gold chart. While short term charts can be used to fine-tune the big picture, I only use them to buy and sell when the price of gold is near monthly chart support or resistance.
- In the current situation, gold is approaching the $1307.80 high just as the dollar approaches the 105 support zone against the yen. It’s probably a “no brainer” play to book a bit of gold market profit now, without calling any top in the market. The $1392.60 and $1526.70 price areas are the next light profit booking zones of interest for me.
- Please click here now. Double-click to enlarge. I haven’t annotated this monthly bars silver chart because I really don’t need to do so. Silver can out-perform or under-perform gold, but its overall price action is generally a mirror image of the gold price action.
- Silver enthusiasts can book light profits on silver positions as gold trades near my support and resistance targets of $1307, $1391, and $1526.
- It’s normal for long term technical buy signals to occur just as an asset reaches an area where it may pause in the short term. This price action can confuse investors. As always, intestinal fortitude must be the main tool in every metal investor’s toolbox!
- Please click here now. Double-click to enlarge. This GDX daily chart shows the gold stock sector has also entered a profit booking zone, albeit at an area where large value-oriented fund managers are buyers.
- As the gold stock rally gained momentum, I suggested that investors could “chase price”. Core position accumulators can still do that, if they sold out earlier in an attempt to “top call” the rally.
- Short term traders can stand aside now, but be ready to board their gold stock rocket ships again, if GDX stages a three day close above $30.
- If GDX can do that, the dollar-yen support at 105 would probably be failing badly, and GDX would begin a mighty blast higher, towards my much higher $36 – $38 target zone. The bottom line for the Western gold community is this: Whether it’s day or night, the main theme is now… higher price delight!

Thanks!
Cheers
st
For another view go to: Gold Stocks: Extended but More Upside Potential (Money Talks Ed.)
May 3, 2016
Stewart Thomson
Graceland Updates
website: www.gracelandupdates.com
email for questions: stewart@gracelandupdates.com
email to request the free reports: freereports@gracelandupdates.com
Graceland Updates Subscription Service: Note we are privacy oriented. We accept cheques. And credit cards thru PayPal only on our website. For your protection we don’t see your credit card information. Only PayPal does.
| Subscribe via major credit cards at Graceland Updates – or make checks payable to: “Stewart Thomson” Mail to: Stewart Thomson / 1276 Lakeview Drive / Oakville, Ontario L6H 2M8 / Canada |
Stewart Thomson is a retired Merrill Lynch broker. Stewart writes the Graceland Updates daily between 4am-7am. They are sent out around 8am. The newsletter is attractively priced and the format is a unique numbered point form; giving clarity to each point and saving valuable reading time.
Risks, Disclaimers, Legal
Stewart Thomson is no longer an investment advisor. The information provided by Stewart and Graceland Updates is for general information purposes only. Before taking any action on any investment, it is imperative that you consult with multiple properly licensed, experienced and qualifed investment advisors and get numerous opinions before taking any action. Your minimum risk on any investment in the world is 100% loss of all your money. You may be taking or preparing to take leveraged positions in investments and not know it, exposing yourself to unlimited risks. This is highly concerning if you are an investor in any derivatives products. There is an approx $700 trillion OTC Derivatives Iceberg with a tiny portion written off officially. The bottom line:
Are You Prepared?

The bears have been in charge for the last 4 years or so taking both gold and silver into the depths of despair. The associated mining companies also felt the cold with many having to postpone projects, slash dividends and implement a series of cost cutting measures.
As with most bear markets there were a number of rallies which turned out to be head fakes or bear traps as gold lost its momentum. We can all recall just how well 2015 started as gold bolted in January to higher ground bringing much joy to the perma gold bulls. Alas gold couldn’t maintain it strength and spent the remainder of the year drifting to its lowest level for some time. Fast forward to this year and we can see once again gold has started like an Olympic sprinter taking the price of gold to within touching distance of $1300.00/oz. Silver was a tad slow to start but has now joined the fun by breaching previous resistance levels and confirming golds strength.
The restructured leaner mining companies really caught the bid and rocketed to higher ground with the Gold Bugs Index (HUI) having bottomed at exactly 100, more than doubling to close at 230. This is by far the best start that precious metals producers have had in a long time.
If you do not have a position then it is an agonizing time for you as you wrestle with the question of ‘should I – shouldn’t I’ purchase stocks right now. Well there two answers to that question. Firstly if you are intending to hold for five years or so then it probably won’t make a lot of difference if you buy now. However, if you intend to trade this market in order to take advantage of the oscillations on the way up and down, then you may be better off waiting for some of the froth to dissipate from this sector.
If we take a quick look at the chart of the HUI we can see that the downtrend has been well and truly broken and the rebound has been more dramatic than most expected.
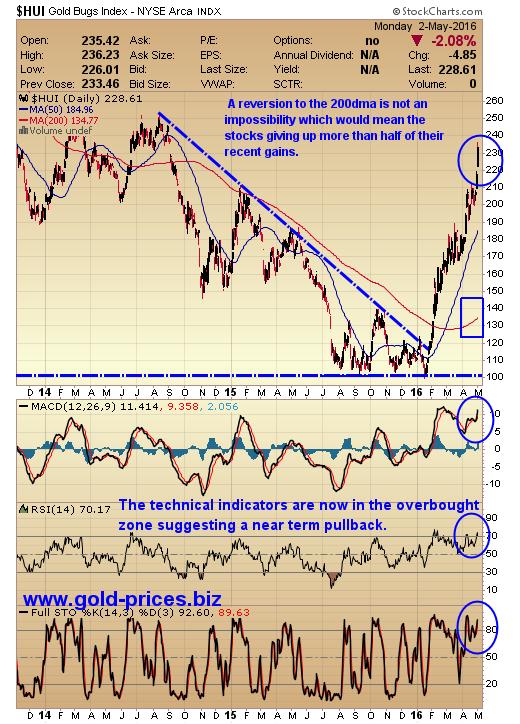
The technical indicators, the RSI, MACD and the STO are now in the overbought zone suggesting a near term pullback. Also look at the gap that has opened up between the HUI and its 200dma which stands at 134.77. A reversion to the 200dma is not an impossibility, which would mean the stocks giving up more than half of their recent gains. So it wouldn’t be unreasonable to expect a pullback of a lesser extent, to say around 50points, which would take the HUI back to the 180 level.
If such an opportunity were to present itself then it should be taken seriously and an acquisition programme should be implemented by layering into the good quality stocks in preparation of the next leg of this bull market, which isn’t that far away.
Go gently.
Related: Another view from Jordan Roy-Byrne – Money Talks Ed – Gold Stocks: Extended but More Upside Potential
Disclaimer: www.gold-prices.biz makes no guarantee or warranty on the accuracy or completeness of the data provided. Nothing contained herein is intended or shall be deemed to be investment advice, implied or otherwise. This letter represents our views and replicates trades that we are making but nothing more than that. Always consult your registered adviser to assist you with your investments. We accept no liability for any loss arising from the use of the data contained on this letter. Options contain a high level of risk that may result in the loss of part or all invested capital and therefore are suitable for experienced and professional investors and traders only. Past performance is neither a guide nor guarantee of future success.
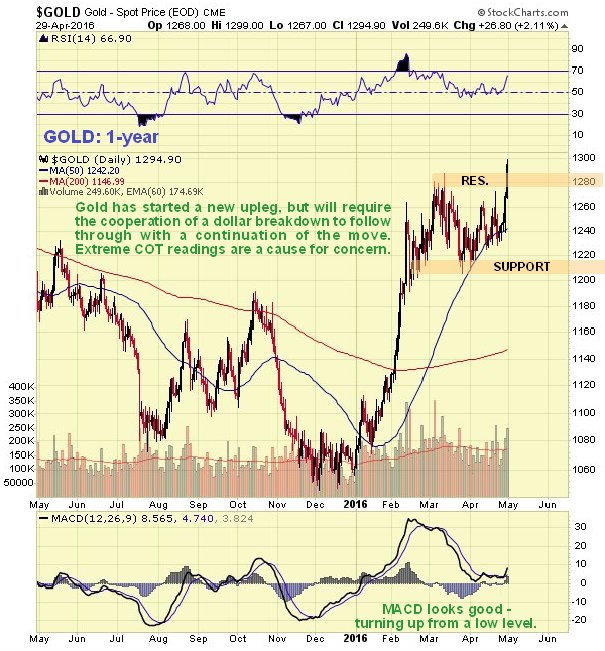
The situation is paradoxical – gold and silver have broken out upside despite already extreme COT readings, yet the dollar has still not broken down. This setup continues to warrant caution, yet if the dollar should break down from its potential top area and drop hard, gold and silver will go into a vertical meltup – and here we should not forget the tight physical supply situation. In the last update we expected gold and silver to drop due to the COTs extremes, but they have done the opposite resulting in even greater extremes, which in silver’s case are “off the scale”.
On gold’s 1-year chart we can see that after a two-month trading range, gold has at last broken out upside from it, and appears to be starting another upleg, although the large gap between the moving averages and the COT extremes give cause for concern. Momentum (MACD) has taken a sharp upward break from a low level and looks positive.
….read more analysis and view large charts HERE
related:

-
I know Mike is a very solid investor and respect his opinions very much. So if he says pay attention to this or that - I will.
~ Dale G.
-
I've started managing my own investments so view Michael's site as a one-stop shop from which to get information and perspectives.
~ Dave E.
-
Michael offers easy reading, honest, common sense information that anyone can use in a practical manner.
~ der_al.
-
A sane voice in a scrambled investment world.
~ Ed R.
Inside Edge Pro Contributors

Greg Weldon

Josef Schachter

Tyler Bollhorn

Ryan Irvine

Paul Beattie

Martin Straith

Patrick Ceresna

Mark Leibovit

James Thorne

Victor Adair