
Gold & Precious Metals


Last week we concluded:
As long as the gold stocks continue to hold support for another week or two then the near term outlook is bullish. A bull flag is a consolidation pattern that separates two strong moves. It could be developing in the miners. There is logical reason to be cautious if not bearish at this point. The metals look okay at best while the miners remain somewhat overbought. However, the action in the miners, if it continues for another few weeks is telling us what could be ahead.
The strength in the miners continues to surprise as the majority of pundits look for any reason for a pullback in the face of very bullish price action. The gold miners are now breaking out and Gold is likely to follow.
The weekly candle charts of GDXJ and GDX are shown below along with their 80-week moving averages. Note that the miners advanced for six weeks and their bullish consolidation began during that sixth week in late February. This week marks the fifth week since the previous advance. The miners are a little overbought here but not as much as they were five weeks ago. Moreover, we should note that overbought can become very overbought and extremely overbought. The immediate upside targets are GDXJ $33 and GDX $22.50 and it is possible this move has even greater upside.

Turning to Gold, we see that it has stabilized in the mid $1200s within a larger range of $1210 to $1270/oz. With the miners breaking to the upside, Gold is very likely to follow to the upside. The current net speculative position of 43% is relatively high but we should note that from 2001 to 2012 it often peaked at 50% to 60%. Gold is weaker than the miners and may require a bit more consolidation. Nevertheless, weekly closes above $1262/oz and $1300/oz could send Gold on its way to $1400/oz.

A move in Gold to $1400/oz would fall in line with history. In the chart below we compare the current rebound in Gold to its rebounds following major lows in 1976 and 2008. If Gold rallies to $1400/oz in the next few months then its recovery would be in line with those previous two recoveries.

After consolidating in bullish fashion for a good five weeks the miners appear to be starting their next leg higher and this should eventually propel Gold higher. The toughest time to buy is after a market has already had a strong rebound, following a nasty bear market. Investors and pundits alike subconsciously refuse to believe a major change has taken place. Gold stocks endured the worst bear market in 90 years. Of course there will be fear that it could reassert itself at any time. However, the action of the market is clear. Gold stocks are breaking out and could be headed much higher in the near term.
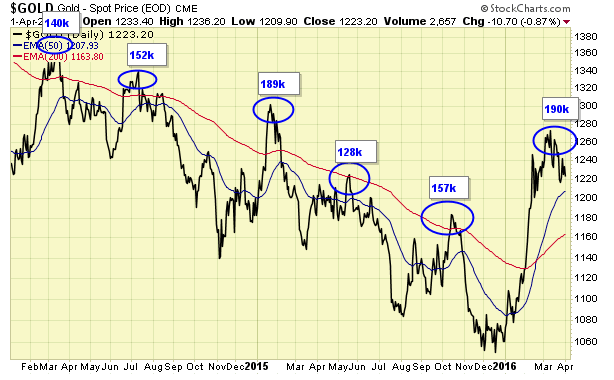
Something big happened in the gold market. It was a stunning trend change in mainstream gold demand during the first quarter of the year. This suggests investors are becoming increasingly worried about the stock markets and are looking for safety elsewhere.
Over the past several years, the gold market has suffered net outflows of metal from Gold ETF’s & Funds. However, this changed in a big way in Q1 2016:
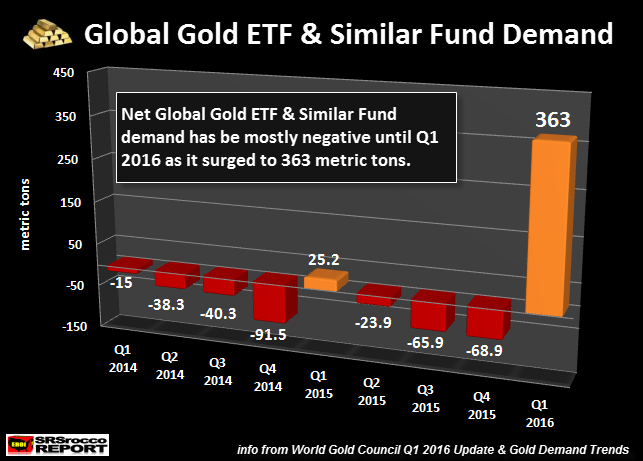
According to the World Gold Council’s Gold Demand Trends, the market suffered net outflows from Gold ETF’s & Similar Funds except for the small 25 metric ton (mt) build during Q1 2015. Then in the first quarter of 2016, it surged to 363 mt. Actually, it was the second highest quarterly build of Gold ETF’s & Funds in history.
The largest build of metal inventories at the Global Gold ETF’s and Funds took place in Q1 2009 when the stock markets were crashing down to their lows. That quarter, Global Gold ETF’s & Fund inventories surged 465 mt– the highest ever.
Well, there was a good reason for mainstream investors to pile into gold during this time. This was when CNBC’s Jim Cramer was telling his viewers that there was no bottom in sight as the Dow touched 6,700. Financial network talking heads just didn’t know what to say anymore as they watched what looked like a total collapse of the markets.
However, this present surge of the mainstream investor into the gold market is quite interesting as it took place when the Dow Jones was only down 15% from its highs. I discuss this in detail in my new report, THE GOLD REPORT: Investment Flows.
If you haven’t yet read the report, I highly recommend it. It shows how the ongoing trends in the gold markets point to a huge move in the future.
In the report, I discuss the huge change of investment demand between two peak time periods. Here is one of the charts from the report that shows just how much net investment demand has changed:
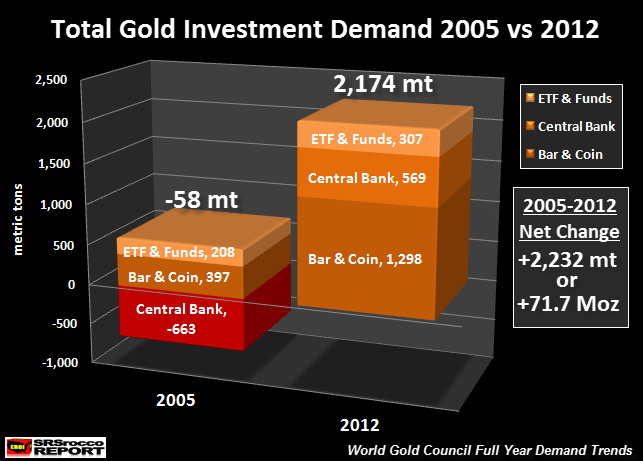
When Western Central Banks dumped 663 mt of gold onto the market in 2005, the net effect on total gold investment demand that year was a negative 58 mt. Compare that to the 2,174 mt of total gold investment demand in 2012. This was a stunning 2,232 mt (71.7 Moz) swing of total gold investment demand in 2012– versus 2005– which helped to push the price of gold up to an annual record of $1,669. Simply put: on average, various market factors have sent the price of gold on the rise.
Looks Like The Gold Bear Market May Be Finally Over
The World Gold Council put out a quick Q1 2016 gold update in which, they included the following table:

(table from World Gold Council Q1 2016 Update)
As we can see in the chart, the average bear market experienced a -44% correction. The most recent gold bear market (9/11 – 12/15) suffered a -44.1% correction. Currently, gold is up 17% in the first quarter of the year. This huge rally and surge of mainstream investors into Gold ETF’s & Funds took place as the Dow Jones fell 2,000 points.
Even though the Dow Jones Index has recovered (and could still gravitate a bit higher) since its low in February, the continued crash of the broader stock markets will eventually take place. If mainstream investors flocked into Gold ETF’s & Funds when the market only suffered a 11% correction (Jan-Feb), what happens when the markets really tank??
For those investors who don’t believe the Gold ETF’s & Funds don’t have all the gold they say, or the data put out by the World Gold Council, it doesn’t really matter. I use the data by the World Gold Council to show changes in trends. I believe some data by the World Gold Council is under reported… such as Chinese Gold Demand.
Furthermore, it is impossible to know if the Gold ETF’s such as the SPDR GLD Shares ETF have all the gold they report to have in their inventories. Some precious metals analysts and investors believe these GLD ETF’s were designed to siphon mainstream investor funds away from physical gold and into paper gold shares. The theory is that investors who buy paper shares of gold keeps them from buying in the physical market. Thus, removing more stress and possible tightness on the physical gold market
Regardless, the important thing to understand here is that the huge inflow of the mainstream investor into the gold market is the segment that would cause the price to explode higher. Why? Only a small percentage of the mainstream investor is in gold. Most of the physical Gold Bar & Coin demand is taking place by diehard believers in owning the monetary metal.
Investors need to realize the propping up of the broader Bond and Stock markets by the Fed and Central Banks won’t last forever. If the huge surge of the mainstream investor into Gold ETF’s & Funds is a sign of things to come… get ready for things to get really interesting for the remainder of the year and into 2017.
Listen to Michael Campbell’s Daily Comment for April 8th HERE
Please check back for new articles and updates at the SRSrocco Report.
Technical analyst Jack Chan has examined the charts and says the gold sector is on a new major buy signal, which could signal a new bull market, but he is patiently waiting for confirmation.
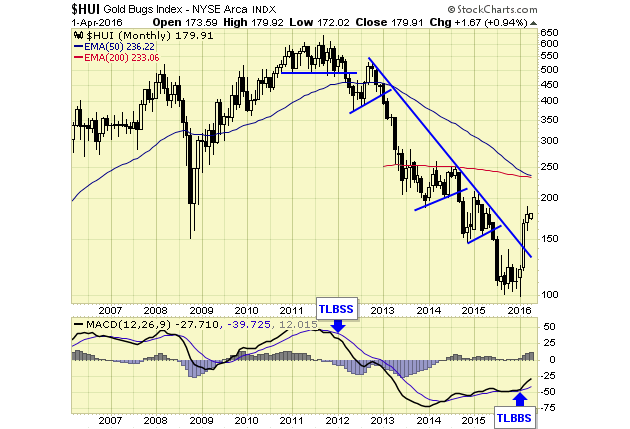
The gold sector is on a new major buy signal, therefore opening the opportunity of a new bull market. However, Commitment of Traders (COT) data remains in bear market values and is now at levels of previous tops. I remain patient and wait for confirmation, which is when speculation according to published COT data has returned to bull market values, and the 2015 high in gold prices near $1,300/oz is exceeded to the upside.
$HUI is on a new long-term buy signal, ending the sell signal from early 2012. (See chart above).
Long-term signals can last for months and years and are more suitable for the long-term investors.
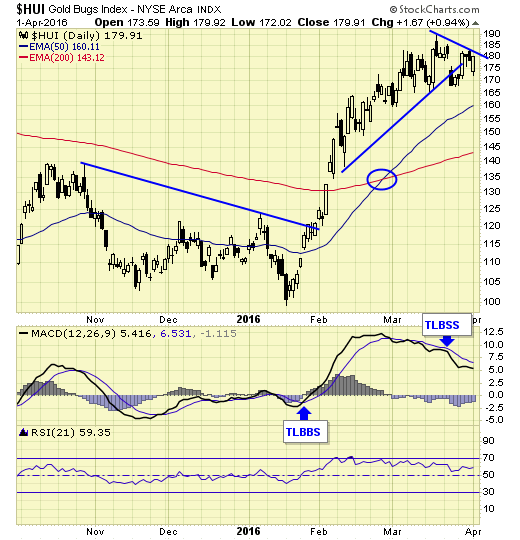
$HUI is on a short-term sell signal. Short-term signals can last for days and weeks and are more suitable for traders.
COT data remains in bear market values, and also below the 2015 high at 1300. Both factors are needed to confirm a new bull market.
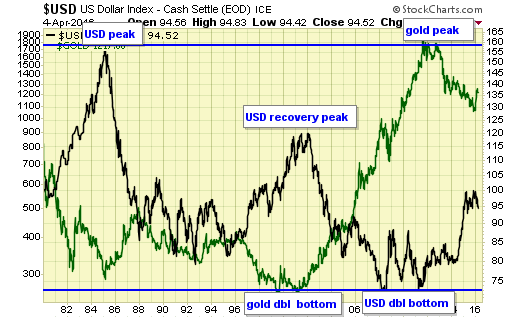
From the long-term perspective, gold and the dollar have always been in an inverse relationship, and that remains today. This chart aided us to consider gold in 2001, and to begin diversifying into USD in 2011.
related:
Jack Chan is the editor of Simply Profits at www.simplyprofits.org, established in 2006. Chan bought his first mining stock, Hoko Exploration, in 1979, and has been active in the markets for the past 37 years. Technical analysis has helped him filter out the noise and focus on the when, and leave the why to the fundamental analysts. His proprietary trading models have enabled him to identify the NASDAQ top in 2000, the new gold bull market in 2001, the stock market top in 2007, and the U.S. dollar bottom in 2011.
Disclosure:
This article does not constitute investment advice. Each reader is encouraged to consult with his or her individual financial professional and any action a reader takes as a result of information presented here is his or her own responsibility. By opening this page, each reader accepts and agrees to Streetwise Reports’ terms of use and full legal disclaimer. This article is not a solicitation for investment.
From time to time, Streetwise Reports LLC and its directors, officers, employees or members of their families, as well as persons interviewed for articles and interviews on the site, may have a long or short position in securities mentioned. Directors, officers, employees or members of their families are prohibited from making purchases and/or sales of those securities in the open market or otherwise during the up-to-four-week interval from the time of the interview until after it publishes.
All charts courtesy of Jack Chan.

-
I know Mike is a very solid investor and respect his opinions very much. So if he says pay attention to this or that - I will.
~ Dale G.
-
I've started managing my own investments so view Michael's site as a one-stop shop from which to get information and perspectives.
~ Dave E.
-
Michael offers easy reading, honest, common sense information that anyone can use in a practical manner.
~ der_al.
-
A sane voice in a scrambled investment world.
~ Ed R.
Inside Edge Pro Contributors

Greg Weldon

Josef Schachter

Tyler Bollhorn

Ryan Irvine

Paul Beattie

Martin Straith

Patrick Ceresna

Mark Leibovit

James Thorne

Victor Adair