
Gold & Precious Metals

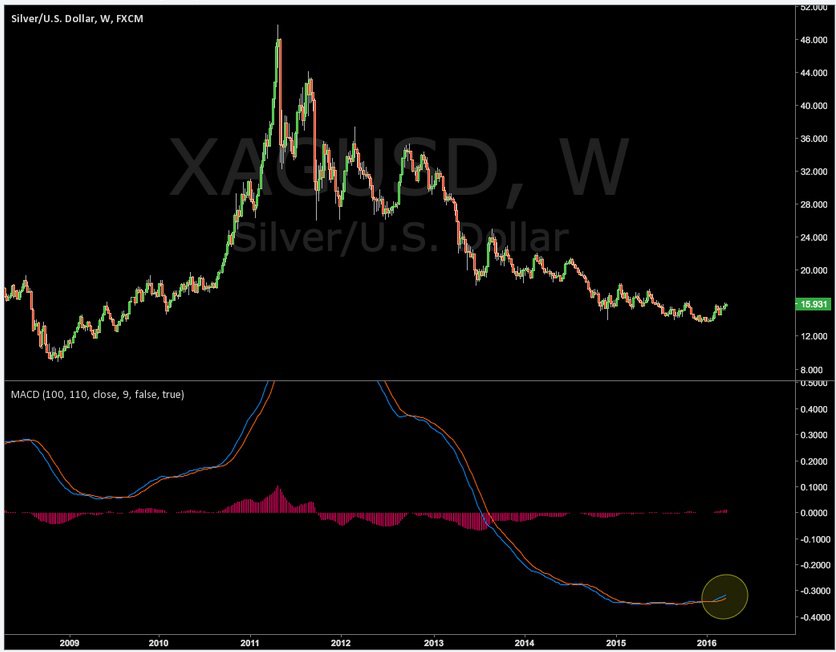
The following long-term silver chart and commentary – “The silver chart looks incredibly bullish. The buy signal on the MACD has confirmed the upward move and just look at the setup.” It will be interesting to see how silver trades in the coming weeks with such a large commercial short position in place. This is a fascinating battle taking place in both the gold and silver markets in the short-term....continue reading HERE

 America was built by “citizen champions”. Should the current gold price action be described in a similar way, as a “rally of champions”? I think so.
- Technically, gold is arguably overbought. It may be due for a correction according to cycle analysis, and yet the world’s mightiest metal just keeps moving relentlessly higher.
- Please click here now. That’s a snapshot of the SPDR fund tonnage. Solid buying has boosted the holdings to more than 820 tons.
- Also, a potential “rally accelerant” has suddenly manifested itself, in the form of an end to the Indian jeweller strike. Please click here now. Double-click to enlarge this key four hour bars gold chart.
- It could be persuasively argued that gold has essentially traded sideways because of the strike.
- Now that the strike is over, demand appears to be rising in the world’s most important gold market, and gold is rising up nicely, from a small inverse head and shoulders bottom pattern.
- My $1320 area target remains within reach on this rally. In the big picture, I think that as bullish as Janet Yelllen’s first rate hike was for gold, her next one could turn the gold price rally into a serious “barnburner”!
- Please click here now. Double-click to enlarge. This eight hour bars chart of the dollar versus the yen has ominous implications for the dollar.
- A bear flag is in play. In the big picture, it’s almost impossible for gold to experience a major setback, when the dollar is tumbling against the yen. Please click here now. Double-click to enlarge. That’s a longer term chart of the dollar versus the yen, using daily bars.
- An enormous top pattern is now in play, and dollar rallies are quite frankly best described as “pathetic”.
- A breakdown from the current 111 – 115 range could unleash a new wave of dollar selling, yen buying, and gold/silver buying. That could easily push gold towards my $1320 target, and leave the dollar wallowing in the 105 -107 zone on the dollar-yen chart.
- If a much bigger leg of the gold price lies ahead, silver will begin to dramatically outperform gold. Is there any evidence that such an event is on the horizon? Yes, there is!
- Please click here now. Double-click to enlarge. That’s a daily bars chart for silver, and to say it looks inviting is arguably the understatement of the year.
- There’s a beautiful inverse head and shoulders bottom pattern in play, with a technical target of $17.50 – $18.
- Silver price enthusiasts should note that India is a massive silver buyer, so the end of the jeweller strike there could have an enormous impact on silver demand.
- Silver is not just the poor man’s gold. In my professional opinion, it’s the world’s second mightiest asset, and it should be part of all investment portfolios.
- If an investor owns no silver at all, they can pay any price for a small amount of it. After that, they can use my unique “pyramid generator” for systematic capital allocation.
- For another view of the silver price action, please click here now. Double-click to enlarge. This weekly bars silver chart is extremely interesting. Here’s why:
- There’s a major trend line breakout in play, and the inverse H&S bottom pattern on the daily chart appears to be acting as a kind of “Launchpad” for the weekly chart breakout.
- Note the beautiful position of both the RSI indicator at the top of the chart, and the 14,3,3 Stochastics series at the bottom of the chart.
- Major breakouts tend to have this kind of “textbook” technical set-up, with RSI on the weekly chart well below the overbought zone, and the Stochastics oscillator staging a “flatline” event in an overbought condition. Once the $18 target has been acquired, I think silver will pause, and then move towards $25.
- Silver price fans should also look at the SIL-NYSE silver stocks ETF, which is poised to lead bullion to more upside gains.
- Please click here now. Double-click to enlarge. GDX continues to make superb upside progress towards my $23 target, on this weekly bars chart. Investors who may have become demoralized and sold their gold stocks at losses should not wait for any type of correction to get back into this powerful market. Here’s why:
- Rather than selling off from the $23 area, GDX could instead form a high right shoulder, far above the $23 area. This is exactly what the silver bullion chart action is implying is going to happen! It’s clearly a glorious time for the Western gold community, and I’m becoming quite convinced that’s it’s about to become… even more glorious!
Mar 22, 2016
Stewart Thomson
Graceland Updates
website: www.gracelandupdates.com
email for questions: stewart@gracelandupdates.com
email to request the free reports: freereports@gracelandupdates.com
Tuesday 22nd Mar, 2016
Special Offer for 321Gold readers: Send an email to freereports@gracelandupdates.comand I’ll send you my free “Oil My Golden Wheels!” report. Oil may be poised to add serious upside pressure to the commodity sector rally. I highlight 3 key oil stocks and 3 gold stocks that look poised for great gains, with buy and sell tactics for each of them!
We all know silver is volatile. When gold rallies, silver usually rallies faster and farther, particularly after the rally has been well established.
Volatility is not a reason to avoid silver. Instead, now is a time to continue stacking. Yes, silver almost certainly will correct many times, but examine the big picture.
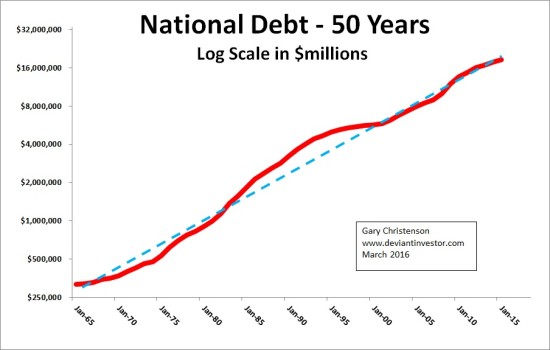
Over the past 50 years prices for stocks, silver, gold, crude oil, health care, and presidential elections have increased exponentially, mainly due to massive increases in debt (see graph below) and devaluations of currencies. Expect exponential price increases to continue.
Over 50 years the Dow Jones Industrial Average has averaged about 700 times larger than the price of silver. Examine the log-scale graph (below) of 700 times the price of silver plus the DJIA.

- Prices have moved higher exponentially.
- You can see the silver bubble in 1980.
- You can see the small deviation from trend in 2011 caused by the silver rally to nearly $50. It was not a bubble.
- Another silver bubble will probably occur, but we have not seen a bubble in silver since 1980.
What about the DJIA? Examine the 28 year chart of the DJIA – log scale.

- The DJIA has moved exponentially higher for three decades.
- The red ovals indicate “danger zones” where the DJIA rallied too far and too fast, corrected below its exponential trend-line, and then fell by 40% or more.
- The DJIA peaked in May 2015 and has only fallen slightly since then. Expect a larger correction.
Examine the silver (times 700) to DJIA ratio over the past 30 years. This excludes the 1980 bubble in which the ratio peaked many times higher than the 2011 ratio.

- The 30 year ratio shows long term trends of investor preference for paper assets, such as the DJIA, versus hard assets such as silver.
- Silver prices and the ratio hit a multi-decade low in November 2001, as indicated by a green oval.
- The ratio is only slightly higher in 2016, as indicated by the other green oval.
- There is considerable room for the ratio to increase, which would probably involve a somewhat lower DJIA and a much higher price of silver.
CONCLUSIONS:
- The DJIA reached a high in May 2015. The next major move is likely much lower, similar to the 2001 and 2008 corrections.
- The price of silver, as indicated by the ratio to the DJIA, is near a multi-decade low. Expect the price of silver to rally substantially in 2016 – 2020. $50 silver is coming, probably fairly soon. $100 silver will take longer.
- Silver prices and the DJIA rise exponentially, thanks largely to dollar devaluations and massive increases in debt.
There are many financial and political reasons to expect a preference for hard assets over paper assets in the next several years. A few are:
- Negative interest rates indicate central bank desperation and financial craziness and should encourage sane investing in hard assets.
- Increased investor demand for silver. Read Steve St. Angelo.
- Silver prices tend to bottom, more or less, about the time the DJIA peaks. The DJIA hit an all-time high in May of 2015. Silver hit a multi-year low in December 2015. The next big moves should be up in silver and down in the DJIA.
- Global debt is estimated at $230 Trillion. When it finally dawns on people that this debt will not be repaid in current dollars, euros, yen, pounds etc. then people and institutions will want to protect their purchasing power and preserve the value of their money. Negative interest rate bonds are not the answer. Silver coins and bars are a far better answer.
- War! Desperate times call for desperate measures to inflate economies, inflate more bubbles and create distractions. It could happen.
Silver thrives, paper dies. This should be true for several more years.
Gary Christenson
The Deviant Investor

-
I know Mike is a very solid investor and respect his opinions very much. So if he says pay attention to this or that - I will.
~ Dale G.
-
I've started managing my own investments so view Michael's site as a one-stop shop from which to get information and perspectives.
~ Dave E.
-
Michael offers easy reading, honest, common sense information that anyone can use in a practical manner.
~ der_al.
-
A sane voice in a scrambled investment world.
~ Ed R.
Inside Edge Pro Contributors

Greg Weldon

Josef Schachter

Tyler Bollhorn

Ryan Irvine

Paul Beattie

Martin Straith

Patrick Ceresna

Mark Leibovit

James Thorne

Victor Adair