
Gold & Precious Metals
I hope you’ve been watching gold and silver. They’ve been moving nicely higher, after having made a low right on target in December with my cycle forecast for a potential major low.
Just in case you missed it, I have an updated cycle forecast gold chart. As I pen this column, gold is actually trading higher at near the $1,183 level. Silver a hair over $15.00.
 That said, I thought I’d take this opportunity to answer your most pressing questions on precious metals (as well as other markets).
After all, the precious metals are the markets where there is the most amount of misinformation.
And the markets that most pundits seem to completely misunderstand. So let’s get right to those questions.
Q: Larry, you’ve been right as rain about deflation. So why are gold and silver now rallying when deflation still seems to be dominant?
A: There are numerous reasons. But the most important is the following:
Precious metals can do extremely well in deflation.
In fact, historically, gold gains the most purchasing power during periods of deflation, not inflation. The reason for that is also simple: During extreme deflation, the debt and credit structure of the world’s monetary system — especially sovereign debt — come under increasing stress.
As such, savvy, big money starts to seek out hedges against collapsing sovereign debt. Hence, new bull markets in precious metals can be born, even during deflation.
That is exactly what happened during the Great Depression. And it is exactly what is happening now.
Q: Have gold and silver truly bottomed, or is this a fake-out rally?
A: I believe they have bottomed. But that’s based on experience and not my unemotional models.
Based on my models, the first confirmation of a bottom in gold will come on a close above $1,187.80 on a Friday. Final confirmation will come with a close above $1,368.20 on a month-end basis. Silver will generally follow gold.
Failing those two signals and gold and silver can indeed slide back down, possibly even to new lows.
Q: The stock market can’t seem to breakout to the upside. But it can’t seem to pullback much either. What gives?
A: Three things:
First, I believe the market’s resilience is a testament to its long-term strength. As I have said all along, the Dow is headed to 31,000+.
Second, looking simply at the Dow Industrials, or even the S&P 500, is deceiving. The majority of publicly traded U.S. stocks are down for the year, more than 20%. The Dow Jones Transports, the Dow Utilities, the Russell 2000 — are all down and weaker than the main indices.
So in a very real sense, U.S. equities are already in a stealth pullback. Odds are that the Dow Industrials and S&P 500 will soon succumb too. Indeed, the wild swings you have seen since the start of the new year are merely the preparatory stages for a steep decline.
Worst case in the Dow Industrials should be roughly 13,900.
Nevertheless, keep in mind that any pullback you see will merely serve to get the majority of investors bloodied and bearish. The long-term trend is higher.
Q: I can’t believe how accurate you have been when in late 2012 you forecast a rise in global stress and geopolitics. How much worse can it get?
A: Unfortunately, a lot worse. We are still early in the cycle, which calls for rising social and international stress and discontent all the way in to late 2020.
Europe is the hotbed, and will be the entire time. The refugee crisis has allowed terrorists to infiltrate Europe, and Europe is also buckling under the financial stress of providing for as many as 2 million refugees.
But don’t kid yourself. You will soon see all of this migrate to Japan, then to the United States as well. Not to mention rising troubles in the Middle East.
Not just terrorism, but civil discontent too. Protests against government. Secession movements. And more. It will get very ugly.
Q: Do you believe gold and silver will eventually be confiscated?
A: No, I do not. Why would governments move to confiscate gold and silver when what they want to do is make them obsolete? Confiscating gold or silver would send the opposite message; that they are too important to be in the hands of investors.
This is also why I believe investors, when buying gold or silver, should opt for ingots and bars. Why pay premiums of 4 to 7% on bullion coins when you don’t have to?
Governments of the world are not interested in gold or silver. They are more interested in, and will expend more effort on, moving toward electronic money and eliminating cash, so they can track and tax you more.
Q: Will inflation ever come back?
A: Yes. But not until the current monetary system crashes and burns, via deflation and sovereign debt defaults.
Q: Bitcoin crashed, just as you predicted. But now it’s rallying again. What are your thoughts on Bitcoin?
A: I still wouldn’t touch it. It’s too thin a market, and subject to government interference.
That said, there may come a time when it does indeed go mainstream. The monetary system is breaking down even more quickly that I had expected. And there may be a future role for Bitcoin in investors’ portfolios. But right now, no.
Q: Oil is rallying just as you forecast. Is the bottom in?
A: Quite possibly. We need to see a close above $40.78 on a daily basis to confirm a bottom, or $29.25 on a weekly basis. The $25 low looks good, but more upside work is needed in oil to confirm a real bottom.
Best wishes,
Larry
P.S. I want you to have Winds of World War III FREE! It is a step-by-step guide for understanding the coming crisis — and taking the necessary actions to protect and grow your wealth, even as new wars explode across the globe.

You may have noticed that I have written relatively little publicly about the gold sector over the last few years (we have covered it consistently in NFTRH to keep subscribers aware of the bear’s status, and protected against it). Is that strange for a writer who was probably known first and foremost as a ‘gold guy’? Not at all! It’s just that it is not desirable to get bogged down obsessing on a sector in a bear market when there are other fish to fry on the global macro landscape. But the process of finding and confirming a bottom in the gold sector is now front and center as more of the fundamentals that actually matter come into place. To those fundamentals, we need to marry the technicals.
We have consistently worked a theme that sees a comparison to the 1999-2001 bottoming phase in the gold sector. That was a time when stock markets topped out, an economic counter cycle took hold and gold began out performing most other items. Within this, we have also been considering the possibility of a final washout within the sector, whereby prices decline despite continually improving fundamentals. This condition was in play in Q4 2008, which was the last great buying opportunity.
If the sector moves high enough in the near-term it will negate the final washout prospect by changing the intermediate trend to up. So where are we at? Let’s look at a simple daily chart, as used in NFTRH 380. We followed HUI as it broke resistance, hit the 200 day moving average and now, hits the final parameter at 140. As the chart states, this is the key to changing the intermediate trend to up; and I don’t mean by simply closing a day at or above 140. A weekly close and then some successful back testing are needed.
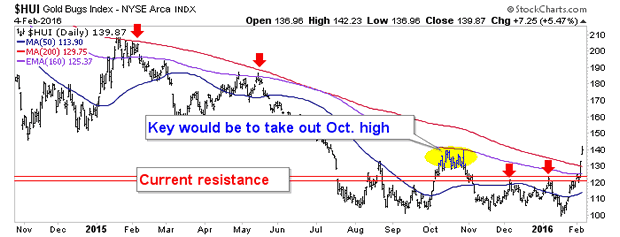
So this is HUI’s technical rubber that needs to meet the fundamental road in order to distinguish this bounce, as impressive as it has been, from those that came previously. Since both sector and macro fundamentals continue to improve, I for one am now interested in the sector to a degree well beyond any of the myriad bounces that have taken place to date in this bear market. As one ill-fated example of those, recall the disaster that the hype fueled summer 2014 bounce ended up being. Ukraine or Bird Flu, anyone? Those were promoted as fundamentals but in reality, they were phony baloney.
Above we see the daily situation. What about the weekly time frame? Well, we have been using these two charts in order to display why the bears were wishfully thinking in using a log scale chart to see what they wanted to see (a breakdown from a trend channel). For months, the gold bear cottage industry obsessed on (and shorted per) a breakdown that did not exist…
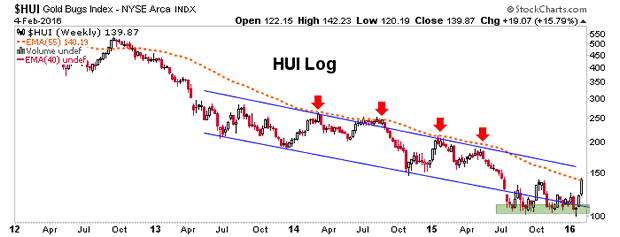
…as the linear chart made clear. It was best to leave the sector alone during that sideways phase, not try to trade it.

What both of these charts show however, is a potential limit point at the weekly EMA 55. That is interesting because it also happens to be at 140, which is the key parameter on the daily chart above. If the bounce really takes off the upper channel line awaits. These conditions would change the intermediate trend to up, but a new cyclical bull market would only be indicated by a rise above 261 (2014 highs).
It is ‘rubber meets the road’ time in the gold stock sector. The fundamentals are doing their part and now the technicals are more constructive, but have a lot of work to do as well. So far, so good. But be aware of the potential reaction points as illustrated above.
Market management has become infinitely more enjoyable for me in the last 6 months due to the firm signals that broad stock markets have made. It will become more so if the gold sector continues to improve fundamentally and technically. We will of course be defining events from short-term daily perspectives like that above to a long-term monthly analog of 1999-2001, which is playing out nicely.
Consider an affordable subscription to NFTRH for grounded, hype-free, profitable (and risk-managed when appropriate) tracking of these events.
Subscribe to NFTRH Premium for your 25-35 page weekly report, interim updates and NFTRH+ chart and trade ideas or the free eLetter for an introduction to our work. Or simply keep up to date with plenty of public content at NFTRH.com and Biiwii.com. Also, you can follow via Twitter @BiiwiiNFTRH.

The comatose mining stocks finally came to life today and showed signs of some determined buying, something that has been missing in the recent leg higher in the gold market.
From a technical analysis perspective, the fact that they were able not only to breach that stubborn band of resistance near 125 which has kept them in check, but also managed to soar through the mid-July 2015 low near 128 is very impressive.

All that they need to do now is to take out 140 on a closing basis and we can say that they have bottomed out on a medium term basis. Short term they remain bullish now that they have bettered those two aforementioned resistance levels.
The reason I have not yet turned bullish on the miners on a medium term basis is because of the following medium-term chart.

As you can see when you pan out and take a bit of a longer term view, the current move higher in the HUI is not all that impressive. The HUI has not had a weekly close above that line marked “MAJOR RESISTANCE” since early July of last year. A close through that would turn me bullish on a medium term time frame especially if the close involved being above the October 2014 spike low near 145-146.
This rally may present an opportunity in the days ahead for those who are still holding an excessively lopsided position in the gold shares to whittle that down somewhat so that they can diversify and perhaps rebalance their portfolios. That being said, you would want to watch for some signs that the rally in gold has run its course, something which as of yet it has given no indication it is ready to do.
The big thing supporting the gold market at the moment is the turmoil in the foreign exchange markets which is resulting in massive deleveraging and unwinding of large positions in one direction, namely short most major currencies and long the US Dollar.
As the market comes to terms with the idea that the Fed is not going to make a move in their upcoming March meeting, the dial-back in interest rate differential expectations is forcing this repositioning. That of course is resulting in large scale US Dollar selling.
What is going to be incredibly fascinating to watch play out is the response from the European Central Bank and the Bank of Japan. Neither one of them can be the least bit pleased to see their respective currencies surging higher especially after both, but especially the BOJ, only just recently announced their displeasure with the Yen at current levels. We also know from the recent Mario Draghi remarks, that the ECB is incredibly frustrated with the lack of inflationary pressures across the Eurozone with Mr. Draghi repeatedly making a point of telling us all how their statisticians were going to have to lower their estimates for inflation for not only this year but also on out into 2017 and even 2018. The LAST THING they now want to see is the Euro at current levels.
This is really coming down to a battle or more properly a war, between speculative interests and those two Central Banks which have made it clear that a major component, if not the major component of their plans to combat deflation and stave off a sluggish growth model is by weakening their respective currencies. With specs repositioning and being forced out of existing short positions, the sheer size of the leveraged carry trades involving those two currencies, the Yen and the Euro, is going to make defeating this unwind quite a feat.
I know that the Bank of Japan is not afraid to take on the specs but when it comes to the ECB, that is entirely another different matter. Their resolve is always iffy for among currency traders they do not have near the respect that the mere mention of the BOJ engenders.
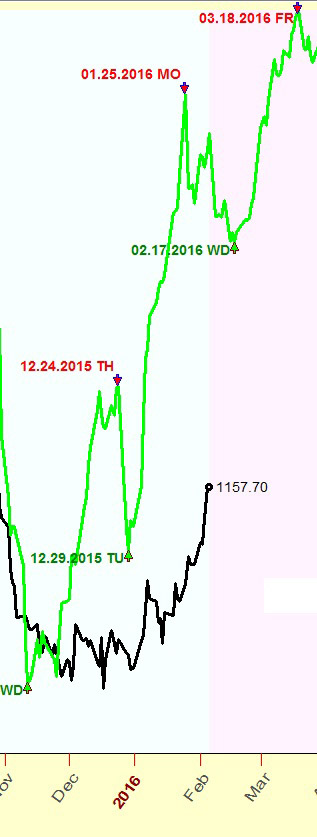
As far as gold itself goes, the metal has now run exactly to where the next chart level of resistance can be found.

Notice the downsloping trend line as it intersects with the lows made in March of last year. A push through this level will set up a legitimate shot at the October highs near $1190. Get through that and the medium term complexion of the gold chart will have changed.

-
I know Mike is a very solid investor and respect his opinions very much. So if he says pay attention to this or that - I will.
~ Dale G.
-
I've started managing my own investments so view Michael's site as a one-stop shop from which to get information and perspectives.
~ Dave E.
-
Michael offers easy reading, honest, common sense information that anyone can use in a practical manner.
~ der_al.
-
A sane voice in a scrambled investment world.
~ Ed R.
Inside Edge Pro Contributors

Greg Weldon

Josef Schachter

Tyler Bollhorn

Ryan Irvine

Paul Beattie

Martin Straith

Patrick Ceresna

Mark Leibovit

James Thorne

Victor Adair