
Gold & Precious Metals
 As 2015 comes to an end, gold feels solid. There are many factors coming into play in 2016 that should incentivize investors to add to their positions, and do so with comfort.
 - Please click here now. Double-click to enlarge this daily gold chart. A week ago, I suggested gold was forming a key inverse head and shoulders bottom pattern.
- The pattern has two heads, and a bit more work may be required to complete a right shoulder in the $1062 area. Overall, I like the technical action, and Chinese New Year buying is likely the fundamental catalyst that can launch a nice January rally.
- Please click here now. Inflation is suddenly on the move in Saudi Arabia, and in a country that already embraces gold, that’s going to add to demand.
- The Saudi government has announced that the price of gasoline with an octane content of 91 will be hiked by about 66%! The government’s budget deficit is approaching $100 billion, and FOREX reserves are sinking.
- Ominously, as the financial situation of the Saudi government deteriorates, the risk of civil unrest grows. Will a terrible crisis in Saudi Arabia be the trigger of the next global financial meltdown? I don’t know, but I do know that it’s critical to own gold bullion before geopolitical risk gets out of control.
- Please click here now. Double-click to enlarge this important US dollar versus Japanese yen weekly chart.
- If Saudi Arabia does tumble into a crisis, US dollars and US bonds may not be the safe haven they were during the 2008 financial crisis. Incredibly, the dollar began losing upside momentum against the yen a year ago, in spite of unprecedented QE in Japan.
- There’s a big head and shoulders top pattern in play for the dollar on that chart, and it’s testing a major uptrend line that extends back to 2012.
- Also, Janet Yellen is trying to raise rates with experimental tools, and if her experiment fails, money could pour out of the dollar, and into gold and the yen!
- It’s important for gold investors to be proactive rather than reactive. A lot of US stock market investors were badly burned in the 2000 and 2008 meltdowns, and they reacted by buying gold. They bought general equity stocks before those meltdowns, also as a reaction, to low rates.
- Investors should only react to price changes, and do so with modest buying on declines. Price rallies should be used to “prune” holdings. Pruning a tree (very light selling) or adding fertilizer to it (very light buying) is not the action known as “trading”.
- Traders use my www.guswinger.com trading service to trade GLD & GDX very successfully, but trading needs to be separated from investing. In the big picture, Western gold market investors should think like gardeners. They can use my unique pyramid generator at www.gracelandupdates.com to systematically prune and fertilize any golden tree!
- When an investor reacts to fundamental events and perceived scenarios with sudden movements of sizable capital, the odds of achieving long term success in any asset class become negligible.
- The world has experienced many crises, and it will experience many more, until the end of time. If Saudi Arabia disintegrates into a “Mad Max” state like Iraq or Syria, it will be far too late for investors to “react” to the situation by buying gold.
- Fear trade enthusiasts should also embrace the idea that the next major crisis in the West may not be as predictable as a lot of analysts want to believe it is.
- Please click here now. India continues to move closer to a massive 80% chop in the gold import duty.
- In India, gold is traditionally the scapegoat for high crude oil imports and massive government corruption. In early 2013, the Indian current account deficit had reached almost 5% of GDP. It’s down to under 2% now, and India’s most powerful jewellers are getting very good vibes from the nation’s finance ministry. A duty chop in the next national budget appears to have a green light
- Also, the PBOC-controlled Shanghai Gold Exchange (SGE) is set to launch a gold fix around April. That’s around the same. time that India’s next budget is released. April is shaping up to be a very interesting time for gold price enthusiasts!
- The news for silver is, arguably, even better than for gold! On that note, please click here now. Indian imports of silver have been surging, and are approaching 8000 tons on an annualized basis. The import duty applies to silver as well as to gold. A chop in that duty could lead to even bigger demand for silver.
- In the Western gold community, the World Gold Council (WGC) has a bit of a bad name. A new World Silver Council is being launched, in India, and that should also help to significantly boost silver demand.
- Please click here now. Double-click to enlarge. That’s the daily silver chart.
- There’s a nice inverse head and shoulders bottom pattern in play, and a January rally would take the price of this mighty metal closer to the “AISC Threshold” for many miners. A number of Western silver mining companies have AISC (all-in sustaining costs) in the $16 area.
- Some investors may be wondering whether they should own silver bullion or the silver mining stocks. I suggest owning both assets. If Indians are buying over 7000 tons a year, Western investors should buy some too. With the launch of the WSC (World Silver Council), silver mining companies may have a new friend. 2016 will be a great year for gold, and an even better one for silver!
Dec 29, 2015
Stewart Thomson
Graceland Updates
website: www.gracelandupdates.com
email for questions: stewart@gracelandupdates.com
email to request the free reports: freereports@gracelandupdates.com
Graceland Updates Subscription Service: Note we are privacy oriented. We accept cheques. And credit cards thru PayPal only on our website. For your protection we don’t see your credit card information. Only PayPal does.
| Subscribe via major credit cards at Graceland Updates – or make checks payable to: “Stewart Thomson” Mail to: Stewart Thomson / 1276 Lakeview Drive / Oakville, Ontario L6H 2M8 / Canada |
Stewart Thomson is a retired Merrill Lynch broker. Stewart writes the Graceland Updates daily between 4am-7am. They are sent out around 8am. The newsletter is attractively priced and the format is a unique numbered point form; giving clarity to each point and saving valuable reading time.
Risks, Disclaimers, Legal
Stewart Thomson is no longer an investment advisor. The information provided by Stewart and Graceland Updates is for general information purposes only. Before taking any action on any investment, it is imperative that you consult with multiple properly licensed, experienced and qualifed investment advisors and get numerous opinions before taking any action. Your minimum risk on any investment in the world is 100% loss of all your money. You may be taking or preparing to take leveraged positions in investments and not know it, exposing yourself to unlimited risks. This is highly concerning if you are an invetor in any derivatives products. There is an approx $700 trillion OTC Derivatives Iceberg with a tiny portion written off officially. The bottom line:

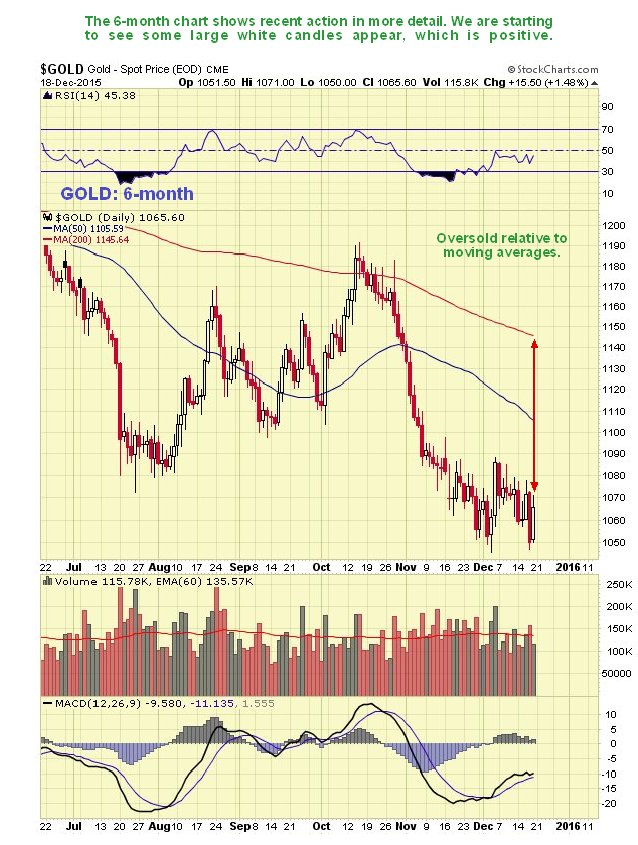
Gold’s technical picture is actually little changed from the last update posted on the 6th, apart from its having made marginal new lows late last week. What has changed is that we have since seen the Fed raise interest rates for the first time in many years, and the Junk Bond market has started to seriously fall apart.
With respect to the rise in interest rates there are two points to be made. The first is that, contrary to the general belief that gold is less attractive in an environment of rising rates because it doesn’t pay interest, it actually does well, because some of the money that floods out of the stockmarket flows into gold. Second, the Fed’s diminutive rate rise was a hollow face-saving measure, intended to salvage some credibility after it had been “crying wolf” for so long. It is too little and far too late. The time to raise rates is when the economy is strengthening and beginning a new growth cycle – what has happened here is that they are trying to raise rates at a time when an artificially induced recovery brought about by a tidal wave of money printing is already spluttering and running out of steam. The Fed, having been progressively cornered by their past misdeeds and gross excesses, are desperately trying to demonstrate that they are still in control when they no longer are. The market has got the ball now and will show them who’s boss by crashing the Junk Bond market, which is already happening, starving the stockmarket of buyback funds so that it collapses, with the result that the Fed has to make a groveling about face into NIRP and then embark on its final act of reckless abandon, QE4, at which point gold will take off like a rocket. So it is by no means guaranteed that the dollar will embark on another major upleg – if the market figures out that this is going to happen, the dollar could top out here.
Looking now at the charts, we will start with the 6-month chart which shows recent action in detail. On it we can see more clearly the new closing low on Thursday, and how some larger white candles are starting to appear on the chart, which is a positive.
While the Federal Reserve continues to rig the financial markets by way of its insane interest rate policy, U.S. silver production took a big hit in September. How big? Well, let’s just say…. it took me by surprise.
According to the U.S. Geological Survey (USGS), overall domestic silver production for 2015 has trended lower compared to last year. However, the recent data for September show a much larger decline.
U.S. silver production for September fell a staggering 20% compared to the same month last year:
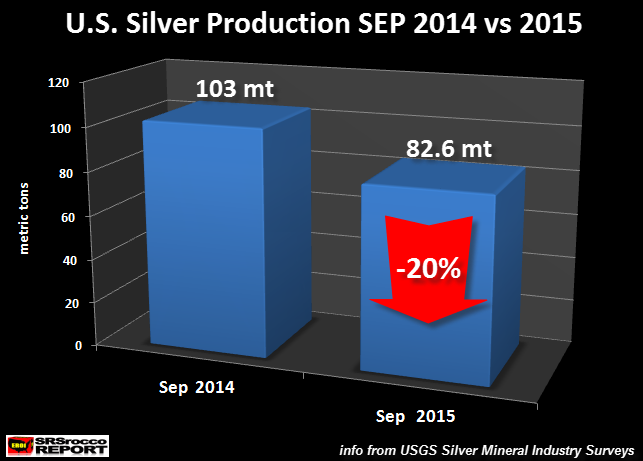
As we can see from the chart U.S. silver production fell to 82.6 metric tons (mt) in September compared to 103 mt during the same month last year. This amounts to a decline of 20.4 metric tons or a 20% plunge versus last year.
This is a large amount if we compare the total decline year to date in 2015 (JAN-SEP) is only 41 mt (5%). I asked the USGS silver specialist if he thought the September’s production figures would be revised higher in the following months. He responded by saying, “Probably not.”
Falling silver production is also taking place in several of the top producers in the world:
Mexico = -4% (Jan-Sep)
Chile = -4% (Jan-Aug)
Canada = -23% (Jan-Oct)
Australia = -41% (Jan-Aug)
(data from Canada Dept of Natural Resources, Mexico INEGI & Chilean Copper Commission)
As I have stated in many articles and interviews, PEAK SILVER will occur first in the base metal mining industry where the majority of by-product silver is produced. According to the data from the 2015 World Silver Survey, 55% of all silver produced in 2014 came as a by-product of zinc, lead and copper production. Furthermore, 13% came as a by-product of gold mining, while the remaining 31% was from primary silver production.
Global silver production will fall more rapidly in the following years as an increasing number of base metal mines shut down due to lower copper, lead and zinc prices. This will occur right at a time when investors finally realize just how undervalued silver is compared to most of the highly overvalued paper garbage the world is invested in.
Lastly, something changed in the U.S. Silver Market this year. In Steves latest article he covers with 8 excellent charts the imports dynamics of silver in his article Something Broke In The U.S. Silver Market This Year

Today’s videos and charts (double click to enlarge):
Key Precious Metal ETFs Video Analysis
Bonds, Dollar, & US Stock Market Video Analysis
Trader Time Swing Trades Video Analysis
Key Individual Precious Metal Stocks Video Analysis
Thanks,
Morris

-
I know Mike is a very solid investor and respect his opinions very much. So if he says pay attention to this or that - I will.
~ Dale G.
-
I've started managing my own investments so view Michael's site as a one-stop shop from which to get information and perspectives.
~ Dave E.
-
Michael offers easy reading, honest, common sense information that anyone can use in a practical manner.
~ der_al.
-
A sane voice in a scrambled investment world.
~ Ed R.
Inside Edge Pro Contributors

Greg Weldon

Josef Schachter

Tyler Bollhorn

Ryan Irvine

Paul Beattie

Martin Straith

Patrick Ceresna

Mark Leibovit

James Thorne

Victor Adair