Gold & Precious Metals
Wednesday’s list of exchange-traded products hitting all-time lows is a graveyard of precious metals funds. To this point in Wednesday’s session, 16 ETFs and exchange-traded notes (ETNs) have touched all-time lows, with half of those being precious metals products.
That group of eight does not include another six diversified commodities ETFs, several of which have ample precious metals exposure.
Commodities Overview
Following last week’s terror attacks in Paris, oil has been getting seemingly more attention than usual, but the persistently strong U.S. dollar has been a drag on… CLICK HERE for the complete article

Get ready for a bounce in silver
Posted by Jeff Clark, Stansbury report
on Tuesday, 17 November 2015 21:54
As of last Friday, the price of silver had closed lower for 12 days in a row. I can’t recall any other time in my 30-plus-year career when silver has put together such a long string of losses. (Crux note: We looked it up. It’s the longest losing streak for silver in 65 years.)
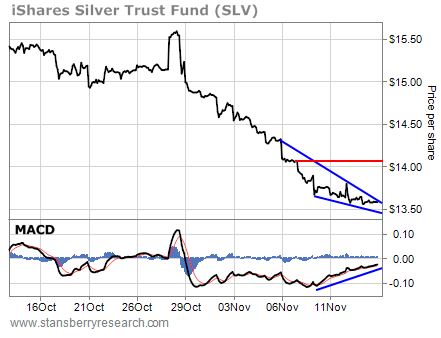
The price of the metal is down around 8% for the month. But there is some good news…
With conditions stretched so far to the downside, silver is poised for a bounce…
Take a look at this 60-minute chart of the iShares Silver Trust Fund (SLV)…

he tragic events in Paris, terrorism and war throughout the world, show geopolitical risk remains high. These risks will likely impact economies and financial markets and will see continuing safe haven demand for gold
The price of gold might be falling, but private individuals are buying record amounts of the precious metal, and as fears grow about the outlook for the global economy the long term attraction of gold remains according to John Ficenec…

Must see chart: ALL eyes on gold now!
Posted by Larry Edelson - Commodities, Stocks, Technical Analysis
on Wednesday, 11 November 2015 15:24
Here’s a forecast chart I’ve been showing to members of my Real Wealth Report and Supercycle Trader this year. It is a must-see chart.
It’s a form of artificial intelligence, called a neural net, a forecasting model I use. This chart is of gold, and includes all known fixed and dynamic cycles that impact gold’s price.
The program finds the probable cycles in gold’s price fluctuations, dynamically updates them with billions of calculations, and then it projects forward a synthesis of those cycles to show the probable path of price.
The green line is the forecast line. The black line, the actual closing price of gold.
Uncanny, eh? This is one of the main tools I use for forecasting, not just in gold, but in all markets.
Now, let’s get to the exciting stuff. Remember I told you that this November was shaping up to be an ideal target low for gold? Throughout the year I mentioned it several times in this column. Just a few weeks ago I also told you that gold’s October rally was nothing but a bounce.
And now look at gold: It topped right on cue in mid-October and since then gold has plunged from its October forecast cycle high — shedding $108, a whopping 9.1% in less than a month — and is now plunging into a November low.
In the words of the late and great Jackie Gleason, “How sweet it is!”
So what’s next for gold? Can gold move still lower? Will this be a major bottom in gold?
What about the subsequent rally that is forecast on this chart (green line)? What should you do about it?
Let me answer those questions now …
FIRST, as this forecast chart clearly shows, gold can indeed move lower — into Wednesday, November 25.
That does not mean gold will continue to go straight down. Gold has already lost $108 since mid-October and is oversold on a short-term basis. So don’t be surprised if you see a mild bounce or two. But according to the forecast models, gold should — yes — head lower into November 25.
How low can it go? This is the tricky part. Cycles do not tell you much about price. They are about timing and turning points. My other tools come into play to determine price forecasts, and here is the bottom line:
A. Gold has major support at the nearby former low from July at $1,074. That low may hold temporarily, but it should give way heading into November 25. Once it does give way …
B. Gold’s major support levels will then be found at $1,063 … $1,035 … $1,005 … $984 … and the $905 to $890 area.
Right now, it’s simply too soon to say. But I suspect, based on early indications from my price projection tools, that gold will fall to at least the $1,035 level.
Ideally, I would like to see gold fall below $1,000. That would scare the dickens out of almost every gold investor on the planet, thereby setting up the market for an even more powerful rally to follow.
SECOND, and very importantly, as to whether or not this will be a major bottom in gold, here’s what we need to see …
A. For the move down to qualify as a major, final low in gold’s bear market since 2011, gold must break the former low at $1,074 and test the next major support level at $1,035.
B. If gold holds the prior $1,074 low — or falls through it but does not test major support at the $1,035 level — then odds are that it will NOT be a major, final low and that instead, gold will then rally, but decline again into April 2016 to yet another new, low.
If that is the case, then the new low that occurs in April 2016 will likely be around the $1,000 level, and it would then be the final low.
Either way, gold is nearing a final, major low. Hopefully, it will come sooner rather than later, in April of next year.
THIRD, as to the rally forecast on this chart, yes, it’s likely going to be a doozie! Moreover, that rally is likely to occur whether or not gold breaks its prior low at $1,074.
Stay tuned …
Best wishes,
Larry

- In the short term, gold and related items have a rough general tendency to decline into the US jobs report, and then to rally in the days (and weeks in some cases) following the release of that report.
- Please click here now. Double-click to enlarge. That’s the daily chart for Barrick, and it’s rallying nicely, on “post jobs report cue”.
- There’s a beautiful inverse head and shoulders bottom in play, with the decline ahead of the jobs report creating the right shoulder of the pattern.
- A three day close above $8.50 is required now, to launch Barrick towards my $10.40 area price target. All of Barrick’s technical lights are green, and the company has dramatically reduced debt and AISC (all-in sustaining costs).
- Barrick often acts as a “lighthouse” for the entire gold stocks sector. It’s clearly forecasting very smooth sailing ahead, for most gold and silver mining stocks!
- Please click here now. That’s the daily chart for gold. I recommended shorting some gold in the $1170 – $1190 area, as my key 14,7,7 series Stochastics oscillator became dramatically overbought in the 90 area.
- Investors should be covering a solid tranche of those positions now. Watch the short term trend line I’ve highlighted on that chart. An upside breakout appears imminent, and the Stochastics oscillator is now massively oversold, with the lead line sitting at about 3!
- The decline into the jobs report was intense for two reasons. First, El Nino caused rainfall in rural India to come in at about 86% of normal. That meant farmers had less money to spend on gold.
- Regardless, it’s the big picture that matters. On that note, please click here now. The world price of gold could be driven dramatically higher, if Indians become comfortable with buying gold online. Online gold sales have been tried in China, but with only limited success.
- Any company that succeeds in making Indians absolutely comfortable with buying gold online would probably have an effect on the price of gold that is second only to a US financial system implosion. The shocking online demand growth statistics in India, released by online sales company Amazon this morning, suggest that such a situation may be much closer at hand than most analysts realize.
- The second reason for the recent price decline is that gold tends to sell off with significant intensity, ahead of a rate hike by the Fed. The combination of El Nino and the Fed rate hike preparations were a potent short term headwind for gold.
- The good news is that the US dollar typically tends to decline, right after the first rate hike in a tightening cycle. Please click here now. If Pete Fay is correct, and I think he is, the US dollar is poised to begin a significant sell-off in early January, following the Fed’s first rate hike at the upcoming December meeting. That’s fantastic news for gold price enthusiasts around the world.
- Most analysts that think rate hikes are coming, think so because the US economy is improving. In stark contrast, I argue that rate hikes are coming because the economic upswing has been anemic.
- Low rates have pressured savers to pull money out of banks, and gamble their savings in “risk on” markets. That’s created an implosion in money velocity, and while there’s no guarantee that rate hikes will reverse that velocity, the policy of forcing savers to gamble has been a complete disaster.
- Government size and red tape have grown exponentially as rates have stayed low. If rates go any lower, money will pour out of government bonds and into mattresses, making an already horrific situation “beyond horrific”.
- It’s up to Janet Yellen to fix what Alan Greenspan, Ben Bernanke and US congress have ruined, and I think she will finally begin to do so, starting on December 16th.
- Please click here now. As commodity index expert Jodie Gunzberg notes, energy comprises a staggering 70% of many indexes, and there’s a key divergence taking place now, between energy stocks and energy bonds.
- As the dollar declines when the Fed hikes rates, energy should rise nicely, bringing a new wave of institutional interest to the entire commodity sector.
- Please click here now. Regardless of what happens in America, the global price of gold will ultimately be carried onwards and upwards, by the gargantuan love trade in India, China, and Dubai.
- Dubai’s gold industry moves about $20 billion USD of gold each year, and demand is growing at a solid 8% pace. In contrast, global mine supply is floundering at 3% growth in a good year, and seems destined to flat line.
- Silver jewellery is also becoming popular, especially in India, where demand is skyrocketing. Please click here now. That’s the daily chart of the key SIL-NYSE silver stocks ETF.
- This decline, caused by the jobs report, was “technically necessary”. It created the right shoulder of the significant inverse head and shoulders bottom pattern. That is now in bullish play.
- Note the action of the 14,7,7 Stochastics oscillator, at the bottom of the chart. The lead line is hooking up nicely. Interestingly, this is occurring while many frightened analysts draw huge arrows on their charts, to dramatically lower prices.
- I expect the next COT report to show that major banks have been significant buyers into this decline. I would suggest that all silver stock enthusiasts need to take buy-side action, and do it right now!
Nov 10, 2015
Stewart Thomson
Graceland Updates
website: www.gracelandupdates.com
email for questions: stewart@gracelandupdates.com
email to request the free reports: freereports@gracelandupdates.com
Graceland Updates Subscription Service: Note we are privacy oriented. We accept cheques. And credit cards thru PayPal only on our website. For your protection we don’t see your credit card information. Only PayPal does.
Subscribe via major credit cards at Graceland Updates – or make checks payable to: “Stewart Thomson” Mail to: Stewart Thomson / 1276 Lakeview Drive / Oakville, Ontario L6H 2M8 / Canada |
Stewart Thomson is a retired Merrill Lynch broker. Stewart writes the Graceland Updates daily between 4am-7am. They are sent out around 8am. The newsletter is attractively priced and the format is a unique numbered point form; giving clarity to each point and saving valuable reading time.
Risks, Disclaimers, Legal
Stewart Thomson is no longer an investment advisor. The information provided by Stewart and Graceland Updates is for general information purposes only. Before taking any action on any investment, it is imperative that you consult with multiple properly licensed, experienced and qualifed investment advisors and get numerous opinions before taking any action. Your minimum risk on any investment in the world is 100% loss of all your money. You may be taking or preparing to take leveraged positions in investments and not know it, exposing yourself to unlimited risks. This is highly concerning if you are an invetor in any derivatives products. There is an approx $700 trillion OTC Derivatives Iceberg with a tiny portion written off officially. The bottom line:


-
I know Mike is a very solid investor and respect his opinions very much. So if he says pay attention to this or that - I will.
~ Dale G.
-
I've started managing my own investments so view Michael's site as a one-stop shop from which to get information and perspectives.
~ Dave E.
-
Michael offers easy reading, honest, common sense information that anyone can use in a practical manner.
~ der_al.
-
A sane voice in a scrambled investment world.
~ Ed R.
Inside Edge Pro Contributors

Greg Weldon

Josef Schachter

Tyler Bollhorn

Ryan Irvine

Paul Beattie

Martin Straith

Patrick Ceresna

Mark Leibovit

James Thorne

Victor Adair