
Gold & Precious Metals
 With a 4.5% chance of rate hike priced into the markets at today’s FOMC meeting, it is unlikely that anything exciting will happen today. However, with China outflows, BoJ easing expectations, and Draghi still promising moar, it appears precious metals are once again bid. Both Gold & Silver have broken back above their 200-day moving-averages this morning…
related at ZeroHedge:


 In the next few weeks the banks may engineer another gold and silver smash, but silver prices will rise considerably in 2016 – 2020.
“Aaron’s analysis (along with others) shows that silver prices are in a technical position similar to late 2008. Silver prices climbed from under $9 in 2008 to nearly $50 in the subsequent 2.5 years.”
Retail silver is more difficult than usual to source. As they say, “the cure for low prices is low prices.” A shortage of physical silver shows up in higher premiums above the paper COMEX prices. There is no shortage of paper contracts for silver, which can be created in an instant with digital currencies created from nothing by a compliant central bank. Physical silver and gold are not so easily created and consequently can experience severe shortages. Prices for the real stuff will rise.
Strengths
- Palladium was the best relative performing precious metal this week, recording a fall of just 0.27 percent. Palladium has been in a gentle decline post the Volkswagen story on emissions fixing, but rallied the last few days of this week.
- Gold traders are maintaining their bullish calls on the precious metal for the third week in a row. Of the 24 traders surveyed by Bloomberg, 13 hold a bullish outlook on gold.
- Gold got a boost this week as China announced further interest rate cuts and the ECB re-emphasized its pledge to use all the monetary tools at its disposal to support global growth. Furthermore, Russia boosted its gold purchases by the largest amount in a year throughout the month of September, adding 34 tonnes.
Weaknesses
- Silver was off 1.47 percent, making it the worst performing precious metal this week. Silver is normally more volatile than gold, so during a week that gold declines we should expect to see silver be pared back more so than gold.
- India has officially announced the implementation of its gold monetization scheme that is set to replace existing deposit structure. The plan seeks to reduce imports as banks will now be allowed to sell or lend gold to retailers, thus boosting supply if owners of the gold trust the system enough to lend their gold to the state.
- Argonaut Gold is facing some operation issues as an illegal blockade has formed at its El Castillo mine in Durango, Mexico.
Opportunities
- Investors are eyeing gold once again as $393 million flowed into U.S. precious metals-backed exchange traded funds this month, through October 20. After a multiyear downturn in the precious metal, more bulls are emerging. Retail investors have depleted coin dealer inventories of silver coins, Russia and China are buying gold, and even Paul Singer of Elliot Management said recently that investors should have up to 10 percent of their portfolio in gold and/or gold stocks.
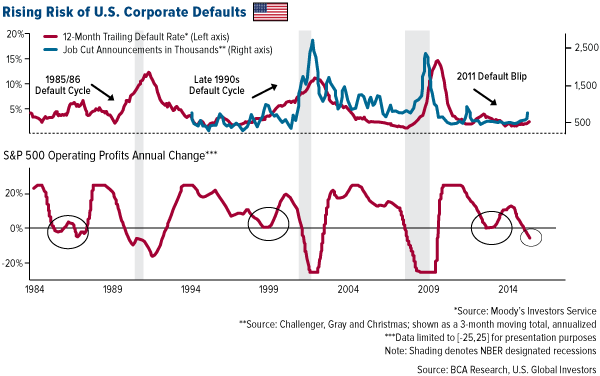
- The corporate sector could cause trouble for the U.S. economy as profits are contracting on a year-over-year basis. What’s more, every contraction in profits since 1980 has coincided with a rise in the corporate default rate. The default rate also closely correlates with job cut announcements.
- Overall, credit conditions for U.S. companies are already deteriorating as the 10-month span through this year has seen more S&P downgrades than the prior two years combined. Even more concerning is that these downgrades are not solely limited to the energy space. Challenger Gray noted that they are seeing layoffs at major firms at a level they have not witnessed since 2009.
Threats
- The largest hurricane the world has ever recorded could cause trouble for certain Mexican mining operators proximal to the Western coast. The third-quarter rainy season just ended, normally playing havoc with heap leach operations. Companies such as Primero, Alamos and Argonaut could be affected; potentially even Goldcorp or Agnico-Eagle, should the rainfall be intense.
- Goldman Sachs is expecting the Federal Reserve to hike rates in December and sees gold suffering as a result. The bank sees gold falling to $1,000 over the next 12 months.
- Faced with significant debt repayments, the Venezuelan government may tap into its gold reserves to generate sufficient cash. Venezuela dumping its gold could put negative pressure on global prices. Venezuela also made the news when the country notified Guyana Goldfields that its mine, which is nearly finished with construction, is on land claimed to be owned by Venezuela and not Guyana.
Silver is finally showing some signs of life after suffering a dark year. The epically-bearish sentiment that bludgeoned this metal to major secular lows is cracking, with a strong rebound rally now underway. And this recent buying is likely just the earliest vanguard, as silver remains deeply undervalued relative to its primary driver gold. Silver will need an utterly massive upleg to fully mean revert to normal levels.
Silver has been out of favor for a long time, the last few years. And 2015 didn’t give beleaguered silver investors much hope. By late August, July’s extreme gold-futures shorting attack had dragged silver down to a major 6.0-year secular low. Down 9.9% year-to-date at that dark nadir, silver was left for dead by traders. The despair was real, as it certainly felt like silver was doomed to keep grinding lower forever.
Silver’s slumber was certainly vexing, but this metal was way overdue for a rebound rally as I predicted at the time. And indeed that’s come to pass. Since silver’s dismal lows in late August, this metal has surged 14.4% at best. Fully 4/5ths of these impressive gains came in the first two weeks of October alone. This strong rally blasted silver above its 50-day moving average to challenge its critical 200dma.
With silver awakening again, investors and speculators need to ask themselves two key questions. What fueled silver’s sharp gains this month? And will that driving force continue pushing silver higher? The quick answers are gold and yes. Silver looks super-bullish today because its price levels relative to gold are exceedingly low. Silver is going to have to power dramatically higher to restore this relationship to normal.
For all silver’s unique investment and industrial merits, history has proven it is ultimately just a leveraged play on gold. Silver prices’ long-term correlationwith gold prices is incredibly high. This is because gold is what gets traders interested in the entire precious-metals complex. Silver is ignored until gold starts moving, then once it does capital floods back into silver to try and catch one of its wealth-multiplying uplegs.
Since November 2001 when silver’s last secular bull was stealthily born, silver’s subsequent 3.5k closes leading into today have enjoyed a correlation r-square with gold of 89%! That’s amazingly high over such a long span, and indicates that gold’s own price action can mathematically account for almost 9/10ths of silver’s own. Technically silver is slaved to gold, totally dependent on the yellow metal’s fortunes.
After watching silver’s intraday price action in real-time all day every day for 16 years now, I think of silver as a gold sentiment gauge. Speculators and investors are only prone to buy silver when gold is rallying and they think it will continue higher. When gold is weak and they wax bearish on it, they want nothing to do with silver and sell it lower. This crucial psychological link is why gold dominates silver price action.
And obviously gold sentiment has proved exceedingly bearish this year, as is evident in the radical gold underinvestment. Since silver tends to leverage and amplify moves in gold, this has battered silver far below normal price levels relative to gold. Thus silver is deeply “undervalued” in light of prevailing gold prices. That means silver’s upside potential in the coming years far exceeds its normal leverage to gold.
This critical concept is easiest to understand with charts, which distill vast amounts of price data down to easily-digestible overviews. This first one looks at silver prices and gold prices over the past decade or so. Silver prices are not only anomalously low today, but they have fallen behind gold periodically in the past too. What happened after those earlier underperformance episodes? Silver skyrocketed higher to catch up!

Back in late August 2015, silver was literally trading near panic levels. That brutal 6-year secular low hit prices last
seen in August 2009 emerging from late 2008’s once-in-a-century stock panic. That event was the greatest fear superstorm we’re likely to see in our lifetimes, and it hammered highly-volatile and speculative silver far below normal levels relative to gold. Today a similar silver-lagging-gold situation exists.
If you weren’t trading silver in late 2008, you can’t even imagine how horrendous sentiment was in the dark heart of that stock panic. The extreme stock-market plummet, 30% in a single month in the benchmark S&P 500, blasted silver down under $9! Speculators and investors alike fled all risky assets, which volatile silver certainly qualifies as in spades. Most were convinced silver would never rally again.
Yet the blackest depths of despair, peak fear, are the very best times to buy anything as I advised at the time. Everyone succumbing to bearish groupthink to believe an asset is doomed capitulates and flees, and all their irrational selling forces prices to extreme lows. With those weak-handed sellers exhausted, only buyers remain. So silver soon reverses and recovers, with powerful accelerating upside momentum.
Indeed over the next 2.4 years, silver mean reverted from universal loathing to overshoot to widespread popularity. This inevitable sentiment shift out of excessive fear ultimately catapulted silver an incredible 443% higher! Brave contrarian speculators and investors who could fight the bandwagon herd to buy low more than quintupled their capital! And that was over a span where the S&P 500 merely rallied 81%.
That wasn’t the only massive silver upleg after it became deeply undervalued relative to gold. Way back in 2005, silver fell behind gold again as precious metals fell out of favor. Yet once sentiment shifted the other way in 2006, silver soared 124% higher in well under a year! Silver lagging gold, being deeply undervalued and way out of favor, is the most bullish time possible to aggressively buy this volatile asset.
Note above that’s exactly what we are seeing today. Thanks to the Fed’s extreme QE3-driven anomaly in recent years, silver has been abandoned and left for dead. The Fed’s unprecedented open-ended bond monetizations and associated jawboning levitated the general stock markets. That sucked capital out of everything else, including gold and therefore silver. Thus silver prices drifted farther below gold prices.
During the great majority of the time since 2005, silver prices have closely mirrored gold’s and traveled within the massive expanding triangular uptrend shown above. Silver’s secular support bound this on the low side, only failing when silver was anomalously underpriced like during 2008’s stock panic and today. Silver’s secular resistance held strong except when silver became popular and skyrocketed in 2011.
Since the prevailing gold prices argue for much higher silver prices today, odds are this young new gold upleg already underway is going to soon catapult silver back into that strong uptrend. Support is now running near $23, which is nearly 50% above current silver prices! But after falling under this key secular support, silver’s mean-reversion uplegs gain so much momentum they don’t stop until hitting resistance.
That secular resistance line today is way up near $45! While that’s certainly possible as silver inevitably grows popular again, let’s pick a more conservative potential price target right in the middle of that expanding uptrend. That would carry silver back over $33, which is massive mean-reversion upside potential. We are talking about additional 110% gains in silver from today’s prices, an incredible buying opportunity.
As you can see when the silver price is overlaid on gold’s, silver kind of looks like a giant sine wave that slowly oscillates ground gold. Periods of silver undervaluation relative to gold are followed by huge mean reversions higher until silver is overvalued relative to gold. And since silver is languishing in such deep secular undervaluation territory today, the odds overwhelmingly favor a gigantic new upleg.
Thankfully there is a better way to look at the ironclad price relationship between silver and gold that is a lot easier to parse. It is known as the Silver/Gold Ratio, or SGR. The SGR simply divides the daily close in silver by the daily close in gold. But since silver is so much cheaper than gold, this yields a hard-to-interpret tiny decimal number. So it’s easier to divide gold by silver and invert the result for a cleaner SGR.
This next chart looks at the SGR over this same secular span, really highlighting the cyclical nature of silver relative to gold. This construct effectively flattens the gold price to a horizontal line, which silver prices meander around. And incredibly so far in 2015, silver prices are so low relative to gold that they are almost at extreme stock-panic levels! This isn’t sustainable for long, portending an imminent mean reversion.

Carefully digest this chart, and you’ll understand why silver has very high potential of again multiplying wealth fabulously in the coming years. Mean reversions are one of the most powerful forces in all the markets. The more extreme the deviation from the mean, the bigger the subsequent reversion in the opposite direction to restore normalcy to the relationship. Silver’s upside is vast given its recent extreme lows.
Before we can understand mean-reversion potential, we have to establish a mean. Over the entire span of this secular chart since 2005, this SGR (more precisely an inverted GSR) averaged 59.3. The silver price tended to trade at 1/59th the price of gold. At this week’s gold price of $1167, that yields a normal silver price of $19.67. That’s another 25% higher from today’s price levels, a deep silver undervaluation.
But I suspect that long-term-average SGR is misleading, far too high. It was dragged up by two incredibly anomalous events that aren’t going to be repeated. Back in late 2008, the first true stock panic since 1907 hit. The resulting extremely-low silver prices were ludicrous and not sustainable. And then in early 2013, the Fed launched the first-ever open-ended quantitative-easing campaign in its entire history.
The Federal Reserve was established by Congress in 1913. So silver prices have been battered down in this past decade two separate times by once-in-a-century types of extreme events. These just aren’t repeatable. It’s likely to be many years if not decades before the next general-stock-market panic sucks silver in. And the Fed can never birth a new first-ever open-ended debt-monetization scheme again.
Prior to 2008’s extremely-anomalous stock panic, the SGR averaged 54.9. And then from 2009 to 2012, the “normal” years between that panic and the Fed’s 2013 ramping of QE3’s money printing to buy up bonds, the SGR was averaging a similar 56.9. These are both secular spans too, 3 years and 8 months for the pre-panic one and 4 years even for the post-panic one. So they are representative of normal markets.
The midpoint of the pre-panic 54.9 and post-panic 56.9 weighs in at 55.9. An SGR right around 56 is where silver prices have oscillated relative to gold in all the non-anomalous recent years. And 56 is actually very conservative for a variety of reasons. For most of the past century, the SGR has averaged under 50. Remember that the lower this ratio, the higher silver needs to be priced relative to prevailing gold prices.
And geologically, the ratio of silver to gold in the Earth’s crust is about 19 times. So not surprisingly for at least a couple hundred years prior to this past century, the SGR hovered around that near 16. So using the 56 average level from normal years of the past decade is incredibly reasonable and restrained. Literally several centuries of silver price history argue for vastly higher silver prices when compared to gold.
But even at that 56 SGR, silver would be priced near $21 based on this week’s gold prices. That’s 33% higher than today’s levels, which would be a nice run. But silver’s appreciation potential in the coming years is radically larger than that for two key reasons. First, mean reversions out of extremes always tend to overshoot in the opposite direction. Second, gold itself is due to power higher in the coming years too.
Remember this SGR construct effectively flattens the gold price to horizontal, and silver’s price oscillates around it. So like all mean-reversion relationships in the financial markets, periods of undervaluation are followed by periods of overvaluation. Once the SGR has been extremely low or extremely high due to excessive fear or greed, it doesn’t just stop at the average. Instead momentum carries it to the opposite extreme.
A great analogy for market psychology and price cycles is a pendulum. Pendulums certainly have an equilibrium point, hanging straight down. That’s their mean. But once they are pulled in one direction, they never just stop at their mean. Instead pendulums race through that equilibrium, overshooting proportionally to the opposite extreme before stabilizing. That’s the same way market cycles work as well.
The farther the pendulum was pulled to one side of its arc, the greater the extreme, the faster the swing and the bigger the overshoot to the opposite extreme. And silver’s prices relative to gold have certainly been extreme this year. So far in 2015, the SGR has averaged 73.8. Provocatively that’s not too far below 2008’s stock-panic average of 75.8. And that stock-panic mean reversion saw a colossal upside overshoot.
Conservatively, we can use an overshoot target of 45 which is the top of the SGR’s secular trading range. That yields a silver price target near $26 at prevailing $1167 gold prices, a 65% gain from here! But after the stock panic, the SGR overshoot didn’t stop at the top of its trading range. Instead all of that momentum buying, the equivalent to a pendulum’s kinetic energy, briefly pushed the SGR below 35.
That kind of similar overshoot from today’s similar deep-undervaluation extremes would push silver above $33 at current gold prices. That would require an enormous 112% gain from here! But as legendary pitchman Billy Mays used to say, “But wait, there’s more!” Silver’s mean reversion to normal levels relative to gold isn’t going to happen in a vacuum where gold is static. Gold prices too are overdue for a major upleg.
This is largely due to today’s radical gold underinvestment fostered by the Fed. As market conditions return to normal, investors around the world will really boost their crazy-low portfolio allocations to gold to regain some modicum of diversification. Today’s gold-price levels are almost as anomalous and extreme as silver’s! In 2013 and 2014 for example, years racked by extreme gold-futures shorting, gold averaged $1338.
Let’s call that $1350 for illustration terms. At $1350 gold, that normal-year-average 56 SGR yields a silver target over $24. That’s 54% above today’s levels. And at that 45 SGR that is the upper resistance line of its secular trading range, $1350 gold calls for a silver target of $30. That’s 91% above this week’s close! As gold itself inevitably mean reverts higher, the SGR-derived silver price targets naturally rise with it.
But like the SGR, gold too is also likely to overshoot from recent years’ Fed-distortion-driven extremes. It is hard to believe since gold has been so weak for so long, but gold prices averaged $1669 in 2012 before the Fed’s open-ended QE3 debt-monetization campaign radically contorted the market landscape. Let’s call that $1675. At $1675 gold, a merely-average 56 SGR yields a silver target 91% higher near $30.
And at $1675 gold and a modest SGR overshoot to 45 resistance, we are talking about silver over $37 which is 137% higher than today’s levels! Put in a higher-probability overshoot to 35 following 2015’s anomalously-low silver prices, and silver’s target shoots near $48 right at its dazzling April 2011 peak the last time silver became popular. That’s 205% higher from here, a wealth-multiplying triple in silver’s price!
If you don’t like my numbers, feel free to plug in any you want. But no matter how you slice it, silver is deeply undervalued relative to gold today. Mean reversions, restoring extreme price anomalies to their normal relationships, are one of the most powerful and profitable principles in all the markets. And no matter what gold does within reason, silver is simply too cheap relative to gold prices. Silver has to mean revert!
While doubling or tripling your money in silver bullion in the coming years is very appealing, silver’s raw potential is greatly dwarfed by that of its beaten-down miners’ stocks. Silver-stock prices are even more anomalous relative to today’s silver prices than silver is relative to gold. The elite silver miners, even though they can profitably mine silver at $15, are priced as if they are threatened with an imminent extinction.
So in addition to aggressively buying silver coins and bars, or the flagship SLV iShares Silver Trust silver ETF, deploy into the best silver miners’ stocks. They amplify silver’s gains in normal times, and coming out of such epic lows that leverage is going to skyrocket. I suspect the great silver stocks are in for gains running 4x+ silver’s own, which means their upside from today’s left-for-dead prices is epic.
We’ve long specialized in contrarian speculation and investment at Zeal, concentrating on precious metals. In recent months we’ve been buying up the best silver stocks in fundamental terms, which are on the trading books of our acclaimed weekly and monthly subscription newsletters. With gold and silver starting to move, the buy-low window for silver stocks is rapidly closing. Don’t procrastinate any longer!
Subscribe today and start thriving! Our popular newsletters draw on our decades of exceptional market experience, knowledge, and wisdom to analyze the markets from a unique contrarian perspective. We really do walk the walk in buying low and selling high. All 700 stock trades recommended in our newsletters since 2001 have averaged annualized realized gains of +21.3%! We are also running a 20%-off sale.
The bottom line is silver is deeply undervalued today relative to prevailing gold prices. Traders fled silver as gold languished this year, battering silver to anomalously-low levels compared to gold by all historical standards. After similar past episodes, silver soared as investors and speculators returned thanks to gold recovering and rekindling interest. Gold’s young new mean-reversion upleg is already driving silver higher.
Even if the silver/gold ratio merely returned to normal-year average levels, and gold stopped rallying, the coming gains in silver will be big. But following anomalous price extremes fueled by sentiment, prices always overshoot towards the opposite extreme. On top of that, gold itself is also mean reverting higher. So silver’s upside from recent months’ incredible anomaly is vast, with great potential for prices to literally multiply.
Adam Hamilton, CPA
October 23, 2015
So how can you profit from this information? We publish an acclaimed monthly newsletter, Zeal Intelligence, that details exactly what we are doing in terms of actual stock and options trading based on all the lessons we have learned in our market research. Please consider joining us each month for tactical trading details and more in our premium Zeal Intelligence service at … www.zealllc.com/subscribe.htm
Questions for Adam? I would be more than happy to address them through my private consulting business. Please visit www.zealllc.com/adam.htm for more information.
Thoughts, comments, or flames? Fire away at zelotes@zealllc.com. Due to my staggering and perpetually increasing e-mail load, I regret that I am not able to respond to comments personally. I will read all messages though and really appreciate your feedback!

-
I know Mike is a very solid investor and respect his opinions very much. So if he says pay attention to this or that - I will.
~ Dale G.
-
I've started managing my own investments so view Michael's site as a one-stop shop from which to get information and perspectives.
~ Dave E.
-
Michael offers easy reading, honest, common sense information that anyone can use in a practical manner.
~ der_al.
-
A sane voice in a scrambled investment world.
~ Ed R.
Inside Edge Pro Contributors

Greg Weldon

Josef Schachter

Tyler Bollhorn

Ryan Irvine

Paul Beattie

Martin Straith

Patrick Ceresna

Mark Leibovit

James Thorne

Victor Adair