
Gold & Precious Metals
Silver Market Update:
Silverbugs have been getting worked up this month about the possibility of a new bullmarket in their favorite white metal, due to its sharp rally in the early days of the month, but as we will see in this update, the long-term charts and latest COTs reveal that there is little real cause for celebration – on the contrary, we should beware of an imminent downturn in silver and more than that, position ourselves to capitalize on it.
If we start with the 6-month chart, we can quickly see what got silverbugs and their cheerleaders stoked, the sharp rally in the early days of the month, which took silver to a 3-month closing high. The problem now is that not only has silver not made any further significant progress since, as it has battled the resistance near to its 200-day moving average, but the Commercials have been aggressively piling on the shorts as we will soon see, and when you see people who are almost always on the right side of the trade, it’s not a bad idea to align yourself with them. Before leaving the 6-month chart we should note that the 50-day moving average is still quite a way below the 200-day, which is not a favorable configuration.

The Commercials certainly don’t look like they are guilty of reckless behavior when we consider silver’s 5-
year chart. As we can see it remains stubbornly locked within a major downtrend, and with recent new lows and its moving averages in bearish alignment, this chart provides little real reason for excitement. What would it take to change the still dismal outlook? – that’s easy to answer, a clear breakout from the long-term downtrend. This is not likely to occur of course unless the dollar index breaks down below the critical 92.50 – 93 support level on the index and drops away, so we will continue to keep a keen eye on that.

The fact that the Commercials are piling on the shorts here, as we can see on the latest COT chart below, of course implies that both gold and silver will drop, which further implies that the dollar will rally away from the danger zone (shown on the dollar index chart in the parallel Gold Market update). “How could the dollar rally recover?” you may well ask, given the Fed’s enormous money printing of recent years which must be inflationary, and which is still coming through the pipe, but don’t forget that this has to be set against a far greater $500 trillion mountain of atrophying trash overhanging the world financial system in the form of a plethora of bonds and derivatives, which is what is really strangling the world economy.

Finally, do not forget that even though the dollar looks like it will recover here to a certain extent, and gold and silver drop, that doesn’t mean it’s “out of the woods” – it could still turn and drop later and crash its key support.

The precious metals sector, after failing to breakdown has enjoyed a strong rally in recent weeks. Gold, Silver and junior gold miners (GDXJ) have reached their 200-day moving averages with senior miners (GDX) close behind. While this is a positive development it does not yet signal that the sector is embarking on a new bull market trend. There are a few things to keep an eye on over the days and weeks to come that can help us determine if a new bull market is taking shape.
While the 200-day moving average (dma) is important, it is not as significant as the 400-dma moving average which does a better job of defining bull and bear markets. Take a look at the chart below and note how the 400-dma has capped the best bear rallies of the past three years. As bulls, we need to see precious metals rally past the 200-dma and reach the 400-dma. Breaking above the 400-dma would confirm a new bull market has begun but merely reaching the 400-dma would be a strong first step.

Gold has gained strength against equities but has yet to fully break resistance and make a new 52-week
high. The Gold/NYSE ratio charted below is consolidating at key trendline resistance and the 400-day moving average. If the stock market begins another leg lower in the weeks or months ahead will Gold go with it or will it buck the trend? The answer to that question is critical to Gold’s medium term prospects.

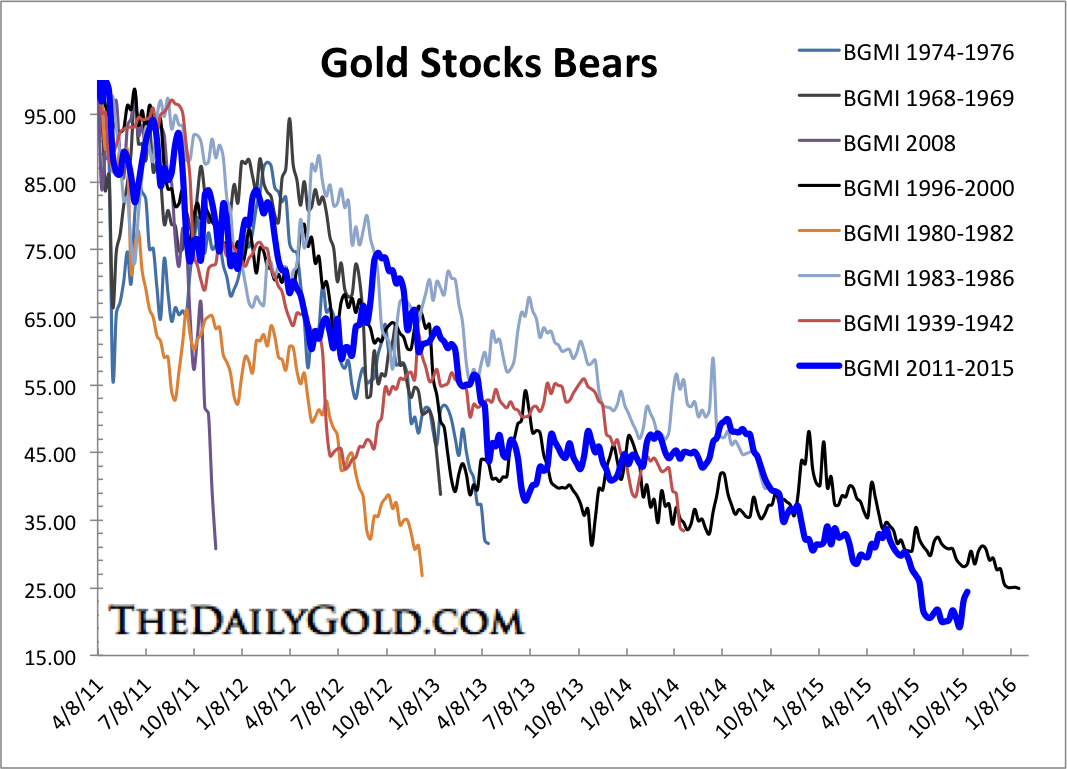
The gold stocks bear analog chart makes a strong case that the mining sector may have reached its low. The current bear market is nearly as long as the 1996 to 2000 bear and in terms of just about every index (BGMI, XAU, GDM) is worse in price. One should also keep in mind that the miners bottomed five months before Gold at the end of that bear.
The precious metals complex has enjoyed a strong rebound to 200-day moving averages but could be due for a pause or correction. We will be watching closely to see if the sector can digest recent gains and consolidate around resistance. The days and weeks to come figure to be very interesting. If the miners have hit a bottom then they should surpass their 200-day moving averages and show increased relative strength within the next month.
Jordan Roy-Byrne, CMT


Dow, Junk Bonds, & US Dollar Video Analysis
Gold, Silver, & Copper Video Analysis
Key Swing Trades Video Analysis
GDX, GDXJ, & Key Gold Stocks Video Analysis
Today’s videos and charts above (double click to enlarge)
Thanks,
Morris
| Friday, Oct 16, 2015 Super Force Signals special offer for Money Talks Readers: Send an email to trading@superforcesignals.com and I’ll send you 3 of my next Super Force Surge Signals free of charge, as I send them to paid subscribers. Thank you! |
The SuperForce Proprietary SURGE index SIGNALS:
25 Surge Index Buy or 25 Surge Index Sell: Solid Power.
50 Surge Index Buy or 50 Surge Index Sell: Stronger Power.
75 Surge Index Buy or 75 Surge Index Sell: Maximum Power.
100 Surge Index Buy or 100 Surge Index Sell: “Over The Top” Power.
Stay alert for our surge signals, sent by email to subscribers, for both the daily charts on Super Force Signals at www.superforcesignals.com and for the 60 minute charts at www.superforce60.com
About Super Force Signals:
Our Surge Index Signals are created thru our proprietary blend of the highest quality technical analysis and many years of successful business building. We are two business owners with excellent synergy. We understand risk and reward. Our subscribers are generally successfully business owners, people like yourself with speculative funds, looking for serious management of your risk and reward in the market.
Frank Johnson: Executive Editor, Macro Risk Manager.
Morris Hubbartt: Chief Market Analyst, Trading Risk Specialist.
website: www.superforcesignals.com
email: trading@superforcesignals.com
email: trading@superforce60.com
SFS Web Services
1170 Bay Street, Suite #143
Toronto, Ontario, M5S 2B4
Canada
The title does not include a (?) after it and that is for a reason. The gold sector’s fundamentals, both sector-specific and macro, are improving and this was not the case during the last exciting upturn in the sector circa summer 2014.
Back then, everything from Russia’s move into Ukraine to the Ebola scare were imagined to be sound drivers of the gold price. This stuff proved, as expected, to be wrong when the whole complex made new lows in November of 2014 (prior to this year’s ultimate lows).
What is driving gold and the gold sector this year? The things that we have been saying for years now would be needed.
- Gold rising vs. commodities: Indicates a counter-cyclical global economic atmosphere (engaged)
- Gold rising vs. stock markets: Indicates an environment in which mainstream investors would be motivated to consider the sector (constructive, not yet engaged)
- Gold rising vs. global currencies: A self-explanatory indicator of waning confidence(constructive+)
- Declining junk/quality bond spreads: Indicates waning confidence in the financial system and those who have propped it up (engaged)
- Economic contraction as presented in mainstream economic data releases (constructive, not yet engaged)
- Treasury yield spreads rise: Indicates risk aversion to systemic stress, whether inflationary or deflationary and waning confidence (10yr-2yr inconclusive as of yet, 30yr-5yr engaging)
There are more details, but the above would paint a picture of a counter-cyclical environment, which is the investment environment for gold and would set quality miners up for a big rally or bull market. Here’s the Macrocosm (July 27) graphic again for a visual representation of the gold sector’s primary fundamental underpinnings.

Dial back to this past summer around the time the Macrocosm shtick was created by someone with
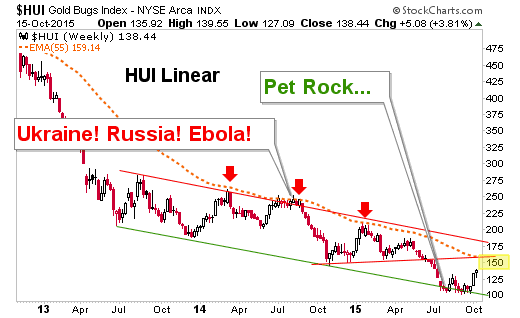
apparently too much time on his hands (not the case, I assure you!). Back then (July 17) the Wall Street Journal called a bottom on gold exactly 1 week before it made its low at 1072: Let’s Be Honest About Gold: It’s a Pet Rock
This was not a bunch of lunatics fighting each other for the right to get on the soap box and rally the troops to buy gold and hide in their bunkers for fear of the Russian horde (that and the Ebola headlines were so contrarian bearish it was palpable). This was a classic bullish contrary indicator and most recently as HUI dropped to the long-term Head & Shoulders target of 100 (101 and change) we watched it scrape along the bottom of its downtrend channel for signs of a bounce, noting that the fundamentals were firming and aided, not hurt by the media this time.
Here is the linear scale chart NFTRH used to gauge this possibility last summer for subscribers, even as log scale charts were put forth on the internet showing a breakdown below the channel for the relatively new cottage industry in gold bearishness to consider. Not this time boyz.
As you can see, it was touch and go at the channel bottom for weeks and I am not going to pretend to have been a resolute gold stock bull during that process. Indeed, hear this clearly… gold stocks are in a bear market, technically speaking. They are technically in a bear market even if they are in a bull market because not even the first technical milestone has been accomplished; nor would or could it be at his juncture.
But again, it is different this time because sector and macro fundamentals are either in line or slowly creeping in the right direction. You probably don’t need me to tell you that there is going to be some turbulence ahead, whether HUI gets to what we are still calling its “bounce” target in the 150’s first or not. But the nature of the sector is much improved from a fundamental standpoint; sector and macro.
The gold sector is on a technical bounce that we have anticipated since mid-summer and managed since September. With sentiment getting over bullish and Commitments of Traders data putting a bulls’ eye on silver lately, the ingredients are in place for a negative reaction. When it comes, whether from the bounce target in the 150’s or somewhere lower, it will pay for players to have their fundamental ducks in a row, unlike in summer 2014.
Many people know me as a chart guy but I am here to tell you that it is the fundamental backdrop that will be for all the marbles. The charts right now, bounce aside, remain in bearish trends for gold stocks (aside from a few little gems bucking the trend), gold and silver. We are following these trends consistently in NFTRH, but just as consistently we are keeping tabs on sector and macro fundamentals, which would lead the technicals just as most of the fundamentals noted above did in Q4 2008, only it was in quick time… like 100x faster than today’s situation.
NFTRH is a value per its peers not only in price (which will see a modest increase before year end), but also in its coverage of technical, fundamental (not company-specific), macro and sentiment/psych analysis across major global markets and chart based trade ideas. I think a subscription is well worth your investment, but then I am biased (because I personally benefit as an investor from doing this work). Check out NFTRH.com for more information and subscriber testimonials.
Bottom line on the article’s main topic, the gold sector is bouncing and this time it has a fundamental right to do so. The sector is in a bear market but the elements are aligning to end the bear. It is time to know what to tune out and what to take in when managing the process. The negative reactions will come and only a clear view considering sector and macro fundamentals andtechnical analysis will define whether and from what levels those are buying opportunities.
Subscribe to NFTRH Premium for your 25-35 page weekly report, interim updates and NFTRH+ chart and trade ideas, or the Free eLetter for an introduction to our work. Or simply keep up to date with plenty of public content at NFTRH.com and Biiwii.com. Oh, and follow @BiiwiiNFTRH.
 While some continue dancing, the music might have already stopped: are we already in a bear market in stocks? In this context, we study past bear markets to see whether gold may serve as a valuable diversifier for what’s ahead.

-
I know Mike is a very solid investor and respect his opinions very much. So if he says pay attention to this or that - I will.
~ Dale G.
-
I've started managing my own investments so view Michael's site as a one-stop shop from which to get information and perspectives.
~ Dave E.
-
Michael offers easy reading, honest, common sense information that anyone can use in a practical manner.
~ der_al.
-
A sane voice in a scrambled investment world.
~ Ed R.
Inside Edge Pro Contributors

Greg Weldon

Josef Schachter

Tyler Bollhorn

Ryan Irvine

Paul Beattie

Martin Straith

Patrick Ceresna

Mark Leibovit

James Thorne

Victor Adair