Gold & Precious Metals

Oct 13, 2015

  1. Is the US dollar still the most important safe haven for fiat enthusiasts? 
  2. For the possible answer, please  click here now. That’s the US dollar versus Japanese yen daily chart. The dollar collapsed in August, as global stock markets suffered a meltdown!
  3. Simply put, the yen acted as a safe haven during the stock market crash, and the dollar acted as a “risk on” asset. The dollar is now trading in a fairly large symmetrical triangle pattern, after breaking a key uptrend line. 
  4. A bearish double top pattern also appears to be in play.
  5. Many large FOREX traders like to buy gold when the dollar falls against the yen. On that note, please  click here now. That’s the daily gold chart, and it looks excellent
  6. A full downside breakout would have targeted the $1000 area, but it didn’t happen. Instead, the move was to the upside. From here, a pullback to the $1130 area is easily possible, given the substantial rally that has occurred. 
  7. That would put gold roughly at the apex of the beautiful triangle pattern. Please  click here now. That’s a snapshot of the latest COT report. The banks are shorting some gold into this rally. Since the release of that report, gold has rallied again, and the banks have likely added a lot more short positions. 
  8. Rather than waste energy trying to determine if the $1070 area is some sort of “ultimate low”, amateur gold investors need to calmly book some light profits into this decent rally, while cheering for higher prices!
  9. From the apex area, a surge to my technical target area of $1250 seems quite attainable, given the fundamental background of weak global equity markets, the PBOC’s new gold buy program, and surging demand in India.
  10. Please  click here now. Double-click to enlarge. I predicted that the Shanghai Gold Exchange would not launch its gold price fix until late in 2015, and Reuters is suggesting that a new SGE chairman may be appointed very soon. 
  11. It appears that the SGE gold fix is roughly on schedule. That’s phenomenal news for all gold enthusiasts. The new fix should help reduce the strange mini-crashes that often occur on the COMEX during the night. 
  12. Gold is probably poised to begin trading with much greater stability and transparency than it has for many years, thanks to the tireless efforts of the entire SGE team. 
  13. Gold-related events in India are also very encouraging. Please  click here now. Dore bar imports and refining are clearly being ramped up in a big way, and several refiners are working hard to become LBMA-certified.
  14. The cold reality of what I call the coming “bull era” is that most Western gold investors, including myself, got into gold for reasons related to the fear trade. 
  15. Ironically, odds are high that love trade demand in Chindia is what ultimately drives gold to prices that enthusiastic fear traders only dream about.
  16. The fear trade will always play a key role in global gold price discovery, and geopolitical events in the Mid-East are the most likely catalyst for the next big price surge. 
  17. The fear trade related to economics may be on the back burner for a while. Once US inflation and government entitlement problems become a serious concern for money managers, it will move to the front burner again. 
  18. I predict that happens in 2017, as Chindian love trade demand begins to overwhelm mine supply. A perfect “gold price storm” to the upside is coming. For all good things, patience is required!
  19. In the meantime, with mine supply roughly unchanged, love trade demand and the PBOC buy program alone, should steadily push gold to higher levels that are sustained. 
  20. Both GDX and GDXJ can likely trade at a new high, with gold only rising to about $1500. There are two reasons why this is possible.
  21. First, most gold mining companies are vastly “leaner and meaner” now, than they were several years ago. Second, steadily rising US inflation with a soft general stock market is highly attractive to large institutional money managers.
  22. For a look at the GDX daily chart, please  click here now. Like gold bullion, gold stocks are overbought in the short term, and eager traders can book light profits now. 
  23. There is an inverse head and shoulders bottom pattern in play, and the great news is that it may be morphing into a bigger one. To look at that possibility, please  click here now. While a shallow pullback is probably preferred by most gold stock enthusiasts, GDX could decline to as low as $14, to carve out the right shoulder of this bullish pattern. 
  24. If all plays out as I’m projecting, this year should end with GDX trading in the $18 to $19 price zone, poised to begin a fabulous year in 2016! 

Oct 13, 2015  
Stewart Thomson  
Graceland Updates
website: www.gracelandupdates.com
email for questions: stewart@gracelandupdates.com 
email to request the free reports: freereports@gracelandupdates.com

Tuesday Oct 13, 2015
Special Offer for Money Talks readers
: Send an email to freereports@gracelandupdates.comand I’ll send you my free “Pullback & Rally Tactics” report. I outline key tactics that I use, to manage financial and emotional issues that occur regularly when investing in 5 key gold stocks, and 5 key silver stocks!

Graceland Updates Subscription Service: Note we are privacy oriented. We accept cheques. And credit cards thru PayPal only on our website. For your protection we don’t see your credit card information. Only PayPal does.

Subscribe via major credit cards at Graceland Updates – or make checks payable to: “Stewart Thomson” Mail to: Stewart Thomson / 1276 Lakeview Drive / Oakville, Ontario L6H 2M8 / Canada

Stewart Thomson is a retired Merrill Lynch broker. Stewart writes the Graceland Updates daily between 4am-7am. They are sent out around 8am. The newsletter is attractively priced and the format is a unique numbered point form; giving clarity to each point and saving valuable reading time.

Risks, Disclaimers, Legal
Stewart Thomson is no longer an investment advisor. The information provided by Stewart and Graceland Updates is for general information purposes only. Before taking any action on any investment, it is imperative that you consult with multiple properly licensed, experienced and qualifed investment advisors and get numerous opinions before taking any action. Your minimum risk on any investment in the world is 100% loss of all your money. You may be taking or preparing to take leveraged positions in investments and not know it, exposing yourself to unlimited risks. This is highly concerning if you are an invetor in any derivatives products. There is an approx $700 trillion OTC Derivatives Iceberg with a tiny portion written off officially. The bottom line:

Bob Hoye: “Precious On, Precious Off”

Precious Metals

Precious on, precious off. It is just one darned thing after another.

The September 17th ChartWorks called for gold to rally to 1145 to 1185 window. From the 1110 level the rise made it to 1156 on Thursday. The September 20th review of the COT number conclude not to look for too much endurance on the rally. (The following is part of Pivotal Events that was published for our subscribers September 29, 2015)

Gold stocks (HUI) popped from 101 to 118. As with the August rally, the declining 50- Day ma ended the move. The 104 to 105 level has provided support five times since early August.

While this level may seem like longer-term resistance, gold stocks have been underperforming relative to the bullion price. Stability is needed.

The key low for GDX/GLD index was 120 on August 24th and the bounce was to the 50- Day at 135. Last week’s low was 122 and today it is at 125. This, with the low of 119 in between, seems constructive.

Let’s call it near-term stability. The declining 50-Day ma has been daunting, but it is beginning to flatten. This indicator rising through the moving average would be a positive step.

Another way of looking at it is through the GDX/SPX. This index has plunged from 572 in 2011 to 62 in early August. The rebound high was 82 and the next low was 64 in the middle of September. The last decline found support at the 50-Day and this week’s trade is above the line. The moving average is beginning to flatten, which is constructive.

At 72, rising above 75 would be positive. 

bh1

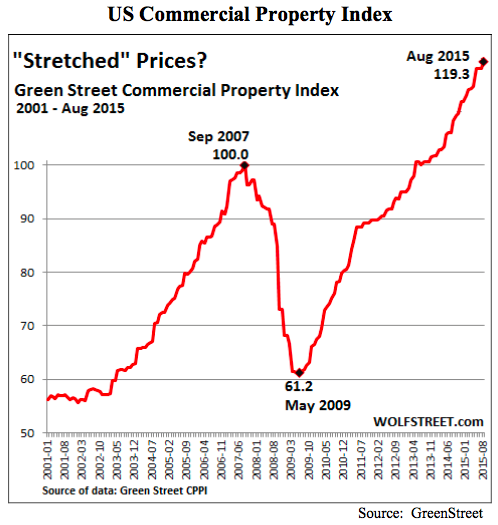
  • Commodity bulls have been expecting a “Super Cycle”.
  • It seems to have appeared in commercial property.
  • How long will it last? 

bh2

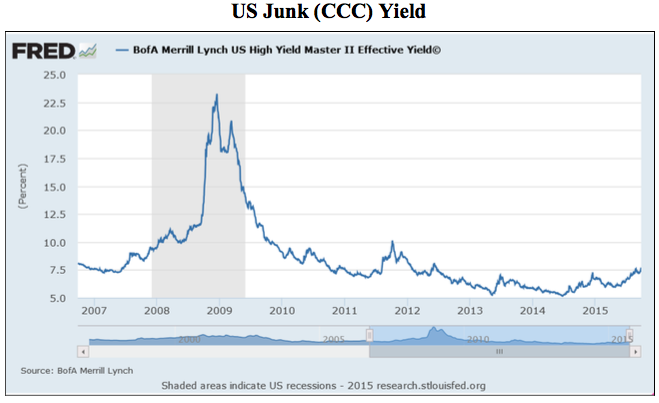
  • The simple view is that the trend of rising yields has accomplished the second breakout from a cyclical low.
  • This could be equivalent to the second breakout accomplished at 9.22% on November 16, 2007. Some three weeks after the high for the S&P.
  • This breakout was set at 7.71% on Friday. It is now at 7.98%.
  • The high on the last crisis was 23.26% set on December 15, 2008. 

bh3

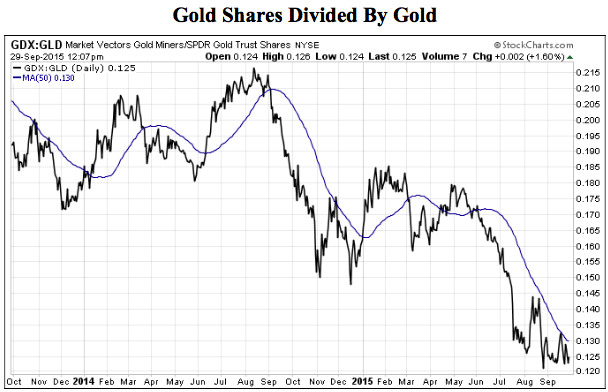
  • Rising through the 50-Day moving average has been positive for the sector.
  • The index is at 126, the 50-Day is flattening at 130.
  • This is constructive, but not yet positive.


Link to September 29, 2015 Bob Hoye interview on TalkDigitalNetwork.com:

http://talkdigitalnetwork.com/2015/10/credit-spreads-becoming-dramatic/


BOB HOYE, INSTITUTIONAL ADVISORS

E-MAIL bhoye.institutionaladvisors@telus.net

WEBSITE: www.institutionaladvisors.com

Listen to the Bob Hoye Podcast every Friday afternoon at TalkDigitalNetwork.com 

SWOT Analysis: Will Gold Finish 2015 With a Gain?

Strengths

  • Platinum was the best performing precious metal, bouncing back 7.95 percent, as palladium took a backseat this week. Traders had speculated that the Volkswagen’s emissions scandal might lead to increased demand for palladium should auto buyers shun diesel powered vehicles in favor of autos powered by gasoline engines that use more palladium in their catalytic converters.
  • Gold traders are the most bullish in three weeks on expectations that the Fed will hold off from raising interest rates until next year. The weak employment report last week ignited the recent rally which was buoyed this week by the release of the Fed’s September FOMC meeting notes which had a dovish tone. Gold advanced to a six-week high. 
  • China may have further increased central bank gold holdings in September, raising them by about 15 metric tons to 1,709 tons, as it seeks to diversify its foreign exchange reserves. China announced increases of about 19 tons for July and 16 tons for August after disclosing on July 17 that holdings had jumped by 57 percent since 2009. China has been reporting the value and tonnage of gold reserves monthly in a shift toward greater transparency as it promotes the global role of the yuan and seeks to join the IMF’s currency basket. Another recent positive aspect has been the signs of strength in the gold market even in the absence of Chinese physical demand with the markets closed there for the 7-day Autumn Golden Week holiday.

Weaknesses

  • Despite this week perhaps being a turning point for gold, it rose the least out of all the precious metals. Perhaps the week long holiday in China may have kept some buyers from bidding the market up higher.
  • Kinross Gold announced it is under investigation in the U.S. by the SEC and the Department of Justice about improper payments at West African facilities involving allegations that first arose in 2013 and the company was already investigating. The company received subpoenas requesting records of communications and payments to officials and contractors at the miner’s operations in Mauritania and Ghana.
  • Cornerstone Macro’s Carter Worth sees gold rising as weakness stopped “almost precisely” at the 50 percent retracement of the rally from $257/oz in 2001 to $1,920 in 2011. For stocks overall, he rejects the idea that the S&P 500 has successfully retested the August low. He said overall equities are under duress and headed lower given 44 percent of stocks in the S&P 500 have undercut their August 24 lows even though the index has not.

Opportunities

10-12fh

  • The recent uptrend in gold could mean a positive full-year return by year end. According to Capital Economics, the headwinds for gold could be behind us, pointing to tighter labor markets and perhaps even inflation. Their report notes that inflation should snap back in most economies over the next few months as the big falls in oil prices in late 2014 drop out of the annual comparison. Their 2016 year end forecast is $1,400/oz.
  • Klondex provided an update on its Midas exploration drill program with notable intersections of multi-ounce per ton grades. Interestingly, within the results was a non-vein intercept of 115 feet with an average grade of 2.3 g/t. This drilling has revealed a very different style of mineralization south of the Midas bonanza veins that have been mined to date. The new area is highly oxidized and while the grade is lower than at other drill locations, the breadth of the intersection creates the potential for substantial quantities of bulk ore to be mined should there be a surface scenario such as an open pit.
  • Comstock Mining reported significant drill intercepts at its Dayton Resource Area. The program, which consisted of 408 holes totaling 30,818 feet of drilling, resulted in several important discoveries, including defining multiple, previously undefined mineralized zones and additional dike-like masses of quartz porphyry. Separately, Integra Gold announced the discovery of new gold bearing zones at Lamaque South, including 22.64 g/t over 2.59 meters at No. 6 vein. This should further pique the interest of Eldorado Gold which recently purchased nearly 15 percent of the company.

Threats

  • According to Ruchir Sharma, who helps manage $25 billion as head of emerging markets at Morgan Stanley Investment Management, investors need to brace for a “long winter” with the commodities bear market predicted to last for many years and oil dropping to as low as $35 per barrel. Goldman Sachs has an even dimmer outlook. They said the odds are increasing that oil will slump near $20 because the market is more oversupplied than initially forecast. The investment bank also said prices could stay low for as long as 15 years.
  • Gold imports by India, the world’s second-biggest consumer, dropped 52 percent last month after shipments had surged in August. Shipments jumped in August as jewelers stocked up to meet a surge in demand during the festival and wedding season that started this month. The lack of investment demand is a cause for concern given the negative sentiment towards the asset class.
  • The Environmental Protection Agency appears to have rushed to judgment when it decided to preemptively block a proposed mine from being built near Alaska’s Bristol Bay, according to a yearlong review of the case by former Defense Secretary William Cohen. Cohen noted that the agency was “not fair” in its decision to rule out gold mining in the region before the developers had even applied for permits to build the mine.


http://www.usfunds.com/

Dollar Danger & Gold Bull Wedge

death cross

Gold & Silver Bullion Bull Wedge Video Analysis

Dow & Dollar Danger Video Analysis

GDX, GDXJ, & SIL Bottoming Action Video Analysis

Key Swing Trades Video Analysis

Key Individual Junior Gold & Silver Stocks Video Analysis

Above are today’s videos and charts (double click to enlarge):

Thanks, 

Morris

Friday, Oct 9, 2015 Super Force Signals special offer for Money Talks Readers:
Send an email to trading@superforcesignals.com and I’ll send you 3 of my next Super Force Surge Signals free of charge, as I send them to paid subscribers. Thank you!

The SuperForce Proprietary SURGE index SIGNALS:

25 Surge Index Buy or 25 Surge Index Sell: Solid Power.
50 Surge Index Buy or 50 Surge Index Sell: Stronger Power.
75 Surge Index Buy or 75 Surge Index Sell: Maximum Power.
100 Surge Index Buy or 100 Surge Index Sell: “Over The Top” Power.

Stay alert for our surge signals, sent by email to subscribers, for both the daily charts on Super Force Signals at www.superforcesignals.com and for the 60 minute charts at www.superforce60.com

About Super Force Signals:
Our Surge Index Signals are created thru our proprietary blend of the highest quality technical analysis and many years of successful business building. We are two business owners with excellent synergy. We understand risk and reward. Our subscribers are generally successfully business owners, people like yourself with speculative funds, looking for serious management of your risk and reward in the market.

Frank Johnson: Executive Editor, Macro Risk Manager.
Morris Hubbartt: Chief Market Analyst, Trading Risk Specialist.

website: www.superforcesignals.com
email: trading@superforcesignals.com
email: trading@superforce60.com 

SFS Web Services
1170 Bay Street, Suite #143
Toronto, Ontario, M5S 2B4
Canada 

###

Oct 9, 2015
Morris Hubbartt

First published Sat Oct 3 for members :  Since 2011, it has been quite clear that the metals have been in a downtrend, while equity markets have been in an uptrend.  But, over the last several months, I have mentioned in our Trading Room that I think we may see a paradigm shift soon, as I believe that they may begin to rally together as the stock market moves up in its next rally phase over 2300.  So, I have been looking for clues that such alignment may be developing.  This past week may have provided additional clues and the upcoming two weeks may solidify this new paradigm.

As many of you know, I still think that there is a strong likelihood that the equity markets see lower lows in the coming weeks.  And, as many of you also know, I still think there is a strong likelihood that the metals markets see lower lows in the coming weeks.  And, the upcoming week could align the two.

This past week, I noted the short set up that the metals were presenting.  So, while we caught the top of the move on Thursday, and then expected a rally off Thursday’s low, the rally was more than I had expected, and invalidated the immediate short set up.   Does that mean that lower lows will not be seen?  No, as I still believe lower lows will be seen.  But, it does open the door yet again to a bigger corrective rally to be seen in the upcoming week.

And, along with the corrective rally we are now seeing, it seems to have aligned with the corrective rally we have been expecting in the equity markets.  Moreover, if both the equity market and the metals market continue in this corrective rally over the next week, or even if both break support in the upcoming week, it seems that both will be setting up for declines which will take them to new lows within their respective corrections that can be completed over the next 6 weeks.  This would then set them up to begin to rally in unison for some time.

At this point in time, this is only a theory.  Clearly, I will need to see how the market develops over the upcoming week to have a much better idea as to whether this will, in fact, occur.  But, the set up for such alignment is clearly in place.  And, if we are to see follow through in these set ups, then it will likely take most by surprise as the common perspective is that they move inversely.  For this reason, I am simply laying the ground work to prepare you for this potential should we see confirmation in the next few weeks so that you are not caught flat footed, as the rest of the market is left scratching their head.

I want to digress a moment, and thank all of you who have written in as we were celebrating our 4thanniversary.  We have received many posts and emails congratulating us and telling us that we have been the most accurate source of analysis for the metals and miners for the 4 years since we have been open.  We truly appreciate the support. 

But, I think I may be disappointing most of you this weekend.  But, I would like to quote Robert Prechter to explain why:

Of course, there are often times when, despite a rigorous analysis, there is no clearly preferred interpretation.  At such times, you must wait until the count resolves itself.  When after a while the apparent jumble gels into a clear picture, the probability that a turning point is at hand can suddenly and excitingly rise to nearly 100%.

Right now, I am about 50/50 as to whether this move higher will continue in the metals and miners, but have no set up in place to go net short.  Therefore, as of my writing this update, I remain net long.

As far as the wave structures are concerned, the GDX is truly in between two counts.  As you can see, as long as we now remain below 14.71, the blue count to take us down to lower lows sooner rather than later is still on the table.  A break out over 14.71 puts us squarely focused on the blue box for the purple count.  And, until we see the next i-ii downside structure, or see a completed upside pattern into the blue box, I will not be adding any further short side trades. 

The GLD presents rather similarly to the GDX.  As long as it remains below 110.82, the immediate downside set up is in place, but a move through it has us targeting the blue box overhead.

Silver is not much different than its brethren.  Resistance stands at 15.43, followed by 15.85-91.  Through secondary resistance, it can move up as high as 17.  And, as with the others, after being stopped out of my short with a small profit, I will not be looking down until the next 1-2 downside structure is in place.

I know that we have all been waiting quite patiently for the final lows to be struck in this correction, which has continued for over four years now.  But, several weeks ago, for the first time in 4 years, the miners and the metals moved into our target boxes set years ago.  So, I have been a net buyer of metals and miners, and will continue to do so on further declines.  (In fact, I am currently net long, and have no reason to change that position until I see the next i-ii structure set up to the downside). 

Due to the significant potential I see over the long term in this sector, most long term investors should now be focused on the long side of this market if you are serious about the long term prospects.  To me, personally, I only view any further declines as a buying opportunity and have no interest in trading further downside heavily. While I will still hedge my long term positions when the market sets up for further downside, and may even go net short depending upon the particular set up, in my humble opinion, the time for aggressively shorting this market has passed.      

Finally, the question I am constantly asked is what will convince me to consider that the bottom has already been struck.  Well, if the GLD were to complete a full 5 waves up to 122 or higher, then I would have to strongly consider that a bottom has been struck, and a pullback into the 110-115 region should be bought.  Until such time, I am still looking for one final wash out.

See charts illustrating the wave counts on the GLD, GDX and YI at https://www.elliottwavetrader.net/scharts/Charts-on-GDX-GLD-and-YI-20151004847.html.

Avi Gilburt is a widely followed Elliott Wave technical analyst and author of ElliottWaveTrader.net (www.elliottwavetrader.net), a live Trading Room featuring his intraday market analysis (including emini S&P 500, metals, oil, USD & VXX), interactive member-analyst forum, and detailed library of Elliott Wave education.