
Gold & Precious Metals
The leveraged gold futures derivatives market is knocking down the precious metal, yet in massive contrast, this drop has ignited a shopping frenzy according to gold coin dealers. I spoke with several friends and industry experts last week who confirmed the record sales numbers for the month. In fact, American Gold Eagle sales reached 161,500 ounces in July, the highest monthly figure since April 2013. What gives?
Gold often attracts conspiracy theories when it falls so abruptly, especially on Mondays. Interestingly, in a recent article on Zero Hedge, ABC Bullion out of Sydney, Australia, details some of the speculation behind the precious metal’s beatdown, which I’ve also discussed in my blog.
Price manipulation, or a “bear raid,” could be a factor. Two weeks ago, gold prices experienced a mini “flash crash”—the first one in 18 months—after five tonnes of the metal appeared on the Shanghai market. Whether front-running or fat fingers are to blame, the sell order for what many are calling a bear raid was initially thought to have originated in China, but we now believe it came from New York City.
Did investors anticipate China’s negative flash purchasing managers’ index (PMI) last week? China is the largest consumer of gold, and the PMI is a useful leading indicator of commodities demand as well as job growth.
What about the Greek crisis? This type of debt fear crisis often has the effect of boosting the price of gold, but we didn’t see that happen. Did European central banks sell gold down to dampen the psychological impact of the event? Understating the seriousness of the debt crisis may have prevented investors from seeking gold as protection.
Conspiracy theories or not, I believe none of this tarnishes gold’s sustainable allure. It’s important to look at the two key demand drivers for gold: the Fear Trade and the Love Trade. The Fear Trade is related to money supply and negative real interest rates. The Love Trade comes from the purchase of gold due to cultural affinity and the rising GDP per capita in Asia and the Middle East.
I’ve always advocated, and continue to advocate, a 10 percent weighting: 5 percent in gold stocks and 5 percent in bullion, then rebalance every year.
From Crisis to Opportunity
Take a look at the chart, which shows that the bearish trend is obvious.

And yet many investors are still buying. In an interview last week with Money Metals Exchange and in talking to Bart Kitner, founder of Kitco, both conversations confirmed that smart investors are enthusiastically buying gold during this downdraft in prices.
Rational Investors Know a Deal When They See One, and Feel One
 With so much gloom and doom in the media surrounding gold right now, you might wonder why coin sales are soaring at multiyear highs. The reason is pretty simple: Gold is on sale.
High net worth individuals and other savvy investors realize that even now, as herds of people are rushing for the exit, owning gold is one of the best ways to manage systemic risk. They follow that Greeks had their cash in banks frozen as it was in Cyprus only a few years ago.
Ray Dalio, founder of Bridgewater Associates, said it best: “If you don’t own gold, you know neither history nor economics.”
Indeed, some investors fail to take a long-term perspective on gold. Their sentiment toward the metal extends only as far back as the most recent selloff, induced by the strong U.S. dollar, weak global manufacturing activityand fears that interest rates will soon rise.
Many investors have that “sinking feeling” with a deterioration in global PMI, leading economic indicators, falling commodity prices and the threat of rising U.S. interest rates. Many have raised their cash levels due to decelerating global growth prospects. I’ve written that bad news is good news because when governments accelerate monetary policy, this can be a good opportunity for investors to add to their gold exposure.
 I’m not the only one who takes this position. Besides the investors gobbling up American Gold Eagles, central banks around the world continue to buy, hold and repatriate bullion. The U.S. Federal Reserve maintains its 8,133 tonnes, the most of any central bank. Germany, the Netherlands and other countries have brought home mounds of the yellow metal in the last 12 months. China has increased its reserves 60 percent in the last six years. And Texas is in the early stages of establishing its own gold depository, the first state to do so. If there were no faith left in the metal, why would banks even bother with it?
At the same time, massive amounts of paper money are still being printed. In fact, the International Monetary Fund has asked the Bank of Japan to be ready to increase its monetary stimulus further, according to Bloomberg. Let the paper printing roll! In the U.S., where quantitative easing was supposed to have ended back in October, the Fed’s balance sheet is still within 0.3 percent of its all-time high, according to Sovereign Man.
Based on Historical Volatility Models Gold Is Extremely Oversold
Before the bottom fell out, gold’s support seemed to have been around $1,150, whereas the resistance trend line was breaking down. The descending triangle pattern, seen below, indicates that demand was weakening and downside momentum was gathering force.

A useful tool that traders and analysts use is Bloomberg’s relative strength indicator (RSI). Below is gold’s RSI over the same one-year period. It shows that gold has passed below the 30 mark into oversold territory. When this happens, many analysts see it as a buying opportunity. Between November 3—the last time gold fell this significantly below 30—and January 20, the yellow metal ended up rallying 13 percent.

A similar tool we use to identify buy and sell signals is the price oscillator, which I often explain while speaking at conferences. This tool measures how many standard deviations an asset’s value has moved from its mean (and in which direction). When the number crosses above two standard deviations, it’s often interpreted as an opportunity to take some profits, and when it crosses below negative two, it might be a good time to think about accumulating.

Love Trade and Fear Trade: Gold’s Tailwinds and Headwinds
 I always look at two demand factors for gold, the Fear Trade and the Love Trade. The Love Trade is the purchase of gold for weddings, anniversaries and cultural celebrations while the Fear Trade is gold’s reaction to monetary and fiscal policies, particularly real interest rates.
Historically, the Love Trade has been on the upswing starting around this time—late July and early August—in anticipation of international festivals and holidays such as Diwali, Christmas and the Chinese New Year. But as you can see in the oscillator chart above, gold is down 1.4 standard deviations for the 10-year period. This suggests gold may be at an attractive level to accumulate, and gold stocks can offer greater Beta when gold begins to revert to its mean.
The Fear Trade, on the other hand, involves the Fear Trade and real interest rates (inflation – CPI = real interest rates). Several times in the past I’ve explained how gold tends to benefit when real interest rates turn negative. When the rate of inflation exceeds the yield on a five-year Treasury note, it makes gold much more attractive to many investors.
At this time, the five-year Treasury yield sits at 1.58 percent while inflation is crawling along at 0.1 percent. This means that real rates are a positive 1.48 percent—a headwind for gold. As I told Daniela Cambone during last week’s Gold Game Film, the U.S. has some of the highest real rates of return in the world right now.
To see gold gain traction again, not only do we need to see negative real interest rates in the U.S. we need to see rising real GDP per capita in China and rising PMI in China.
On a final note, there appears to be a battle between the debt markets and equity markets. The debt market yields suggest rates will not be rising next month or quarter, while equity markets suggest they will. I think the bond market is more accurate. With a struggling global economy and commodity deflation odds favor rates will not rise soon in America, and gold will revert back to the mean.
![]()
###
 Aug 3, 2015
Frank Holmes
website: www.usfunds.com


The month of July has seen the most intense demand for physical gold and silver since April of 2013, setting numerous records for the year. On the heels of the spectacular drop in spot prices, buyers of physical metal have come out in droves. In fact, available supply is hardly able to keep up with the demand for immediate delivery of metals.
This betrays a fundamental reality about the market for physical gold and silver bullion that many investors – even regular buyers of bullion – are not aware of. There simply is not much supply available at any given time. In other words, gold and silver products spend very little time sitting on the shelf waiting to get bought, making inventory very tight. As such, in times of intense demand, the entire available supply can be bought up in a matter of weeks, or even days. This results in higher product premiums and extended shipping times.
This is exactly where the market is for physical metals is right now. Consider what has happened in just the last couple of weeks.
Major Mints Are Now on Allocation for Products
When a major mint like the United States Mint or the Royal Canadian Mint (RCM) goes on allocation, they are limiting the amount of product authorized purchasers can buy and when they can buy it. Simply stated, it means there is less available supply until the Mint ceases its allocation or increases it. This translates into extended shipping timelines for allocated products. Large dealers are still able to lock in orders for clients, but the product will not ship until that allocation from the issuing mint first arrives at their vault.
The US Mint suspended Silver Eagles sales for three weeks in July. When production resumed earlier this week, the Mint sold more than 2.5 million Silver Eagles in two days. The Mint now reports more than 5.3 million sold in all of July. With two days left in the month, this figure could end up topping January’s sales of 5.5 million. The Mint is now allocating product with regular shipments.
Even bigger news is that the RCM has gone on allocation for silver and gold. While silver products have been on allocation several times in recent years, the last time gold products were on allocation from a major national mint was during the 2007-2008 financial crisis. During that time, investors had to wait a month or more before receiving product. (Silver shipments took much longer, averaging around two to three months or more.) These are roughly the same dynamics we are witnessing currently from the RCM. For the first time in over eight years, investors who want to buy a highly marketable gold product – the Gold Canadian Maple Leaf– may have to wait a month or more to receive it. The importance of this event should not go overlooked.
Significant Rise in Product Premiums
Strong demand for physical metals also results in higher premiums on popular products, such as nationally minted coins. Typically, products that are most backordered and delayed are also the products selling at a much higher premium. This has been the case nearly every single time major mints have gone on allocation. It’s similar to a spike in gasoline prices at the pump when a hurricane or natural disaster disrupts the supply of fuel. The charts below demonstrate this reality with respect to two popular silver products, the 1-ounce Silver Eagle and 90% “junk” silver.
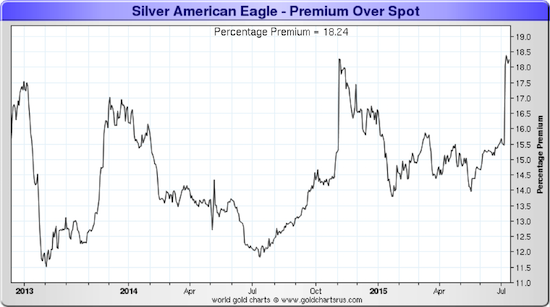
The premium on Silver Eagles is now as high as it was when silver made its multiyear low last November.
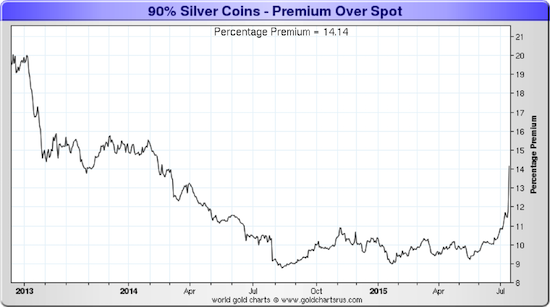
90% junk silver is particularly sensitive to premium increases, since it is no longer produced.
Conclusion: Caveat Emptor
The most important take away from all this is that it really doesn’t take much extra demand to wipe out the “on the shelf” supply of physical precious metals.
Keep in mind that a large percentage of physical metal buyers have no intentions to sell. This means that during the next big wave of demand, there will be that much less available metal to market. Read our recently released special report, , to learn more about this market undercurrent.
Remember – this surge in demand can come whether the price moves up or down in dollar terms. It was a $48 move downward in the price of gold that triggered the extra demand this month. If the move is $98 upwards, the same thing could occur as investors scramble to get in on the ground level of a new bull market. In fact, such a surge in price could be even worse for the supply picture, as people may begin to wake up to the inherent problems of our current monetary system.
Dickson Buchanan Jr. is the Director of International Development and a Senior Precious Metals Specialist at SchiffGold. He holds an MA in Economics from King Juan Carlos University and regularly contributes commentary and analysis on gold and financial markets. You can contact him directly at 888.465.3160 ext. 112.
On its 6-month chart we can see that, like gold, silver put in a fine bull hammer on Friday on good volume, and this, along with evidence elsewhere across the sector, suggests that a short-term rally is in the offing, even if the outlook remains bleak over the longer-term. Silver is a trading buy here with a stop beneath Friday’s intraday low.

The 1-year chart is more interesting and shows that, while gold crashed an important support level, silver did not – it did not break below the support at its intraday low during a day of wild trading late at the end of November – beginning of December. It is oversold and at the support near this low, so at a good point for a relief rally to develop, although we should not lose sight of the bearish alignment of its moving averages which we can expect to act as a restraining on any rally in the near future.

The long-term 8-year chart shows that silver remains stuck in a bearmarket with a “staircase” decline in effect within a persistent downtrend. While the latest COTs certainly look encouraging, the fact of the matter is that this downtrend remains in force and it will take a clear break out of it to change this situation. On this chart we can gauge the magnitude of any short-term rally, which if it carries to the upper boundary of the downtrend, as COTs and other factors suggest is likely, would see the price ascend to the $17 area before turning lower again, with a possible scenario shown on the chart. If the support near last year’s lows is eventually breached, then another severe downleg will be in prospect as shown.

Silver’s latest COT looks bullish here, at least for the near-term, for as we can see the Commercials have scaled back their shorts to a low level, while the Large Specs have given up and “thrown in the towel” and now have their lowest holdings for a long time, possibly years. There is nothing to say, however, that in the future we won’t have a situation where the Commercials are routinely long and the Large Specs short, if this bearmarket continues.

Click on chart to popup a larger clearer version.
The longer-term Silver Hedgers chart likewise looks bullish. This chart also reveals the huge reduction in Commercial short positions in recent weeks. As we can see, readings at these levels have typically preceded rallies in the past.

Click on chart to popup a larger clearer version.
Chart courtesy of www.sentimentrader.com
Lastly the Silver Optix, or optimism index, shows a low level of optimism towards silver that has also typically preceded rallies in the past.

Click on chart to popup a larger clearer version.
Chart courtesy of www.sentimentrader.com
Both these sentimentrader charts go back to early 2011, in order to show the entire period from the bullmarket high of April – May 2011.
Finally, the chart for Coeur D’Alene Mines shown below provides circumstantial evidence that at least a short-term bottom is in, as it shows an accelerating decline into a low, where at an oversold extreme a fine large bull hammer appeared on the chart on heavy volume on Friday. A possible scenario from here has been drawn on the chart, which shouldn’t be taken too literally. Traders may consider going long CDE with a stop beneath Friday’s intraday low, with the aim of exiting the position on a rally and perhaps then reversing to short again.

End of update.

-
I know Mike is a very solid investor and respect his opinions very much. So if he says pay attention to this or that - I will.
~ Dale G.
-
I've started managing my own investments so view Michael's site as a one-stop shop from which to get information and perspectives.
~ Dave E.
-
Michael offers easy reading, honest, common sense information that anyone can use in a practical manner.
~ der_al.
-
A sane voice in a scrambled investment world.
~ Ed R.
Inside Edge Pro Contributors

Greg Weldon

Josef Schachter

Tyler Bollhorn

Ryan Irvine

Paul Beattie

Martin Straith

Patrick Ceresna

Mark Leibovit

James Thorne

Victor Adair