
Gold & Precious Metals
Third Phase – “The third phase of a bear market is the “throw ‘em in” phase where stocks are sold for no other reason than that the sellers need to raise cash.” – Richard Russell
The Strategy (pt 3)
Over 2 years ago I presented my first analysis of this precious metals bear market. After extensive study of the characteristics of past bear markets , I forecast a brutal bear market that would undergo three psychological stages. The third stage would be a wrenching decline that would ultimately reach levels so shocking that it would cause the destruction of the gold investment class. My analysis, which was dubbed Plunger’s Flush , was met not just with skepticism but outright derision. I believe I know how Galileo felt.
Two years hence , this analysis has proven it’s self . We have now entered into phase III of a bear market, where held at bay for four years the bear will now have its way with the Precious Metals. He will now perform his function of clearing out the accumulated malinvestment built up in the preceding 10 year bull market. At the time I presented my first analysis it was not polite to use the word “Bear Market” as consensus belief still regarded the bull to be active. The market was considered to be in a pullback in an ongoing bull market. Therefore my forecast of a crushing decline was met with universal skepticism and ridicule. Investor sentiment was not prepared to accept the reality that the sun had set on the bull market and a full course bear market lay ahead. My forecast was derived from my study of the process of development of bull and bear markets. I see little understanding of this area among the analysts who populate the gold market sector. Instead fervent believers of the gold narrative seem to dominate the landscape.
As a review, I recommend reading my academic study on major bear markets since these principles apply to our current bear market in the precious metals.
http://goldtadise.com/?p=342366
Also, if you have not read my pieces defining the phases of a bear market I recommend viewing them here:
http://goldtadise.com/?p=342331
http://goldtadise.com/?p=342347
Recent market developments provide full vindication of the bearish forecasts made over the past 2 years. I will now provide an update on the progress of this precious metals bear market and describe the model I use. Below is a big picture view of the past four years and how I have interpreted it.
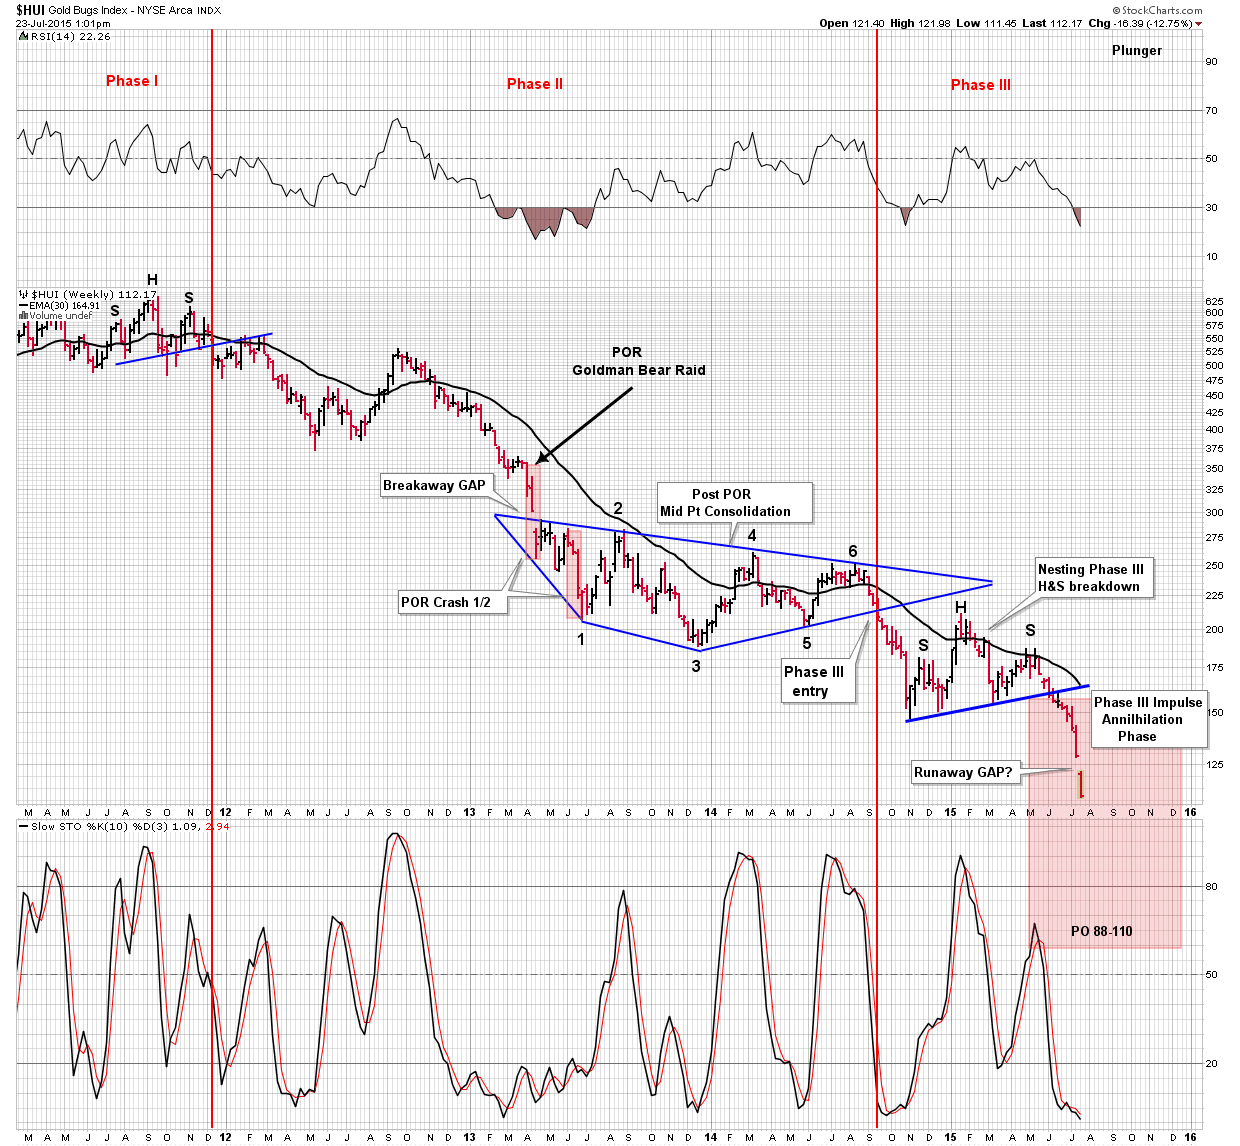
The above chart depicts the major events which define this bear market. It has been classified into three psychological phases which are
defined by the price action. After the phase I distribution top was completed in December 2011 the market entered into a prolonged phase II decline lasting another 2.5 years. Phase II developed in classic form, as once it completed the back test of the neck line of the phase I H&S it entered into a long slide. This slide ended with a sharp bear market rally (BMR) in the summer of 2012. This rally served to reinvigorate the bullish crowd and keep them believing that the bull market was still on and it had all been a corrective move. After the BMR exhausted itself the market entered into a prolonged phase II decline into the spring of 2013. I recall investor psychology at this time as being stressed, yet still optimistic that the bull would resume, the prevailing term used to describe it was “ its a correction”. This all ended with the Goldman raid on the gold market in April 2013. The 19 month slide had eroded investor sentiment to the point that they were now primed for a collective change of perception. With the crash, bullish hopes were now abandoned and it was recognized as a bear market. The classic point of recognition (POR) had arrived. The bear market process places the POR squarely in phase II….Always.
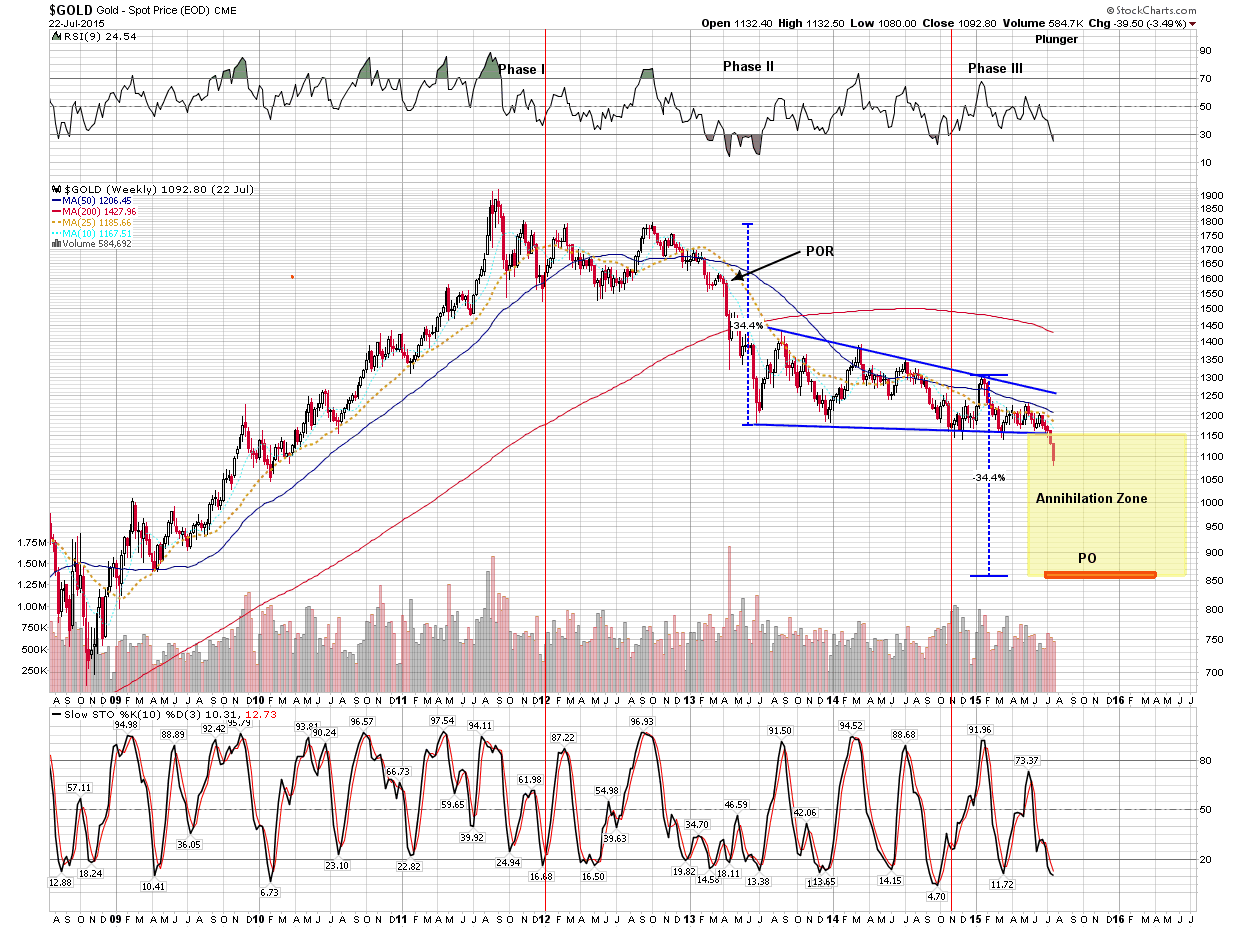
What occurs after the POR is a period of prolonged consolidation. A deceptive tug of war between bulls and bears ensues made up of several BMRs which serve to ultimately exhaust the bulls. Once this process runs its course, the market is now cleared to exit phase II and stocks can now fall of their own weight. This process of bull exhaustion took 18 months when it finally completed its post POR diamond consolidation in October 2014 and entered phase III. The 18 month diamond formation lasted such a long time likely because stubborn gold bulls refused to give up the dream of a bull market, instead expending their energy chasing apparent bear market bottoms. It is interesting to note that the ursa bear of 1932 and the Nikkei bear of 1991 both ended their post POR consolidations with a diamond formation.
After the diamond formation breakdown of October 2014 the market was now in phase III. By definition when a market breaks down out of its post POR consolidation it then enters phase III. Normally, a downward impulse drives the price to its ultimate bottom and the bear is then over. This bear however, was peculiar because instead of an immediate downward impulse the index chose to go into nesting mode for the next 7 months. During this interval it build out a deceptive H&S pattern just beneath the phase II diamond consolidation pattern. I suspect this was again caused by die hard gold bulls still clinging to hope that a bottom was being formed. Their error was not understanding that all phases of a bear market had not yet completed. In fact, phase III was just getting started and now the end game process is just kicking off. With the June break of the nesting H&S neckline, the phase III downward impulse has finally begun. We are now in the dreaded annihilation phase which I have described in previous essays. The annihilation comes from the markets “no one gets out alive” liquidation.
Over the past four years the bear has been restrained by stubborn bulls. Those bulls are now exhausted and the bear will now have his way with this market. The blind capital of the great unwashed will now be devoured. The bear will end when the worse that can happen has been discounted by the price structure. The junior and mid-tiers have long been destroyed, now the bear will focus on the big cap stocks, where the liquidity remains. Bulls will sell their good stocks held for a rainy day, because it’s raining. It has been rather tragic watching the majority of PM analysts lead there followers to slaughter, because it has been unnecessary. What the majority of investors have not grasped is that a bear market is a process. A process that must progress through various stages of price action and investor psychology. This is what I have attempted to describe over the past two years.
There are several principles at play here. Once a declining market encounters a POR, you know a bear market is active and it’s not just a correction. All calls for a bottom are now invalid until the market enters into an identifiable phase III. Bull signals are now only valid in a phase III. Once in phase III, the market will undergo a cathartic selling event and volume will then begin to recede on subsequent declines. Prior to this any attempt at a bottom will fail and prove to be false until this process completes. So now we wait and observe the bear do his destructive work. We will watch the language of the market to identify its ultimate bottom. Serious money is made identifying the probability of a bear market low, not by buying apparent bear market bottoms.
The bear has not yet finished his work, the ultimate bottom will prove to be so shocking that it will devastate a generation of old school gold bulls. But, it will allow the foundation for the next bull market in the precious metals. This will be my final essay devoted to the great precious metals bear market. We have fought the good fight, we have survived four years of decline, we have properly identified the trends and market phases. We have been wise enough to know when to step aside. We have arrived near the bottom with both emotional and physical capital intact. We will be there to deploy at the bottom. It is time for us to focus on the upcoming epic bull market that will soon unfold in the usual deceptive manner . Join me and other like minded PM Traders at Rambus Chartology for the ride.
Plunger

Gold prices crashed Monday as panicked sellers drove the yellow metal to its lowest level since 2002 before recovering to a five-year low. More significantly, they broke the $1,130/oz. “floor,” which had previously been regarded as a solid support level – a key indicator to me that the downdraft wasn’t over.
So I wasn’t surprised to see gold prices finish yesterday’s U.S. trading session modestly lower – but that doesn’t mean I was any less excited, either.
You’re seeing an enormous opportunity being brought forth by the perfect storm of economic and financial events. Some of these events we’ve known were coming, and some are seemingly random.
Either way, they’re creating an opening you haven’t had access to in years.
Here’s what you need to know about what really caused gold’s plunge this week – and the opportunity no one can know when you’ll have again.
The Most Effective Attack
on Gold Prices in Years
Last Monday, traders sold an estimated 33 tonnes of gold in less than two minutes on the New York and Shanghai Exchanges. Their concerted actions sent gold prices crashing by nearly $50/oz. by the end of the day, a plunge of almost 5%.
Contrary to what many believe, this was not simply “market action” taking its normal course. This was something far more sinister, concerted, and brilliantly executed – a “bear raid.”
If you’ve just joined us, a bear raid is a highly technical tactic typically used by large institutional traders or “short and distort” artists. The goal is to create windfall profits though short sales, options, futures contracts, currencies, and whatever else can be brought to bear.
If it works, the targeted stock, bond, currency, or in this case gold, plunges, allowing the short sellers to buy back shares or contracts they’ve borrowed and sold earlier at a huge discount. Typically, the sellers work together to establish a massive sale that overwhelms buyers and inflicts huge losses on anybody who’s long.
In this case, traders took advantage of the fact that Japan’s markets were closed for a national holiday, knowing full well that absent their money, there were even fewer buyers than usual to mount a defense.
And what a move it was!
More than 3 million lots traded on the Shanghai Gold Exchange; a normal day is less than 30,000 lots by comparison. Anybody who tried to hang on got clobbered.

These kinds of short attacks are nothing new – though this one was particularly severe. For example, we saw 5,000 December gold futures contracts with a notional value of $640 million dumped at market on October 11, 2013. This caused a five-minute sell-off during which more than $2 billion in gold futures traded hands according to the CME. It also caused a 10-second trading halt.
That attack, like Monday’s, was carefully timed to exploit low-liquidity conditions. There were no economic reports or industry-significant events when it hit. There just happened to be a slew of stop-loss orders placed at $1,275 an ounce.
As intended, the onslaught broke key support levels, took out the stop-loss orders, and created huge profits for the bear raiders. To this day we don’t know who the raiders were because they tend to cover their tracks. Still, a quick scan of the headlines at that time reveals who the interested parties may have been. Not surprisingly, it’s a pretty short list of players having the knowledge and the capacity to mount an attack.
Is it any coincidence that Jeffrey Currie, who headed up commodities research in London for Goldman Sachs at the time, said only three days earlier – on October 8 – that gold was a “slam dunk” sell for the next year? Perhaps, but I’ll leave that to you to decide.
Gold prices finished the day down more than 2.5%.
A week later gold finished up 7.5%, to close at $1,361 per ounce as shrewd traders and investors saw the drop for what it really was… more Wall Street shenanigans.
Honestly, it’s too early to tell if that’s the case now. The ease with which traders brought gold prices below its support levels tells me the downward drift isn’t over.
And therein is your opportunity.
You Need Gold in Your Portfolio – but Not for the Reasons You Might Think
Exactly how much gold you should have in your portfolio is ultimately a question to be answered by you and perhaps your financial adviser. But there are some rules of thumb that can help investors reach a balance that’s close to ideal – and it also helps to clear up some common misconceptions along the way.
Many investors think gold is good for portfolios because it’s a good hedge against inflation. This misconception mainly comes from memories of the 1970s, when gold prices grew by a jaw-dropping 2,300% at a time of rampant inflation.
But correlation doesn’t mean causation. Contrary to what all those late-night TV commercials would have you believe, gold prices have never been a proven hedge against inflation.
However, it has been proven to correlate to bond prices, which are, in turn, an indirect function of interest rates that are themselves an indirect inflation proxy. So what you really want to do is own gold because it hedges the value of your bonds.
Studies suggest that having 3% to 5% of total investable assets in gold can provide meaningful protection against rising interest rates while also reducing overall portfolio volatility.
If you’re game for a more sophisticated approach, consider buying $1 in gold for every $10 you have invested in bonds. That will allow your money to approximate the 10-to-1 relationship that’s historically existed between gold prices and interest rates vis-à-vis bonds.
As for what kind of gold, that varies considerably and is a function of personal risk tolerance, objectives, and suitability. Some people like bullion while others prefer choices like Perth Mint Certificates that help alleviate storage and insurance issues. Even jewelry can be good.
For most investors, though, simpler is better.
Over the years, I’ve recommended SPDR Gold Shares (NYSE:GLD) because it’s a highly liquid ETF that directly tracks to price of gold. If you’re hoping to profit from gold prices’ inevitable rebound, it’s hard to get much simpler than that.
If you have concerns about whether or not there’s enough gold to back GLD as some investors do, consider an alternative like the Physical Swiss Gold Shares ETF (NYSE:SGOL). It’s a U.S.-listed exchange traded fund offering shares that are physically backed by gold stored in secure Swiss vaults.
At the end of the day, get past the fact that we’re talking about gold and get your emotions out of the picture. Doing so will allow you to treat it just like any other asset class.
While you’re at it, think about what Ray Dalio, who founded Bridgewater Associates, one of the world’s largest hedge funds, had to say…
“If you don’t own gold… you don’t know history or you don’t know the economics of it.”
Until next time,
Keith Fitz-Gerald
Chief Investment Strategist
Money Morning
 “The world of finance as we know it is highly centralized. Anytime you buy a Starbucks coffee or pay your electric bill, the funds pass through a heavily congested financial highway that is exclusively controlled by the banks.
All the money is funneled through their system. It’s expensive. Inefficient. And incredibly outdated.
Think about an international wire transfer—the funds flow from one bank, to a larger bank, to an even larger bank (typically in New York), and back down to smaller banks on the receiving end.
And everyone takes a fee along the way.
This is ridiculous in 2015. The technology already exists to eliminate all of the middle men and allow transactions to pass directly between a buyer and seller.”
(note: no problem reading the article and listening to the 28 minute podcast, be aware there is a further Video at the bottom that requires your email, and an email confirmation process to watch – Money Talks Editor)

Recently we’ve been writing about the downside potential in precious metals and the danger for precious metals bulls. The gold miners and Silver have led the rout while Gold finally cracked support ($1140-$1150/oz) last week. That led to a severe selloff across the complex. As we pen this on Thursday evening it appears Friday could be a nasty day if Gold breaks below $1080/oz. Nevertheless, the odds now favor a rebound in the weeks ahead and especially in the gold miners.
Though GDM (GDX) has closed below support at 400, it has done so in an extremely oversold state. In the first chart we plot GDM with its distance from its 50-week exponential moving average and its 50-week rate of change. If we count the two oversold instances in both 1998 and 2013 as only one then GDM is at one of its five most oversold points in the past 20 years. With a down day on Friday GDM would be at its third most oversold point in the past 17 years.

In the next chart we use the same indicators but use 10 weeks instead of 50 weeks. It gives us a medium term look. The oversold dates are nearly identical to those based on 50 weeks. If GDM has a down day on Friday to close the week then it could reach its 2nd most oversold point in the past 17 years.

On a cyclical basis, gold mining stocks are arguably the most oversold ever. GDM and XAU have already surpassed their 1996-2000 bear markets. The next data point in the Barron’s Gold Mining Index (whose bear market analog is shown below) will show the current bear surpassing that of 1996-2000. The HUI needs to close at 100 to equal its 1996-2000 bear. Any low in the gold miners weather it occurs in the coming days or next few months has a chance to mark the end of the bear market.

Another reason the miners are close to a rebound is Gold is (unlike in recent weeks) closer to important support. We’ve frequently mentioned targets of $1080/oz (50% retracement) and $1000 to $1040/oz. Below we plot the monthly candles for Silver and Gold. As we pen this article Thursday evening Gold is struggling to hold support at $1080/oz. A breakdown would create more selling but could quickly lead to a rebound from stronger support around $1040/oz.

The miners are now extremely oversold across all time frames and in position for a good rebound. Gold and Silver are not as oversold as the miners but that can certainly change within a few days. While we are unsure if the next low will mark the end of the bear market we can say that regardless, odds favor a big rebound.

-
I know Mike is a very solid investor and respect his opinions very much. So if he says pay attention to this or that - I will.
~ Dale G.
-
I've started managing my own investments so view Michael's site as a one-stop shop from which to get information and perspectives.
~ Dave E.
-
Michael offers easy reading, honest, common sense information that anyone can use in a practical manner.
~ der_al.
-
A sane voice in a scrambled investment world.
~ Ed R.
Inside Edge Pro Contributors

Greg Weldon

Josef Schachter

Tyler Bollhorn

Ryan Irvine

Paul Beattie

Martin Straith

Patrick Ceresna

Mark Leibovit

James Thorne

Victor Adair