Posted July 12, 2015

The prices of the monetary metals cascaded downward this week, and the ratio of the gold price to the silver price rose accordingly.
Many analysts and speculators are puzzled. With everything going on in the world, gold should go up. After all, China released its new gold holdings and the banking system in parts of the world (e.g. Greece) is a mess, and many central banks are printing money, etc.
We don’t know if China’s published number (1658 tonnes, up from 1054 in April 2009) is true or not. We don’t care to speculate, as some have, about this topic (though since we’re linking the article, we want to point out that the Chinese economy is not bigger than the US economy, unless one adjusts the measurement).
We do know that credit stresses are mounting, and it’s not just Greece. There are signs of problems all over the world, including in China. It is important to keep in mind how credit stress works. Let’s compare and contrast two players, we’ll call them Beavis and Butthead.
Beavis owns gold. He is not happy about the falling price. However, being unleveraged, he can think about it at his leisure. He may decide to sell or to keep it, but the point is that his hand is not forced and he is under no pressure. Many readers of this Report may be in this position (we hope).
Butthead has borrowed to buy assets, including gold. With each drop in price, the pressure mounts. He has to look at his leverage ratio — and so does his bank. If he gets a margin call, then his consideration occurs under circumstances that are anything but leisure. Of all his assets, he may choose to dump gold because its price is dropping. This is appropriate for two reasons. One, he hopes to cut losses and hold winners such as stocks. Two, his leverage may be tied to gold specifically, and not to his whole portfolio.
In any case, it leads to the situation we have now. Even gold’s biggest fans — those who expect the biggest profits from a rising gold price — are puzzled. At best. And of course many turn to conspiracy theories about who is whacking gold, and what the motive may be (regardless, we have repeatedly documented that the alleged gold whacking cabal does not have the means).
So here we are. Gold closed the week, broken down, below $1140. Silver is well under $15.
Our view is that breakouts and breakdowns cannot be determined from price charts. We want to know the fundamentals of supply and demand. If the price drops based on heavy selling of metal — as has happened in silver since we began publicly documenting it 2013 — then that’s a fundamental move. We do not predict that fundamental moves should just causelessly reverse themselves, for the price to recover its previous high.
On the other hand, if the price drops based on selling of futures by leveraged speculators, that’s a different story. Then we expect the price is likely to rise. This is because buyers of metal were already hungry at the higher price, and are incentivized even more at the lower price.
How do we measure this balance, this dynamic of changing equilibria in the futures and metal markets? Based on our theory of carry and decarry arbitrage, and using our proprietary model, we analyze the spreads between the spot and futures markets. This is the basis (pun intended) of our Supply and Demand Report.
Read on, for the only accurate picture of the supply and demand conditions in the gold and silver markets, based on the basis and cobasis.
First, here is the graph of the metals’ prices.
The Prices of Gold and Silver

We are interested in the changing equilibrium created when some market participants are accumulating hoards and others are dishoarding. Of course, what makes it exciting is that speculators can (temporarily) exaggerate or fight against the trend. The speculators are often acting on rumors, technical analysis, or partial data about flows into or out of one corner of the market. That kind of information can’t tell them whether the globe, on net, is hoarding or dishoarding.
One could point out that gold does not, on net, go into or out of anything. Yes, that is true. But it can come out of hoards and into carry trades. That is what we study. The gold basis tells us about this dynamic.
Conventional techniques for analyzing supply and demand are inapplicable to gold and silver, because the monetary metals have such high inventories. In normal commodities, inventories divided by annual production (stocks to flows) can be measured in months. The world just does not keep much inventory in wheat or oil.
With gold and silver, stocks to flows is measured in decades. Every ounce of those massive stockpiles is potential supply. Everyone on the planet is potential demand. At the right price, and under the right conditions. Looking at incremental changes in mine output or electronic manufacturing is not helpful to predict the future prices of the metals. For an introduction and guide to our concepts and theory,click here.
Next, this is a graph of the gold price measured in silver, otherwise known as the gold to silver ratio. The ratio moved up 2.2% this week.
The Ratio of the Gold Price to the Silver Price

For each metal, we will look at a graph of the basis and cobasis overlaid with the price of the dollar in terms of the respective metal. It will make it easier to provide brief commentary. The dollar will be represented in green, the basis in blue and cobasis in red.
Here is the gold graph.
The Gold Basis and Cobasis and the Dollar Price

The fact is that the price of gold dropped another $29 (i.e. the price of the dollar went up to another 0.67mg gold). The question is: why?
This graph shows a glaring picture of the action. Notice the red and green lines? Red is the cobasis (i.e. gold scarcity). Green is the price of the dollar (inverse to the conventional price of gold, measured in dollars). When the red and green lines move together like this, it means the price change is caused by speculators in the futures markets, who are repositioning. In this case, obviously, they’re selling.
It is of note that the fundamental price of gold moved up $5 this week. It’s now $65 over the market price.
Is this a good time to bet on gold? While other events could continue to dominate the fundamentals (temporarily), we can think of worse times for this trade.
Now let’s look at silver.
The Silver Basis and Cobasis and the Dollar Price

The silver price dropped even more as a percentage, down -$0.71.
As with gold, look at the correlation of the scarcity measure and the dollar price. Silver, too, saw more selling of futures than of metal.
However, the silver cobasis didn’t keep up with the gold cobasis. Our calculated fundamental price dropped from last week. It’s still above the market price, but only 20 cents or so.
We don’t normally comment on the market open, as we go to print Sunday evening (sometimes we wrap up this Report before the market opens). However, today it is noteworthy that the gold price has had a flash crash, hitting a spike low of $1073 (not a typo!) before settling at around $1106. The silver price did not flash crash, but it did drop, and now sits at $14.55.
There may be interesting buying opportunities coming up. Especially if you’re not leveraged, not subject to margin calls, and have a longer time horizon than Butthead.

The gold miners have broken below their 2008 to 2014 support while Silver is essentially trading at a six year low. Gold looks set to make a new monthly low and weekly low but has yet to break its daily low at $1140/oz. Barring a sudden short squeeze Gold could be hours or days away from cracking in the way Silver and the miners have in recent weeks. The trend for the sector is obviously down and sentiment is following. However, the more important issue for long term bulls is where is the strong support for these markets.
The monthly candle charts of Silver and Gold are below. I’ll start with Silver. It is losing key support at $15/oz. The next key support levels are in the low $13s and low $12s. Moving to Gold, note that Gold appears to have lost $1180/oz which has been a key support level for two years. The monthly chart shows that the next strong support levels are $1040 and $1000.
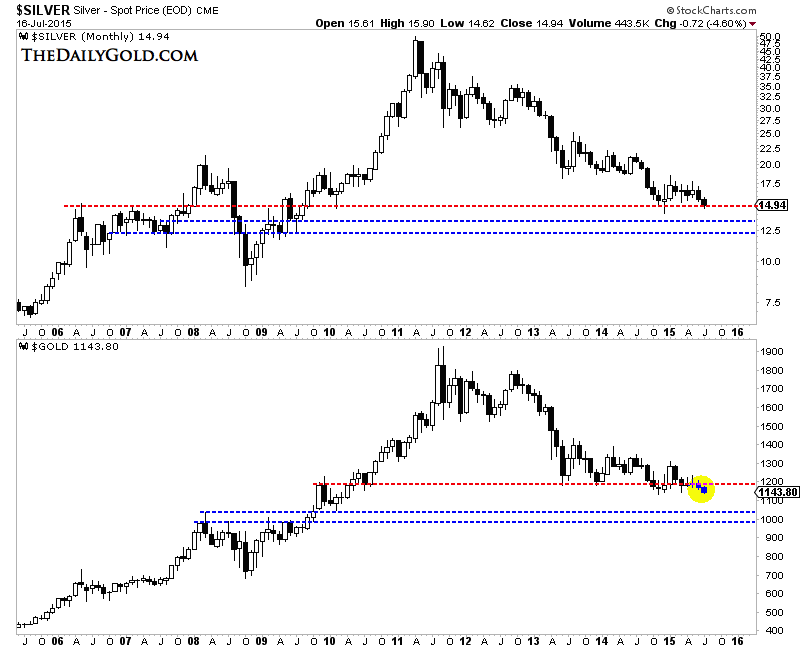
Silver & Gold Monthly
Moving on, let’s look at the miners. We plot $GDM (essentially GDX) and the HUI Gold Bugs Index. This time we look at the weekly line charts. The picture remains clear. GDM has broken below key support (the 2008 and 2014 lows) of 500. It has about 11% downside to the next strong support at 400. The HUI is a much weaker index as unlike GDM it is comprised only of miners and not the stronger royalty companies. The HUI still has a whopping 25% downside to its next major support.

GDM (GDX) & HUI Weekly
GDXJ (not shown) is not performing as poorly as GDX and HUI because junior companies don’t have debt. In looking at the top five gold producers I found a combined market cap of roughly $40 Billion, $6.5 Billion in cash but $27 Billion in debt. Gold breaking below $1140 and $1100 could exacerbate the problems facing miners with significant debt. Hence, the GDXJ to GDX ratio should continue to rise.
The bear market in the miners is on the cusp of matching the 1996-2000 bear market. If the Barron’s Gold Mining Index drops another 10% then it will match the decline from 1996-2000. If the HUI drops to 100 it will match the decline from 1996-2000. If GDM, which closed Thursday at 448, drops 7% then it would match its decline from 1996-2000. You get the point.
The gold stocks bear analog chart below puts this bear market into perspective.
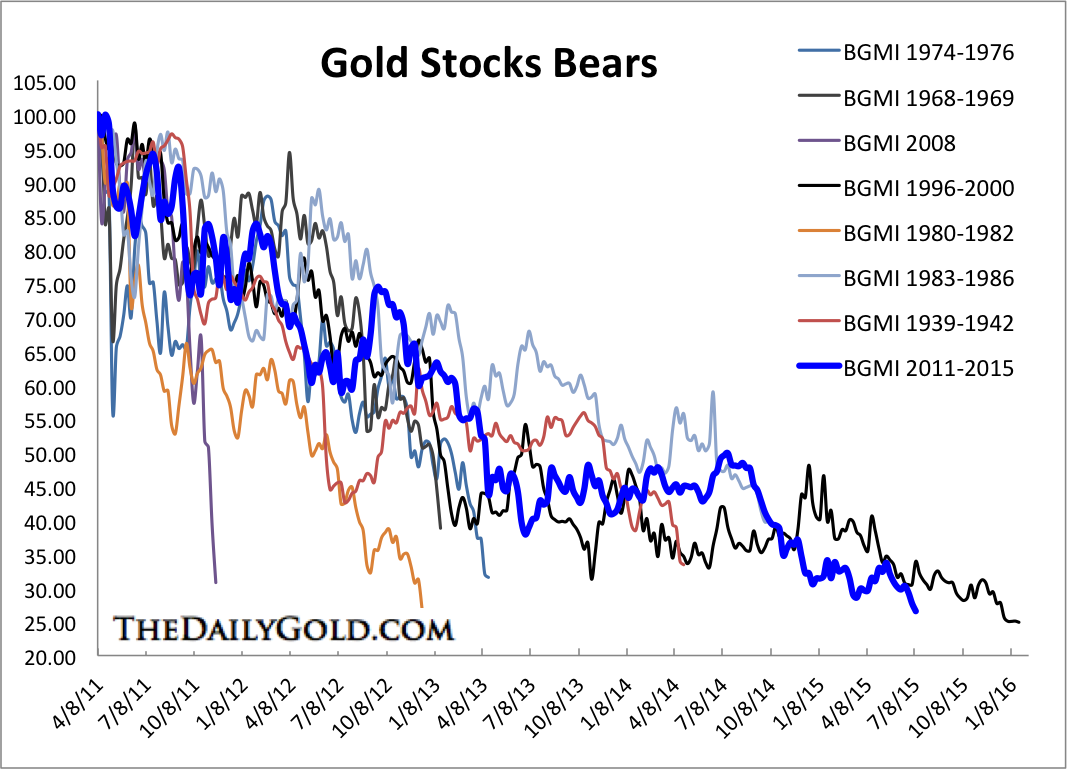
Barron’s Gold Mining Index Bear Markets
Considering the support targets, it is too soon to be a buyer. We’d prefer to see Gold below $1100 and Silver below $14 before thinking about buying. We will also keep the targets for GDM and the HUI in mind. If Gold cracks $1140 and $1100 immediately thereafter it is possible a mini capitulation could develop and the sector could rally. In our view the bottom is likely to develop over a few months rather than a few days or weeks. Stay defensive and stay nimble with hedges and short positions. At somepoint within a few months, the switch will flip and we could have some epic buying opportunities in the precious metals complex. Consider learning more about our premium service including our favorite junior miners which we expect to outperform in the second half of 2015.
Jordan Roy-Byrne, CMT
Posted July 12, 2015
On Tuesday the silver market made its lowest close since 2009. The COT data shows a net short position of 14,319 commercials and net long position of 6,793 non-commercials (speculators) in the futures market. These are levels not seen last November. Many interim lows in silver have occurred with the speculative longs between 1,000 and 8,000 AND Commercial shorts between 10,000 and 25,000 as experienced this week.
However, the major bear markets of 1986, ’92, ’97 and ’01 ended with a more negative bias. The non-commercials positions were a net negative and commercials held fewer than 8,000 net shorts.

Aside from the absolute level of the COT positions we are interested in the rate that the positons change. Typically, the end of a price trend will result in a spike in the positions. This results in RSI(14) readings moving out of the 65/35 range. It also pushes them outside the Bollinger Bands. Both measures came close to minor buy signals this week.
The COT data in gold has reached outright levels last seen eighteen months ago. Those preceded the low at $1186 by two weeks and subsequent rally to $1392 in March 2014. However, every bear market (price below a declining 100-week average) has bottomed after the commercials were net-long and non-commercials net short for an extended number of months*.
So the bottom line is that if prices reverse to the upside from here we can anticipate a tradable seasonal bounce, but not likely the beginning of a bull market. However, a more severe decline in the next few weeks would set up much stronger buy signals.
*Available data from the CFTC only dates back to 1986.

The opinions in this report are solely those of the author. The information herein was obtained from various sources; however we do not guarantee its accuracy or completeness. This research report is prepared for general circulation and is circulated for general information only. It does not have regard to the specific investment objectives, financial situation and the particular needs regarding the appropriateness of investing in any securities or investment strategies discussed or recommended in this report and should understand that statements regarding future prospects may not be realized.
Investors should note that income from such securities, if any, may fluctuate and that each security’s price or value may rise or fall. Accordingly, investors may receive back less than originally invested. Past performance is not necessarily a guide to future performance. Neither the information nor any opinion expressed constitutes an offer to buy or sell any securities or futures contracts. Foreign currency rates of exchange may adversely affect the value, price or income of any security or related investment mentioned in this report. In addition, investors in securities such as ADRs, whose values are influenced by the currency of the underlying security, effectively assume currency risk. Moreover, from time to time, members of the Institutional Advisors team may be long or short positions discussed in our publications.
The above are the Technical observations of Ross Clark for Institutional Advisors
on Friday, 17 July 2015 02:00
Posted July 12, 2015
BOB HOYE, INSTITUTIONAL ADVISORS
EMAIL bobhoye@institutionaladvisors.com
WEBSITE www.institutionaladvisors.com

 “The first form of culture,” wrote historian Will Durant, “is agriculture.”
And he was right. When human beings discovered 10,000 years ago that the soil would provide more food than they could possibly eat, this changed everything.
For the first time ever, early humans could actually work WITH nature and reliably control their food production.
They were no longer dependent on unpredictable wildlife or the dangers of the hunt.
Nor were they resigned to devouring an entire beast in one sitting, only to end up right back where they started– in search of their next meal.
Agriculture gave them the opportunity to produce far more than they could consume. And to easily save the surplus for a later time.
To save like this is completely natural. And by that I mean saving is part of nature.
Dogs bury their bones. Squirrels hoard nuts. Even plants set aside some excess solar energy for a rainy day by producing and storing sugar.
For us humans, agriculture was our earliest form of savings. And it was the key ingredient to civilization.
With a vast pool of food savings at his disposal, early man could put down roots and build societies without having to worry about where the next meal would come from.
It was this sense of savings that formed the dividing line between primitive man and civilized man.
This reminds me of that old criticism about gold being a “barbarous relic”……continue reading HERE

I know Mike is a very solid investor and respect his opinions very much. So if he says pay attention to this or that - I will.
~ Dale G.
I've started managing my own investments so view Michael's site as a one-stop shop from which to get information and perspectives.
~ Dave E.
Michael offers easy reading, honest, common sense information that anyone can use in a practical manner.
~ der_al.
A sane voice in a scrambled investment world.
~ Ed R.

Greg Weldon

Josef Schachter

Tyler Bollhorn

Ryan Irvine

Paul Beattie

Martin Straith

Patrick Ceresna

Mark Leibovit

James Thorne

Victor Adair