Gold & Precious Metals

  1. As the crisis in Greece (and now Puerto Rico) intensifies, Global markets (except gold) are tumbling. Please  click here now. Greek banks are closed, and the situation looks grim. 
  2. Incredibly, the enormous volatility seen in US stock markets yesterday could intensify, when the US jobs report is released around 830AM on Thursday, just a few days ahead of the Greek referendum! Gold and silver have a rough general tendency to decline ahead of the jobs report, and rally following its release.
  3. In my professional opinion, Greek citizens will probably vote “Yes” to stay in the EU, but will leave anyways in a few weeks. Their sovereign debt crisis won’t be solved by borrowing even more money. Also, once today’s payment deadline passes,it appears that the referendum becomes a vote on something the IMF by-laws prevent it from delivering!
  4. The good news is that I expect Chinese corporations and banks to engage in serious buying of Greek assets if/when Greece leaves the EU. Greek stock markets could rally strongly, as that happens.
  5. The Greek government is running a balanced budget now, but its overall debt is an overwhelming burden. Likewise, the US government is working towards balancing its budget, but it also has massive debts.   
  6. The poorest citizens in America are burdened with what I call “shadow taxation”; the cost of living is extremely high for most people, relative to their income. The US government and the Fed are probably mainly to blame for this situation, but greedy corporate directors are also at fault. 
  7. Rather than paying themselves fairly and paying their workers fairly, many corporate directors have issued themselves huge salaries, while underpaying workers, laying them off, and then urging the government to operate hugely inefficient social assistance programs for the impoverished workers.
  8. US wages have stagnated for decades, while corporate profits have surged. House price inflation has been used by the government and the Fed to “create wealth”, but it’s not creating any wealth for most people. It’s destroying the ability of the country’s working class to house themselves. 
  9. In time, the US government will probably default on its debts, but it will be quite a long process, featuring an ongoing drop in the standard of living of most US residents. 
  10. Please  click here now. This weekly chart of the Dow looks frightening. Relative strength (RSI) has been in steady decline since 2013, while the price of US stocks has rallied. Note the bearish wedging action of the price channel I’ve highlighted on the chart.
  11. Some analysts have suggested that the US stock market could function as a type of “safe haven”, if global bond markets collapse. I beg to differ, and yesterday’s meltdown in the Dow suggests that I’m correct to do so. 
  12. Institutional investors will move funds from bonds to stocks if interest rates rise based on surging economic growth. That’s not happening, and US corporate productivity is “dead in the water”.
  13. The US economic upcycle is almost eight years old. Growth is not surging, and while I don’t see Greece as a domino like Lehman was, most Western countries have debt problems that could easily become similar to the problems of Greece.
  14. America is an aging empire. The simple fact is that when they are young, empires shine brightly. When they age, they fade into obscurity. 
  15. On that note, please  click here now. While I wouldn’t touch the stock market of the aging and debt-soaked American empire with a ten foot pole, I have no fear of buying all the price sales that occur in the Chinese stock market. 
  16. In a nutshell, the Chinese empire is young and vibrant. Please  click here now. That’s the monthly chart for FXI-NYSE, which I refer to as the “Chinese Dow”. 
  17. A pullback to the apex of the massive symmetrical triangle pattern would be no surprise to any professional investor. With about five hundred million people poised to become part of China’s “investor class”, new pension fund rules, and the growing share of China in international stock indexes, the future is very bright for the Chinese stock market!
  18. Please  click here now. That’s the seasonal chart for the spot price of gold, courtesy of Dimitri Speck. Please  click here now. That’s another seasonal chart, using the price for gold futures.
  19. Investors who put too much capital to work in a single price area, can find themselves straining to make every tiny price move important. When analysing seasonal charts, it’s important to remember that they are seasonal averages of the price action. 
  20. Generally speaking, gold tends to decline in the first half of the year, and rally in the second half. Today is last day of June, and so gold can be said, generally speaking, to be ending the weak season, and beginning its strong season.
  21. Please  click here now. That’s the daily T-bond chart. Rallies in T-bonds are often accompanied by rallies in the price of gold. It appears that a bullish multi-headed inverse head and shoulders bottom pattern is forming on the T-bond chart, and that’s more good news for gold investors!
  22. Please  click here now. Nobody loves gold more than the citizens of India. The country’s mines have all been depleted, and the government has used that fact as an excuse to impose massive duties on imports. Both China and India are moving quickly to find large amounts of gold in the sea, and this should encourage the government to end the duties. Supply from conventional mines and Western investors is dwindling, so I don’t think the coming seabed discoveries will affect the gold price adversely. It’s a win-win situation for all stakeholders, in what I call… the gold bull era!
  23. Please  click here now. That’s the daily chart for Barrick Gold, which I use as a proxy for the next leg of the bull era. Barrick rallied from the $11 area, but the rally was halted by seasonal factors. There’s a bullish wedge pattern in play now, and there is “price symmetry” with the early November lows in the $10.77 area. 
  24. As the second half of 2015 gets underway, I expect Barrick to begin to rally towards the key supply zone in the $13 area, and burst above it in early 2016. Investors should be prepared to accumulate Barrick, or their favourite gold stocks, over the next 48 hours, into the softness that typically precedes the US jobs report. The golden good times should begin to roll, after the report is released, and keep rolling, for the rest of the year!

Jun 30, 2015  
Stewart Thomson  
Graceland Updates
website: www.gracelandupdates.com
email for questions: stewart@gracelandupdates.com 
email to request the free reports: freereports@gracelandupdates.com

Tuesday Jun 30, 2015
Special Offer for Money Talks readers
: Send an email to freereports@gracelandupdates.comand I’ll send you my free “Gold Stock Dollar Darlings” report. I highlight key gold and silver stocks trading at under $1 that are poised to soar in the second half of 2015!

Graceland Updates Subscription Service: Note we are privacy oriented. We accept cheques. And credit cards thru PayPal only on our website. For your protection we don’t see your credit card information. Only PayPal does.

Subscribe via major credit cards at Graceland Updates – or make checks payable to: “Stewart Thomson” Mail to: Stewart Thomson / 1276 Lakeview Drive / Oakville, Ontario L6H 2M8 / Canada

Stewart Thomson is a retired Merrill Lynch broker. Stewart writes the Graceland Updates daily between 4am-7am. They are sent out around 8am. The newsletter is attractively priced and the format is a unique numbered point form; giving clarity to each point and saving valuable reading time.

Risks, Disclaimers, Legal
Stewart Thomson is no longer an investment advisor. The information provided by Stewart and Graceland Updates is for general information purposes only. Before taking any action on any investment, it is imperative that you consult with multiple properly licensed, experienced and qualifed investment advisors and get numerous opinions before taking any action. Your minimum risk on any investment in the world is 100% loss of all your money. You may be taking or preparing to take leveraged positions in investments and not know it, exposing yourself to unlimited risks. This is highly concerning if you are an invetor in any derivatives products. There is an approx $700 trillion OTC Derivatives Iceberg with a tiny portion written off officially. The bottom line:


TOP 5 GOLD PRODUCERS: Stunning Decline In Gold Productivity

This is a chart every gold investor needs to see.  While the gold mining industry works harder every year to produce the highly sought-after monetary metal, its overall productivity continues to decline.  Actually, decline is too soft of a word to describe what’s taking place in the world’s leading gold producers.

If we look at the at the top five gold producers since 2005, their productivity deteriorated a stunning 50% since 2005.  In 2013, the top five gold producers (Barrick, Newmont, AngloGold, GoldCorp & GoldFields) consumed the most diesel ever:

Diesel-Consumption-At-The-Top-5-Gold-Producers

In just nine years, the top five gold producers nearly doubled their diesel consumption from 320 million gallons (MG) in

2005 to 591 MG in 2013.  I haven’t updated these figures for 2014, because most of the companies haven’t released their figures for 2014 (found in their Sustainability Reports).  The reason I am posting this information on 2013’s figures now… I failed to update some of this information last year.


Here is the breakdown of the individual companies diesel consumption:

Total 2013 Diesel Consumption

Barrick = 220 million gals

Newmont = 179 million gals

AngloGold = 95 million gals

GoldCorp = 65 million gals

GoldFields = 38 million gals

So, why is this such a big deal.  Well, if we look at the next chart, it puts it all into perspective:

Top-5-Gold-Miners-Gold-Production-Diesel-Consumption1

The top five companies diesel consumption per ounce of gold produced doubled from 12.7 gallons per oz (gal/oz) in 2005 to 25.8 gal/oz in 2013, while production declined from 25.2 million oz (Moz) to 22.9 Moz respectively.  This has everything to do with decline of average gold yield from the group which fell from 1.7 grams per ton (g/t) in 2005 to less than 1.2 g/t in 2013. 

Basically, the top five gold miners have to move a lot more ore to produce the same (or actually less) gold than they did just nine years ago.

One company that released their 2014 energy consumption figures was Newmont.  Actually, Newmont’s total diesel consumption declined from 179 MG in 2013 to 158 MG in 2014.  This was due to lower gold production as well as much lower volumes of waste rock.  Newmont’s waste rock fell from 620 million tons in 2013 to 398 million tons in 2014.  I would imagine part of the reason for the decline in waste rock was due to Newmont high-grading its mines.  This is the mining technique of extracting the higher grade ore, resulting in higher gold yields with less waste rock removal.

I believe Barrick’s diesel consumption will also decline in 2014 as they cut back on the construction of many projects and also high-graded some of its gold mines.  2013 may turn out to be the year that the top five gold producers peaked in their total diesel consumption.  Thus, peak of global gold production may be close at hand.

Please check back for new articles and updates at the SRSrocco Report.  You can also follow us at Twitter below:

SRSroccoReport-Twitter-Button

Gold and silver are languishing near major lows, trudging through the barren sentiment wasteland of the summer doldrums.  The major factor behind this weakness is extreme shorting by American futures speculators.  But their heavily-bearish bets are actually very bullish for both precious metals.  Not only do these traders as a herd always bet wrong at price extremes, their shorts are guaranteed near-future buying.

American futures speculators’ trading has utterly dominated gold and silver price action in recent years.  This single group of traders doesn’t normally wield such outsized influence.  But with Western investors largely missing in action since early 2013, futures speculators have gone unchallenged.  Couple this with the extreme leverage inherent in futures trading, and its stranglehold on gold and silver prices is ironclad.

….read more & view charts HERE

Gold in Other Currencies

Gold priced in US dollars, euro and yen over the past 18 months. Gold may look weakish in dollar terms, but it certainly looks just fine in terms of every other major currency, via StockCharts.

Gold-in-currencies-772x1024

….read the whole report “In Gold We Trust 2015” HERE

The Silver Short Bubble

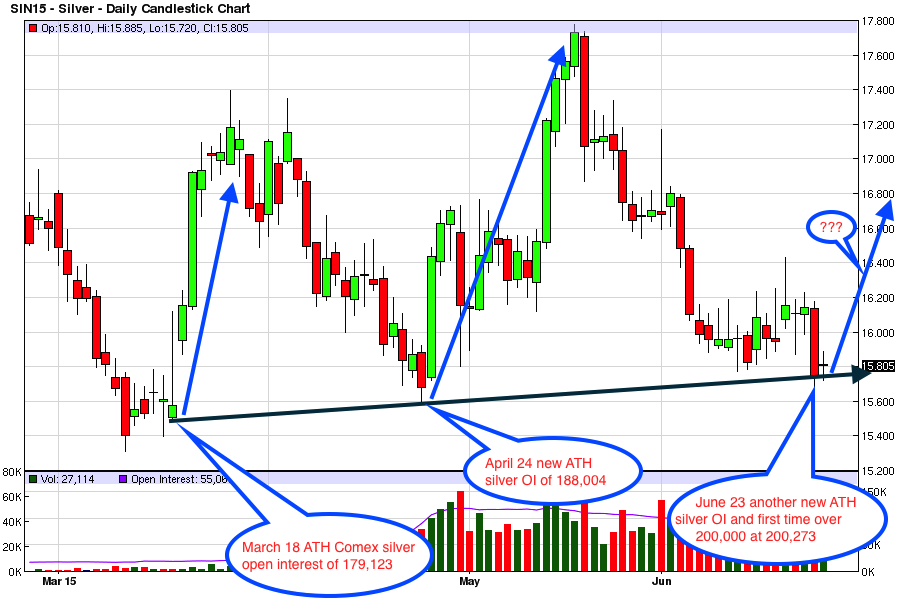
For the first time ever, total Comex silver open interest exceeded 200M contracts yesterday, settling at 200,273. This means that the coming Spec short squeeze is going to be violent and substantial. And why isn’t anyone calling this a “bubble”?

The final open interest numbers for yesterday are in and they are truly remarkable. Gold, which declined by $7, saw its OI rise by over 11,000 contracts to 430,978. This is the highest Comex gold OI since late March. Since yesterday was a CoT survey day, there’s no doubt in my mind that this week’s report will show another substantial and bullish improvement in the gold CoT structure. Why? For the Wed-Tue “CoT week”, gold was down $5 but total Comex OI ROSE by over 15,000 contracts with 2/3 of the rise coming Fri-Tue when price was declining by over $25. That’s A LOT of fresh Spec shorting in gold and it will likely move the gold CoT to a bullish structure not seen since the early November lows last year.

That’s all well and good but, obviously, the point of this post is silver so let’s get right to it…

Yesterday, as price was being smashed nearly 2.5% or 40¢, total Comex silver OI rose by another 4,909 contracts to close at 200,273. That’s the first time in the history of the Comex that total OI has exceeded 200,000 contracts.

  • First of all, why now? Why is silver OI at record highs when price is at 5-year lows? And where are all the “bubble callers”? They were out in force four years ago with price in the $40s and total OI at 140,000. Why can’t this current time be called a “short bubble”? It clearly is. I guess it’s only a “bubble” when it fits the narrative you’re trying to promote.
  • Let’s do some math. There are 5,000 ounces of paper silver behind every Comex contract. Multiply 5,000 X 200,000 and you get a total Comex obligation of over 1,000,000,000 ounces of silver. Hmmm. Last year’s global mine supply was just under 900,000,000 ounces and the TOTAL Comex vault shows holdings of 181,000,000 ounces. How is it even legal to print 200,000 contracts when there’s only enough silver in the vaults to cover less than 40,000?
  • On the topic of mine supply, the WGC estimates total global gold mine supply at about 92,000,000 ounces. Total Comex gold OI at 430,978 represents 43,000,000 ounces or about 47% of total annual mine supply. In silver, as noted above the percentage is about 112% of total annual mine supply.

From a CoT standpoint, this is all extraordinarily bullish for paper silver. As mentioned earlier, the next report is due Friday and it will be based upon these numbers from last evening. For the CoT week, silver was down 21¢. Remarkably, over this same period, total silver OI spiked by 9,500 contracts from 191,774 to yesterday’s 200,273. From a CoT perspective, we are back to a very bullish extreme in silver, too.

And what about the short squeeze that we’ve been expecting. OH, IT’S DEFINITELY COMING and the growth of Spec short open interest this week only adds more fuel for the fire. All we need is a spark. We almost had that spark last week after the Fedlines but silver failed to cross its 50-day moving average and fell back. The “doubling-down” on Spec short positions this week is simply accelerant for the fire once it begins. The chart below can’t make it much more clear for everyone:

unknown-3 194

In other news today, the Greek situation is reaching a true crisis point and the US economy is slipping into recession. Meh,

whatever. The HFT algos don’t give a damn about such arcane notions as fundamentals, all they see is a declining yen and they sell “gold” accordingly:


unknown-2 208

I need to get this posted so I’ll just leave you with this…

In the 3.5 years since MFingGlobal when I officially quit trading, rarely have I been so tempted to wander full force into The Casino. This current situation is so extreme and the “short bubble” so HUGE that it is very difficult for me to remain on the sidelines. However, on the sidelines I shall remain. This personal restriction does not apply to you, however, my dear reader. Best of luck, be patient and prepare accordingly.

TF

http://www.tfmetalsreport.com/