Gold & Precious Metals

Gold & Silver Move Closer to Breakdown

Gold and Silver are going to close down for the third consecutive day and the third consecutive week. As we pen this on Friday, Gold bounced from $1162/oz and could close near $1170/oz while Silver traded below $16/oz and may close at $16/oz right on the dot. Both metals are now dangerously close to their final weekly supports and therefore one step closer to an important technical breakdown.

The weekly candle chart for both metals is shown below. Today’s action has yet to be updated. Nevertheless, we can see the clear important weekly support for both metals. For Gold it’s roughly $1150 and for Silver it’s $15.50 to $15.70. The failure of the metals to rally out of their 7-month long bases bodes bearish for the weeks ahead. Furthermore, let’s not forget the relatively high net speculative positions seen in both markets. The COTs will be updated by the time you read this but odds are there are plenty of speculators left to drive the metals to a final breakdown.

june5goldsilverwk

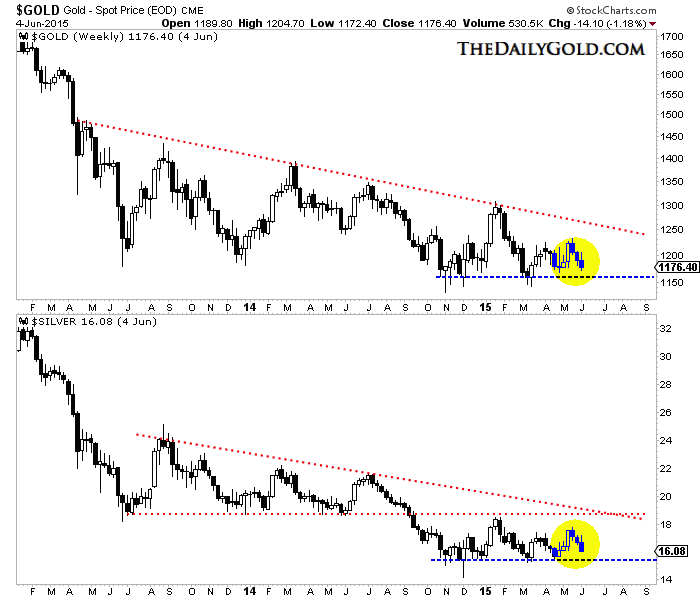
Gold & Silver Weekly

The miners, which peaked before Gold in 2011 and have shown more strength (or less weakness) in recent months

figure to lead the sector out of the coming bottom. At the least, the miners are likely to remain above their lows as the metals break their own lows. In daily terms, Gold is about 2.5% from its low of $1140 while GDX and GDXJ are roughly 13% and 15% from their daily lows. The weekly chart below plots GDXJ and GDX and their weekly support (in blue).


june5minerswk

GDXJ & GDX Weekly

Put yourself in position so you can take advantage of the coming breakdown, rather than be a victim of it. We booked profits in our hedges today and will look to reload if the metals rebound next week. We also advise tuning out the super bulls and super bears who are calling for price targets which have no fundamental or technical basis. Extreme targets are an emotional distraction and not actionable.

Mind you, we are huge gold bulls and expect a very sharp rebound to come after this final breakdown runs its course. If and when Gold reaches major support around $1000/oz, it will likely find itself extremely oversold with very negative sentiment. That combination along with strong technical support can produce a big rebound. The coming breakdown in the metals could create one last chance to buy quality junior miners at bargain prices. 

Jordan Roy-Byrne, CMT

Jordan@TheDailyGold.com

Consider learning more about our premium service including our favorite junior miners which we expect to outperform in the second half of 2015.

Goldman Sachs’ chief equity strategist, David Kostin, said that “by almost any measure, US equity valuations look expensive”, which echoed Robert Shiller’s earlier opinion. Is the U.S. stock bubble finally going to burst? How will it affect the gold market?

More and more analysts are warning against a U.S. stock market bubble. Last weekend, Yale professor and Nobel Prize winner Robert Shiller  said that in his opinion U.S. stocks were overvalued. Although he is not sure that the current situation is a classic bubble, he clearly sees the bubble element. For example, Shiller pointed out that the CAPE (cyclically adjusted P/E) ratio has been recently around 27, which is high by U.S. historical standards (the only other times it was that high or higher were in 1929, 2000, and 2007 – all moments before market crashes). What is more, his valuation confidence has recently reached its lowest point since the stock market peak in 2000, implying that people do not believe that current stock valuations are about right. The Nobel laureate also noticed that, unlike 1929, this time all asset classes (and not only stocks) seem to be overvalued.

Shiller’s opinion was shared a few days later by  Goldman Sachs’s chief equity strategist David Kostin in his latest weekly note to clients. He pointed out that financial metrics such as EV/EBITDA, EV/Sales, and P/B suggest that U.S. stocks have stretched valuations. He also noticed that the typical stock in the S&P 500 trades at 18.1x forward earnings, ranking at the 98th percentile of historical valuation since 1976. According to Kostin, with tightening on the horizon, the P/E expansion phase of the current bull market is behind us.

What does it all mean for the gold market? Well, the inevitable correction in the U.S. stock market should be positive for the gold price, since a surging stock market hurts demand for the yellow metal. Indeed,  investors cut holdings in bullion-backed exchange-traded products to the lowest since 2009 as they are looking more at the stock markets rather than buying into the precious metals. Having said that, it is even more surprising that gold has held around $1200 for two years now. Of course, nobody knows for sure when the stock market boom will end. However, it seems that the irrational exuberance will last some time thanks to corporate buybacks. Indeed, the share repurchases seem to be the biggest driver of rises in the U.S. stock market. Goldman’s analyst forecasts that buybacks will surge by 18% in 2015 exceeding $600 billion.

To sum up, more and more analysts are warning against a U.S. stock market bubble, including Nobel Prize winners and Goldman Sachs. It may be a landmark, since what Goldman says often becomes policy. Yellen some time ago admitted that stock market prices were quite high. When the Fed hikes rates – to save its credibility – the stock market boom will end. This could be positive for the gold market, as investors could then fly away from U.S. stocks and the demand for precious metals would increase.

Regards,

Arkadiusz Sieron
Sunshine Profits  

Market Overview Editor
email:  support@sunshineprofits.com 
website:  www.sunshineprofits.com

Disclaimer: All essays, research and information found above represent analyses and opinions of Arkadiusz Sieron and Sunshine Profits’ associates only. As such, it may prove wrong and be a subject to change without notice. Opinions and analyses were based on data available to authors of respective essays at the time of writing. Although the information provided above is based on careful research and sources that are believed to be accurate, Arkadiusz Sieron and his associates do not guarantee the accuracy or thoroughness of the data or information reported. The opinions published above are neither an offer nor a recommendation to purchase or sell any securities. Mr. Sieron is not a Registered Securities Advisor. By reading Arkadiusz Sieron’s reports you fully agree that he will not be held responsible or liable for any decisions you make regarding any information provided in these reports. Investing, trading and speculation in any financial markets may involve high risk of loss. Arkadiusz Sieron, Sunshine Profits’ employees and affiliates as well as members of their families may have a short or long position in any securities, including those mentioned in any of the reports or essays, and may make additional purchases and/or sales of those securities without notice.

Canada Joined The War On Cash

imagesMore and More Countries Join the War on Cash

The War on Cash is now going into hyper-drive.

In the last 24 months, Canada, Cyprus, New Zealand, the US, the UK, and now Germany have all implemented legislation that would allow them to first FREEZE and then SEIZE bank assets during the next crisis.

These moves will be sold as “for the public’s good,” when they happen. But the reality is that it’s all about stopping people from moving their capital into actual physical cash.

The whole template for this was set out in Cyprus in 2013. The quick timeline for what happened in Cyprus is as follows:

June 25, 2012: Cyprus formally requests a bailout from the EU.

November 24, 2012: Cyprus announces it has reached an agreement with the EU the bailout process once Cyprus banks are examined by EU officials (ballpark estimate of capital needed is €17.5 billion).

February 25, 2013: Democratic Rally candidate Nicos Anastasiades wins Cypriot election defeating his opponent, an anti-austerity Communist.

March 16 2013: Cyprus announces the terms of its bail-in: a 6.75% confiscation of accounts under €100,000 and 9.9% for accounts larger than €100,000… a bank holiday is announced.

March 17 2013: emergency session of Parliament to vote on bailout/bail-in is postponed.

March 18 2013: Bank holiday extended until March 21 2013.

March 19 2013: Cyprus parliament rejects bail-in bill.

March 20 2013: Bank holiday extended until March 26 2013.

March 24 2013: Cash limits of €100 in withdrawals begin for largest banks in Cyprus.

March 25 2013: Bail-in deal agreed upon. Those depositors with over €100,000 either lose 40% of their money (Bank of Cyprus) or lose 60% (Laiki).

The most important thing I want you to focus on is how lies and propaganda were spread for months leading up to the collapse. Then in the space of a single weekend, the whole mess came unhinged and accounts were frozen.

One weekend. The process was not gradual. It was sudden and it was total: once it began in earnest, the banks were closed and you couldn’t get your money out (more on this in a moment).

There were no warnings that this was coming because everyone at the top of the financial food chain are highly incentivized to keep quiet about this. Central Banks, Bank CEOs, politicians… all of these people are focused primarily on maintaining CONFIDENCE in the system, NOT on fixing the system’s problems. Indeed, they cannot even openly discuss the system’s problems because it would quickly reveal that they are a primary cause of them.

For that reason, you will never and I repeat NEVER see a Central banker, Bank CEO, or politician admit openly what is happening in the financial system. Even middle managers and lower level employees won’t talk about it because A) they don’t know the truth concerning their institutions or B) they could be fired for warning others.

Please take a few minutes to digest what I’m telling you here. You will not be warned of the risks to your wealth by anyone in a position of power in the political financial hierarchy (with the exception of folks like Ron Paul who are usually marginalized by the media).

With that in mind, now is a good time to prepare for systemic risk. I cannot forecast precisely when things will get as ugly as they did in Cyprus for the financial system as a whole (no one can).

However, the clear signals are clear that the Feds are preparing for something big. The Treasury Department has ordered survival kits for the Big Banks’ employees… and the NY Fed is expanding its satellite office in Chicago in case something major happens that forces the market to collapse.


  1. The month of June is typically a boring one for gold and silver price action, although the latter half of the month tends to be a bit better for gold.
  2. Please  click here now. That’s the seasonal chart for silver, courtesy of Dimitri Speck.
  3. India is the world’s main market for silver, and demand shrivels a bit during the May – June timeframe. 
  4. As a result, the silver price usually swoons, and frustrated investors can make irrational statements about this mighty metal. 
  5. It’s just a seasonal swoon, like an ocean tide change. The silver price tide will come back stronger than ever, because demand from the Hindu religion is cyclical and inelastic. 
  6. India is now the world’s fastest growing major economy. As the citizens get “richer”, they celebrate key gold and silver buying festivals with bigger purchases.
  7. Please  click here now. That’s a five minute bars chart for silver (July contract), highlighting yesterday’s price action. 
  8. Without the bedrock of strong seasonal demand from India right now, news like the upcoming US jobs report on Friday can create a lot of intraday price volatility. 
  9. Please  click here now. That’s the seasonal chart for gold. Gold typically bottoms around mid-June, after peaking around mid-May.
  10. In my professional opinion, as demand in India wanes a bit, amateur technical analysts in the Western gold community tend to get somewhat overly-nervous about what is really just a short term lull in demand. 
  11. Unfortunately, I think a lot of the spike in fear each May and June may be related to their excess use of leverage.  
  12. There’s no need to point gigantic arrows towards drastically lower prices on the gold and silver charts now, regardless of what shapes, patterns, and signals appear to be there.
  13. Charts don’t make fundamentals. Fundamentals make charts.
  14. On that note, please  click here now. That’s the daily chart for gold. The recent price action has been “seasonally perfect”. A peak occurred in mid-May, and gold has drifted lower, logically, since then.
  15. The bottom seasonal line: Eager gold and silver price enthusiasts should expect a major rally to begin in about two weeks, and continue for several months.
  16. Please  click here now. Gold jewellery is the biggest source of demand for gold, and most jewellers in China, Dubai, and India are in “expansion mode”. 
  17. Indian gold jewellery demand is growing about 15% a year, while mine supply grows at about 1% a year. Looking at these numbers alone, it doesn’t take a rocket scientist to see why borrowing money from banks to bet on lower gold and silver prices, is not very wise.
  18. Gold jewellery was never taken by the US government during the last bout of confiscation/revaluation. It can be insured and stored legally in safe deposit boxes. So, it’s truly great news to see the World Gold Council taking concrete steps to further expand demand for the “ultimate asset”.
  19. While demand for gold and silver are soft due to the Hindu calendar, the US stock market is beginning to look a bit like an old sailboat manned by heroin addicts, heading into a hurricane.
  20. Please  click here now. In the big picture, QE has been tapered to zero, inflationary rate hikes are imminent, US frackers are counting on OPEC to bail them out, and yet mainstream media continues to call the US economy’s minus 0.7% performance in 2015 Q1 a “world leader”.
  21. Goldman Sachs economists are calling the US stock market overvalued by almost every metric they use. They’ve lowered their long term forecast to under 2% GDP growth.
  22. Alan Greenspan, who has no “book to talk” now, has called the US government’s general approach to building a welfare state “unsustainable”. When considering the current minor cyclical lull in gold and silver demand related to the Hindu religion, against the background of the dire need for an America soaked in “debtaholic napalm” to reflate itself, any sane investor is going choose the mighty metals as their prime investment vehicle of choice in the coming years.
  23. Please  click here now. That’s the daily chart for Barrick Gold. I’ve highlighted the main recent intermediate trend movements with solid green and red arrows. The arrows are nicely in sync now, with the seasonal gold chart trends. Note the excellent position of my key 14,7,7 Stochastics oscillator, at the bottom of the chart!
  24. I use Newmont as a leading indicator for the entire gold mining stock sector, and Barrick as a confirming indicator. Also, I suggested a few months ago that Barrick was likely to form an interesting right shoulder of a complex inverse head and shoulders bottom pattern, and drop towards the $11 area. That’s in play now, and all gold mining stock fans should highlight the mid-June timeframe on their calendars. It’s a highly likely turning point for Barrick, and for the entire sector!

Jun 2, 2015
Stewart Thomson
Graceland Updates
website: www.gracelandupdates.com
email for questions: stewart@gracelandupdates.com 
email to request the free reports: freereports@gracelandupdates.com

Tuesday Jun 2, 2015
Special Offer for Money Talks readers
: Send an email to freereports@gracelandupdates.comand I’ll send you my free “GDXJ Leaders and Laggards” report. I highlight the top five leading GDXJ stocks, and the worst five, and show technical reasons why all ten are poised for a mid-June launch to the upside!

Graceland Updates Subscription Service: Note we are privacy oriented. We accept cheques. And credit cards thru PayPal only on our website. For your protection we don’t see your credit card information. Only PayPal does.

Subscribe via major credit cards at Graceland Updates – or make checks payable to: “Stewart Thomson” Mail to: Stewart Thomson / 1276 Lakeview Drive / Oakville, Ontario L6H 2M8 / Canada

Stewart Thomson is a retired Merrill Lynch broker. Stewart writes the Graceland Updates daily between 4am-7am. They are sent out around 8am. The newsletter is attractively priced and the format is a unique numbered point form; giving clarity to each point and saving valuable reading time.

Risks, Disclaimers, Legal
Stewart Thomson is no longer an investment advisor. The information provided by Stewart and Graceland Updates is for general information purposes only. Before taking any action on any investment, it is imperative that you consult with multiple properly licensed, experienced and qualifed investment advisors and get numerous opinions before taking any action. Your minimum risk on any investment in the world is 100% loss of all your money. You may be taking or preparing to take leveraged positions in investments and not know it, exposing yourself to unlimited risks. This is highly concerning if you are an invetor in any derivatives products. There is an approx $700 trillion OTC Derivatives Iceberg with a tiny portion written off officially. The bottom line:

Gold: Still Waiting

Gold has been frustrating for bulls and bears since its crash in Q2 2013. In the two years since it has traded in a wide range, frustrating traders and investors. The net result has been nothing but the passing of time. Until Gold breaks above $1300 or breaks below $1150, we will remain in waiting mode. Personally, I believe Gold is far more likely to break lower in the weeks and months ahead. In any case, we are still waiting.

Below is the updated Gold bears analog chart. The chart excludes the extreme bear in terms of time (1987-1993 bear) and the extreme bear in price (1980-1982 crash). The other three bears in the chart provide good context for the current bear which has closesly followed the 1996-1999 bear. Considering only this chart, the $1050 area is a reasonable target.
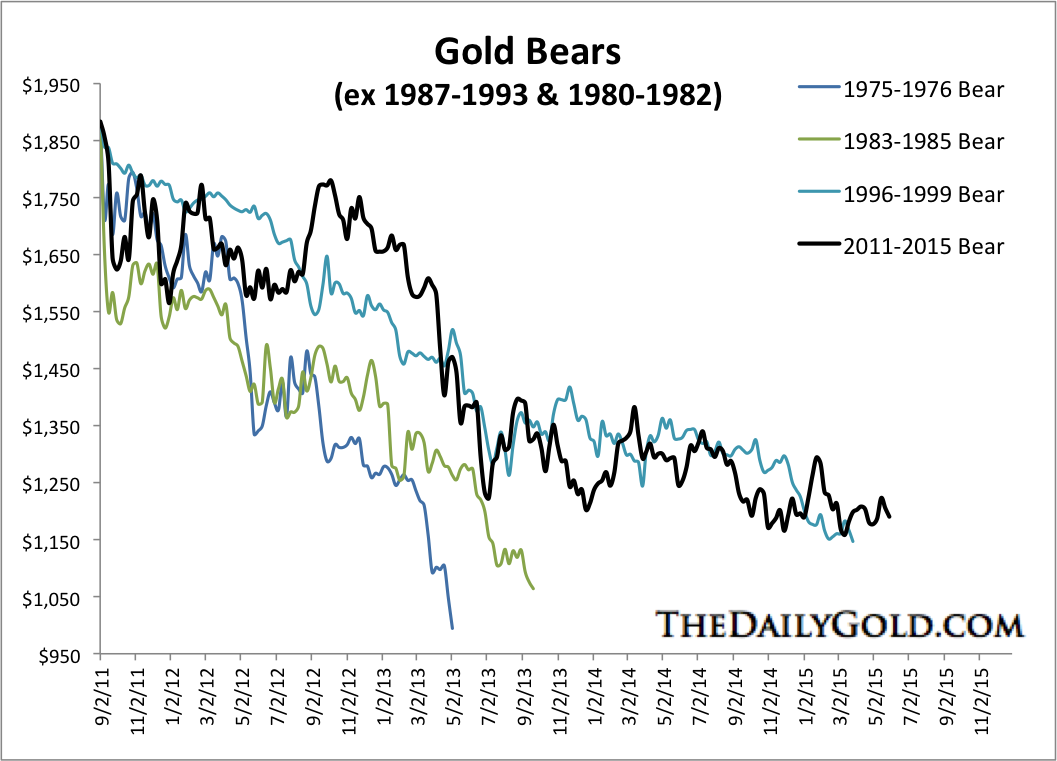
May29.2015Goldbears

Gold Bears

The next chart shows a weekly bar plot for Gold and its net speculative position (as a percentage of open interest) at the bottom. Gold has strong weekly support at $1150 but if that breaks then we can anticipate a move down to stronger support at $1000 to $1050. The net position is at 31% (as of last week) which is very high considering Gold is not yet in a bull market. Too many speculators are left. Two years ago Gold made a low around the same price (~$1200) with its net position at only 6%!

May29.2015Goldwklycot

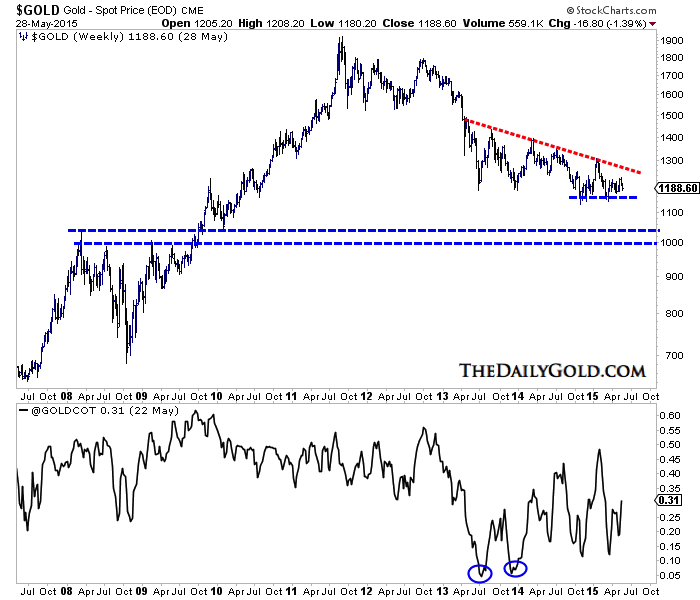
Gold Weekly & Gold COT

Another reason Gold likely has more downside ahead is the US$ bull market may not be finished. While Gold has held in very well with the rising US$, it failed to rally when the US$ corrected from 100 to 93. If the US$ had put in a major top then precious metals would have surged. This chart argues that the US$ has another push to the upside before it makes a major peak.

May29.2015USDBulls

US$ Bull Analogs

We are still waiting for Gold to make its final break lower. In considering history, technicals and sentiment, we have little reason to think Gold will break to the upside. Mind you, we are huge gold bulls and expect a very sharp rebound from the $1000-$1050 area. If and when Gold reaches that area it will do so in a very oversold state with very negative sentiment. The combination of those factors (very oversold, very negative sentiment) meeting with very strong support can produce big rebounds. If metals are heading to new lows then it would likely create one last chance to buy quality junior miners at fire sale prices. Consider learning more about our premium service including our current favorite junior miners which we expect to outperform in the second half of 2015.  

Jordan Roy-Byrne, CMT

Jordan@TheDailyGold.com