
Gold & Precious Metals

There is some talk among traders about precious metals breaking out. Silver broke a trendline dating back to summer 2011 and will make its highest weekly close in more than three months. Gold will make its highest weekly close in three months and gold miners had a very strong week. However, do these moves really register as breakouts? Not quite yet say the charts.
First lets start with the miners. The weekly candle charts for GDX and GDXJ are shown below along with their 80-week moving averages (in blue) and lateral resistance (in red). For GDX and other indices, the 80-week moving average has perfectly defined bull and bear markets going back five years. If GDX can sustain this strength then it should test the 80-wma in the weeks ahead for the third time in the past 10 months. There is a major confluence of resistance at $22. Meanwhile, GDXJ could rally up to $30 or a bit higher before testing major resistance. Miners have more room to rally but there are no breakouts until they takeout their 80-week moving averages.

GDX & GDXJ Weekly Candles
Meanwhile, both metals had strong weeks and will make their highest weekly close in several months. While Silver broke a downtrend line dating back to 2011, the real resistance figures to be around $19 where there is a confluence of resistance. For Gold, the confluence of resistance is around $1250. Ultimately, it is hard to see any major breakout in the metals until they surpass their January highs on a weekly or monthly basis. That would be a significant breakout.
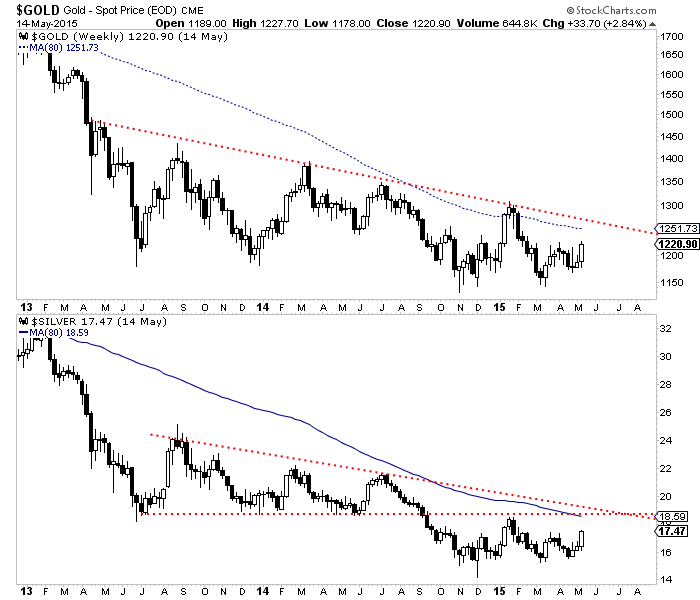
Gold & Silver Weekly Candles
The gold miners (because they peaked first and are extremely oversold) can certainly diverge and perform okay if the metals don’t breakout. However, we get the sense that they won’t perform really well until the market thinks the metals have bottomed. Note what happened during the 2000 to 2001 bottom. Gold against foreign currencies bottomed first followed by gold miners in Q4 2000. Note that after Gold bottomed at the end of Q1 2001, the miners surged by 60% in two months and took out that pesky 400-day moving average (equal to the 80-wma).
While the immediate outlook looks constructive, the entire complex has a lot of work to do before we can get really excited. The miners could test their 80-week moving averages but it is unlikely they can advance farther unless the metals takeout their January highs. I’m skeptical metals will do that on this rebound as their relative performance is weak considering the big drop in the US$. The worst is likely over for the miners but if Gold can’t reach or takeout its January high then the miners are at risk for remaining in the range they have been in for the past eight months. Until something changes, buying support and oversold conditions works better than chasing strength.
Good Luck!
Jordan Roy-Byrne, CMT


Dow Versus Gold Book Profits Now Video Analysis
Above & below are today’s videos and charts (double click to enlarge):
Silver New Range Video Analysis
GDX, GDXJ, & SIL First Target Acquired Video Analysis
Key Junior Gold Stock Volume Spikes Video Analysis
More Junior Stock Charts Of Interest Video Analysis
Morris
Friday, May 15, 2015 Super Force Signals special offer for Money Talks Readers:
Send an email to trading@superforcesignals.com and I’ll send you 3 of my next Super Force Surge Signals free of charge, as I send them to paid subscribers. Thank you!
The SuperForce Proprietary SURGE index SIGNALS:
25 Surge Index Buy or 25 Surge Index Sell: Solid Power.
50 Surge Index Buy or 50 Surge Index Sell: Stronger Power.
75 Surge Index Buy or 75 Surge Index Sell: Maximum Power.
100 Surge Index Buy or 100 Surge Index Sell: “Over The Top” Power.
Stay alert for our surge signals, sent by email to subscribers, for both the daily charts on Super Force Signals at www.superforcesignals.com and for the 60 minute charts at www.superforce60.com
About Super Force Signals:
Our Surge Index Signals are created thru our proprietary blend of the highest quality technical analysis and many years of successful business building. We are two business owners with excellent synergy. We understand risk and reward. Our subscribers are generally successfully business owners, people like yourself with speculative funds, looking for serious management of your risk and reward in the market.
Frank Johnson: Executive Editor, Macro Risk Manager.
Morris Hubbartt: Chief Market Analyst, Trading Risk Specialist.
website: www.superforcesignals.com
email: trading@superforcesignals.com
email: trading@superforce60.com
SFS Web Services
1170 Bay Street, Suite #143
Toronto, Ontario, M5S 2B4
Canada
###
May 15, 2015
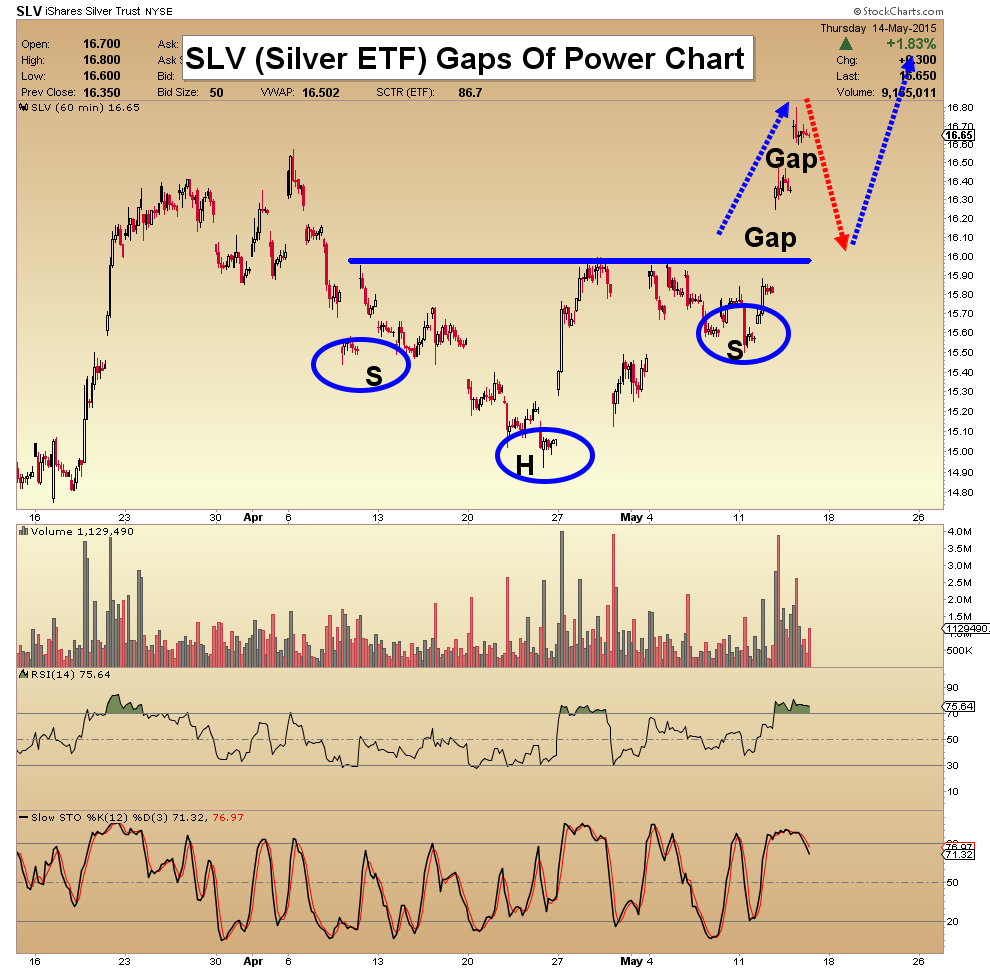
Morris Hubbartt
 With gold trading above $1,220 and silver near $17.50, it now appears both of these markets are setting up for massive moves to the upside. Included in the piece below is a key illustration as well as an important first target for the upside advance in the price of gold.
…..read more HERE

-
I know Mike is a very solid investor and respect his opinions very much. So if he says pay attention to this or that - I will.
~ Dale G.
-
I've started managing my own investments so view Michael's site as a one-stop shop from which to get information and perspectives.
~ Dave E.
-
Michael offers easy reading, honest, common sense information that anyone can use in a practical manner.
~ der_al.
-
A sane voice in a scrambled investment world.
~ Ed R.
Inside Edge Pro Contributors

Greg Weldon

Josef Schachter

Tyler Bollhorn

Ryan Irvine

Paul Beattie

Martin Straith

Patrick Ceresna

Mark Leibovit

James Thorne

Victor Adair