Gold & Precious Metals
Gold: Year 2007 Again
Posted by Ned W. Scmidt via Mark Leibovit
on Wednesday, 6 May 2015 13:49
Imagine you could go back in time so you could buy some investment at a bargain. Many might also wish to go back in time to sell something. But, let us stick with the idea of returning to an earlier time to buy some asset, like before Gold began its ran to $1,900. Since we know what happened, which of us would not again buy Gold? Well, you are in luck. $Gold is now priced relative to stocks as it was in 2007. To save you time, $Gold closed out that year at about $830.
The bars in the chart above are the ratio of year end values for $Gold divided by that for S&P 500, back to 1945. Last bar in chart is for the current value of that ratio. Solid black is line is average of that ratio over the time period shown. High ratio suggests that $Gold is expensive relative to U.S. equities. A low value indicates that $Gold is cheap relative to U.S. equities. This valuation ratio is not a short-term timing tool, but rather can be an indication of when the potential of $Gold to appreciate in the future relative to the S&P 500 is high. As indicated by the smaller black line, the current value of that ratio has not been experienced since 2007. Again, $Gold closed out that year at ~$830.
The chart below portrays the experience of that ratio over past decade. Black line in chart is year end value of $Gold, using left axis, with the most recent data being the last plot. Note that $Gold line has been roughly flat in recent years. While $Gold has experienced ups and downs, it ended 2014 roughly where it did in 2013 and is currently about where it ended 2014. Consider that action with bars for the ratio. As ratio moved to below 0.6, $Gold began to form a multi-year “bottom”.
Why might that be the case? One possibility is that individuals, who tend to be value oriented, realize that $Gold is cheap given the reckless monetary policies of Western nations and the extreme risks now existing in the geopolitical sphere. Second, the stock mania has been pushed to such an extreme in the U.S. that investors are beginning to recognize the great risk in today’s stock prices, and are hedging their portfolios with Gold. A third possibility, and one that should not be casually dismissed, is $Gold is cheap in absolute terms. While that absolute value is difficult to guess, our current long-term value estimate is $1,987.
We can use the long-term average of that ratio to say something about the potential for $Gold and the S&P 500. Based on that ratio, if the S&P 500 is correctly priced at 2,100, $Gold should be $2,431, or double the current level. Alternatively, if $Gold is correctly priced at $1,200, the S&P 500 should be 1,035, or roughly half of the current value. The implications of these calculations are portrayed in the chart below. Naturally, reality will likely be somewhere between these values.
Valuation does not tell us when the price of an asset will rise, only that it should. Under valuation as is the case with $Gold indicates that the price should go up in the future. The ratio discussed above suggested strongly that $Gold should have been bought in 2007 at ~$800. That conclusion remains rewarding. The ratio is again saying $Gold should be bought.
An under valued asset needs a catalyst to correct the mispricing. As we look around the world, many potential possibilities exist to be the “trigger” for higher Gold prices. But, not owning Gold and continuing to play the greater fool game in U.S. equities does not seem wise given the history of both Gold and stock manias.
Ned W. Schmidt,CFA has had for more than two decades a mission to save investors from the regular financial crises created by economists and politicians. He is publisher of The Value View Gold Report, monthly, and Trading Thoughts. To receive these reports, go to: valueviewgoldreport.com. Follow us @vvgoldreport
Related podcast interview:
Ned Schmidt: Gold Bears Will Be an Endangered Species in 2015

- The price movement of gold and silver bullion continues to disappoint both the bulls and bears. “Key” upside and downside breakouts are followed by more sideways action.
- It’s not just gold and silver that are acting like slugs in the mud. Bill Gross has just echoed my view that the US stock market is entering a price area where it will perform much like a wet noodle.
- Please click here now. Bill suggests, as I have for more than a year, that rather than surging higher or blowing up in a fireball, the US equity market will simply fade away quietly.
- The big action now, is not in the US stock or bond markets, and it’s not in gold and silver bullion. It’s in gold and silver stocks.
- The US business upcycle began in October of 2008. It’s almost 7 years old now. The average upcycle lasts about 8 years, and signs of modest inflation and sluggish growth typically appear at the end of the cycle.
- That’s exactly what’s happening now. It’s a generally supportive environment for gold and silver, and an ideal one for gold and silver stocks.
- Please click here now. That’s the daily gold chart. The price continues to grind sideways. Gold is clearly ignoring the parabolic catcalls of wild bulls, and frustrating the vociferous bears who promise “final capitulations” and gigantic “new legs down”.
- I expect gold bullion will continue to frustrate the bulls and bears for several more years, as will silver. Please click here now. That’s the daily silver chart. Like gold, silver is treading water, and I expect it to continue do so throughout 2016, with a mild upwards bias.
- How does an investor make money in a sideways market? The answer is: Short term trading and dividend-oriented investment. When prices are volatile, range trading can be quite profitable, When it isn’t, juicy dividends can bring tremendous satisfaction to any metals-oriented investor. I have a huge focus on dividends in my own investing.
- In regards to the US dollar index, many analysts are trying to call a top or a new leg higher, and relate that to a big move in gold prices. I don’t see a top, or a new leg higher. I see a drift sideways in the dollar, a drift in bonds, a drift in bullion, a drift in the Dow, and much higher gold and silver stock prices!
- Fresh signs of inflation are imminent, and that will bring the first rate hike. That rate hike is supportive for the dollar and negative for gold, but the inflation itself is supportive for gold. So, sideways price action will be the result, with a very mild upwards bias, because of the growth of the Chindian love trade.
- Please click here now. Mainstream media is starting to pick up on the inflation theme.
- It’s a relatively tame theme, and I expect it to stay that way, until the banks begin aggressively loaning out the QE “money ball” they are sitting on. They won’t do that unless higher rates come into play, making those loans, at least initially, very profitable.
- In 2016, I expect the US government to begin directing monies away from their useless wars in the Mid-East, and towards giant infrastructure projects, and that will add more inflationary pressure. Gold stocks should do well in 2015, and “rock” in 2016, as more mainstream analysts join the reflationary bandwagon.
- Please click here now. Heavyweight mainstream money managers like Jim Paulsen are clearly aware of the potential for inflation. Economists at Bank of America, HSBC, and Commerzbank are also “bullish” on gold, but looking for only slightly higher bullion prices in the next few years, which is the same view I have.
- With US stock markets fizzling and talk of inflation growing, gold and silver stocks are set to take centre stage as the best performing asset class, for years to come.
- Please click here now. That’s the daily GDX chart. It’s working its way over the key green downtrend line. A three day close above that line should trigger a rally towards $21.50, and maybe all the way to the $23.30 area.
- While fear trade enthusiasts may be disappointed with the prospects of sideways action in bullion prices for years to come, that’s sideways action with an upwards bias, and much higher prices in gold and silver stocks. With asset classes like the Dow, T-bonds, and the dollar, I think the sideways action will carry a downside bias.
- The gargantuan growth of the Chindian trade is changing the nature of gold, and the nature of gold investors. Historically, fear of lower prices is a key tool in the tool kit of every fear trade investor. That’s because when good times returned to Western economies, gold prices declined, and usually crashed. In contrast, the world is entering what I call a bull era, lead by China and India.
- In Chindia, gold is bought both when times are good, and when times are bad. Chindian gold jewellery demand is already enormous. It’s mostly inelastic in China, fully inelastic in India, and growing at 8% – 15% a year in both countries, with mine supply struggling to grow at 2%. The bottom line: The Western gold investor now can get all the potential upside benefits of the fear trade, with a huge “love trade floor” cushioning current prices. Gold has never had a better risk/reward profile than it has now, and fully deserves its “ultimate asset” moniker.
- Please click here now. This is a very important chart. It’s the ratio chart of GDXJ compared to US T-bonds. Wealth is built and retained by buying one asset class when it is significantly on sale, compared to another one. GDXJ has declined by about 90% against T-bonds.
- Borrowing money from banks to buy silly items like DUST-NYSE with leverage now, is not how to build wealth in a great asset class like junior gold stocks. I want to discuss asset ratios in relation to wealth building in more detail, because it’s one of the key tools that a wealth builder should have in their toolbox.
- When the Dow:gold ratio declined from above 40 to 8, a lot of analysts brought up the theory that gold bull markets end with a Dow:gold ratio of 1:1. In contrast, I argued that when a major asset class falls from above 40 to 8, it needs to be bought systematically. The Chindian love trade has essentially destroyed the Dow:gold indicator’s relevance to gold investing. After touching about 6:1 at the recent lows, the current Dow:gold ratio is currently at about 15:1, the time to sell a bit of gold and buy the Dow is gone. The new major wealth building opportunity is showcased on the GDXJ-T-bond ratio chart. Please click here now. That’s another look at the GDXJ:T-bond ratio chart, using monthly bars.
- I’m looking for two things to send both junior and senior gold stocks soaring against T-bonds, and if they soar against T-bonds, I think they’ll soar against everything. First, I’m looking for a crossover buy signal of the 5,15 moving averages on that GDXJ chart. Second, I’m looking for a great US jobs report to stun mainstream media, and cause a rally in gold prices due to money manager concerns about inflation. The next jobs report comes out this Friday. Whether this is “the big one” or not is unknown, but all serious gold stock investors should have more confidence in their holdings now, than at any point in the history of gold stocks!
May 5, 2015
Stewart Thomson
Graceland Updates
website: www.gracelandupdates.com
email for questions: stewart@gracelandupdates.com
email to request the free reports: freereports@gracelandupdates.com
Tuesday May 5, 2015
Special Offer for Money Talks readers: Send an email to freereports@gracelandupdates.comand I’ll send you my free “Jack My Gold Stocks Ride” report! I highlight six great gold stocks that are flashing rally-now signals with my favourite 14,7,7 Stochastics series oscillator, with great upside potential!
Graceland Updates Subscription Service: Note we are privacy oriented. We accept cheques. And credit cards thru PayPal only on our website. For your protection we don’t see your credit card information. Only PayPal does.
Subscribe via major credit cards at Graceland Updates – or make checks payable to: “Stewart Thomson” Mail to: Stewart Thomson / 1276 Lakeview Drive / Oakville, Ontario L6H 2M8 / Canada
Stewart Thomson is a retired Merrill Lynch broker. Stewart writes the Graceland Updates daily between 4am-7am. They are sent out around 8am. The newsletter is attractively priced and the format is a unique numbered point form; giving clarity to each point and saving valuable reading time.
Risks, Disclaimers, Legal
Stewart Thomson is no longer an investment advisor. The information provided by Stewart and Graceland Updates is for general information purposes only. Before taking any action on any investment, it is imperative that you consult with multiple properly licensed, experienced and qualifed investment advisors and get numerous opinions before taking any action. Your minimum risk on any investment in the world is 100% loss of all your money. You may be taking or preparing to take leveraged positions in investments and not know it, exposing yourself to unlimited risks. This is highly concerning if you are an invetor in any derivatives products. There is an approx $700 trillion OTC Derivatives Iceberg with a tiny portion written off officially. The bottom line:

Silver Near Extreme Channel, Reaction Expected
Posted by ReadTheTicker
on Monday, 4 May 2015 18:24
Silver smashing against an extreme outer channel, looks like an mini head and shoulders, that will break higher rather than lower.
Previous post: This chart shows an extreme sell down, time to watch this security daily – Update
Option expiration week is over, extreme volatility of last week ends (we assume), now it is the time to see if metals will show signs of bullishness. Maybe forecasting a longer USD sideways move.
Latest chart.
Previous update chart
NOTE: readtheticker.com does allow users to load objects and text on charts, however some annotations are by a free third party image tool named Paint.net
Investing Quote…
“Money is made in tape reading [chart reading] by anticipating what is coming — not by waiting till it happens and going with the crowd.” ~ Richard D Wyckoff
“The four most dangerous words in investing are ‘This time it’s different’.” ~ John Templeton

Gold Market Update
Posted by Clive Maund
on Monday, 4 May 2015 11:59
Starting with the 8-year chart for gold we can see that there remains some risk of it gravitating towards the strong support in the $1000 area before the big corrective phase is over. However, with the dollar breaking down that risk is easing, and the chances of an upside breakout from the downtrend are improving. Within the big downtrend channel from the highs we can see a much less steep channel which the price has been stuck in for almost 2 years. This channel is showing some convergence, which is a positive sign. Watch for a breakout from both of these channels which would signal the birth of a major new uptrend, but until that happens there is some risk of a further drop to the strong support in the $1000 area. A point worth keeping in mind is that gold of course looks a lot better when charted against most other currencies
….read more HERE

More Evidence Gold Stocks Have Bottomed Relative to Gold
Posted by Jordan Roy-Byrne - The Daily Gold
on Saturday, 2 May 2015 14:00
As we penn this article Gold is trading below $1180/oz and set to close at its lowest level in six weeks. Gold is less than 2% from its weekly low of $1158. It is fairly close to another technical breakdown. However, the gold mining stocks appear to be bucking the trend and showing increasing relative strength. It appears likely that the stocks have bottomed relative to the metal and maybe so in nominal terms.
Below we plot various gold miner indices against Gold. We essentially plot the juniors and large caps from both the US and Canada against GLD. Not only have these ratios increased in recent months but they have increased in the past few weeks as Gold has declined from $1220 down below $1180. That is a very important signal of relative strength.
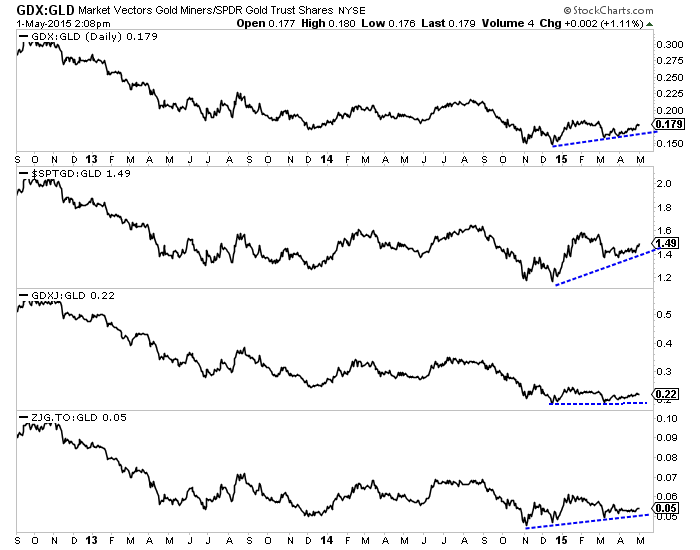
The price action in nominal terms would have been far more encouraging if the miners had closed near their weekly highs. The weekly candle charts for GDX and GDXJ are below. The miners are up for the week but failed to hold the majority of the gains. GDX touched $20.90, which is 7% from its 80-week moving average. If it could reach that resistance it would mark the third test in the past ten months (after previously no tests in two years). That would be a strong signal of a transition from a bear market to a bull market.
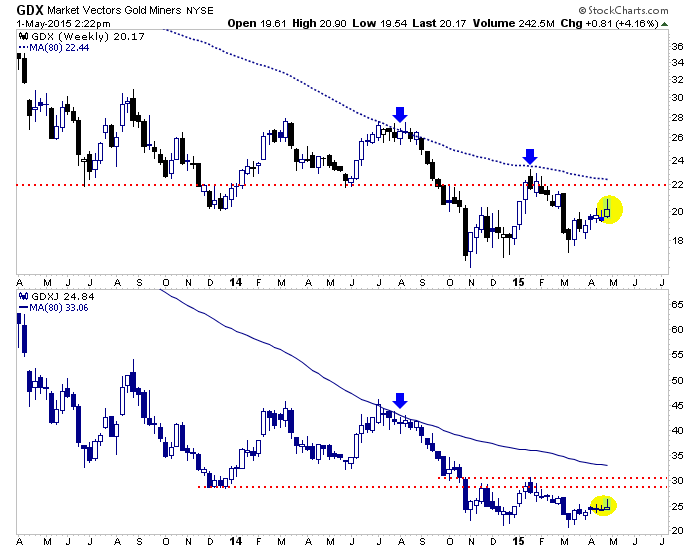
The reasons for the gold miners’ relative strength are unlikely to be temporary. Sure Oil has rebounded but its price remains well below the $100/barrel it averaged throughout 2011 to 2014. That is helping miners. In addition, local currency weakness has been a boon. Even though the US$ index has stalled out, the Gold price against foreign currencies is 20% above its December 2013 low. That helps miners operating outside of the US with some costs denominated in local currencies. Other factors to consider include the strength in the two largest gold miners Newmont and Barrick and the fact that gold stocks recently were potentially the cheapest in history.
The gold miners can continue to show relative strength but they may not rip to the upside until Gold cooperates. A weekly close below $1150/oz could accelerate Gold’s final breakdown. On the other hand, a weekly close above $1220 would be bullish. I would actually prefer the former as it would give us real clarity to the end of the bear market and it would give us a final chance to buy miners before they explode to the upside.
Jordan Roy-Byrne, CMT


-
I know Mike is a very solid investor and respect his opinions very much. So if he says pay attention to this or that - I will.
~ Dale G.
-
I've started managing my own investments so view Michael's site as a one-stop shop from which to get information and perspectives.
~ Dave E.
-
Michael offers easy reading, honest, common sense information that anyone can use in a practical manner.
~ der_al.
-
A sane voice in a scrambled investment world.
~ Ed R.
Inside Edge Pro Contributors

Greg Weldon

Josef Schachter

Tyler Bollhorn

Ryan Irvine

Paul Beattie

Martin Straith

Patrick Ceresna

Mark Leibovit

James Thorne

Victor Adair