
Gold & Precious Metals

Here are today’s videos and charts:
Gold Slow Stokes Calls A Turn Video Analysis
FXI (China Stock Market ETF) Breakout Of Champions Video Analysis
Silver Potential Bull Flag Video Analysis
GDX Bulls Charge Towards $20 Video Analysis
GDXJ Slow Stokes Calls A Turn Video Analysis
Junior Gold Stock Trade Tactics Video Analysis
Thanks,
Morris
Friday, Apr 3, 2015 Super Force Signals special offer for Money Talks Readers:
Send an email to trading@superforcesignals.com and I’ll send you 3 of my next Super Force Surge Signals free of charge, as I send them to paid subscribers. Thank you!
The SuperForce Proprietary SURGE index SIGNALS:
25 Surge Index Buy or 25 Surge Index Sell: Solid Power.
50 Surge Index Buy or 50 Surge Index Sell: Stronger Power.
75 Surge Index Buy or 75 Surge Index Sell: Maximum Power.
100 Surge Index Buy or 100 Surge Index Sell: “Over The Top” Power.
Stay alert for our surge signals, sent by email to subscribers, for both the daily charts on Super Force Signals at www.superforcesignals.com and for the 60 minute charts at www.superforce60.com
About Super Force Signals:
Our Surge Index Signals are created thru our proprietary blend of the highest quality technical analysis and many years of successful business building. We are two business owners with excellent synergy. We understand risk and reward. Our subscribers are generally successfully business owners, people like yourself with speculative funds, looking for serious management of your risk and reward in the market.
Frank Johnson: Executive Editor, Macro Risk Manager.
Morris Hubbartt: Chief Market Analyst, Trading Risk Specialist.
website: www.superforcesignals.com
email: trading@superforcesignals.com
email: trading@superforce60.com
SFS Web Services
1170 Bay Street, Suite #143
Toronto, Ontario, M5S 2B4
Canada
Apr 3, 2015
Morris Hubbartt


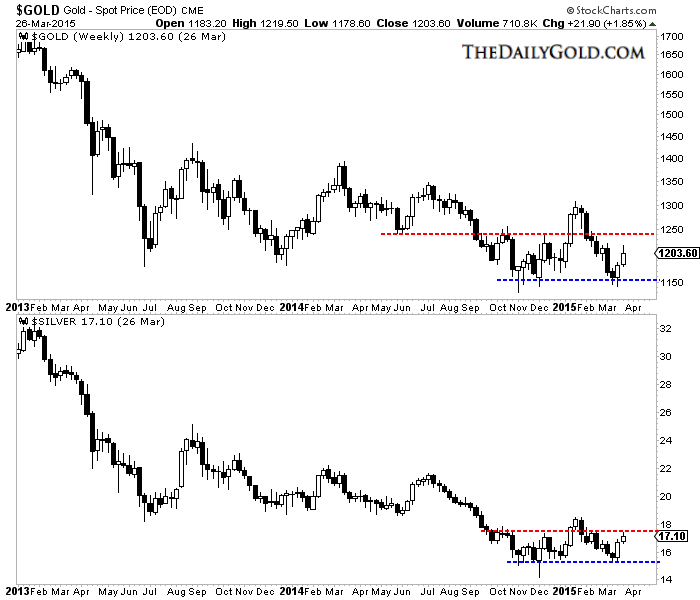
The precious metals complex has established a floor of support over the past five months. For Gold it is around $1150/oz and for Silver it is around $15.50/oz. Pick any miner index and you’ll see the support at the November and December lows. These lows could mark a base of support from which a new bull market takes hold. On the other hand, they could also mark support that if broken could lead to a final but nasty capitulation.
Below is a weekly candle chart of Gold and Silver. Support for Gold is now well defined around $1150. There is major resistance at $1220-$1240 as well as $1300. Meanwhile, Silver has support around $15.50 with resistance at $17.50 to $18.50. If the metals can takeout their January highs then they would definitely be in a new bull market. Conversely, if metals takeout their March lows to the downside, then it could mark the final breakdown of the bear market.
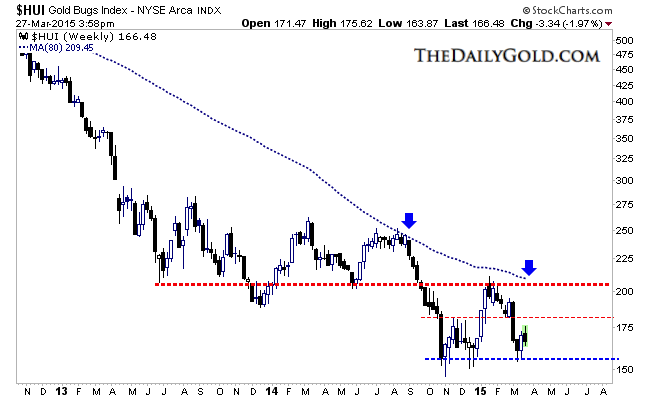
The miners are now showing relative weakness as they are down for the week while the metals are up. The HUI closed the week at 166. It failed to reach first resistance at 180, though it still could. The HUI has a confluence of strong resistance just above 200 with strong weekly support around 155. A weekly close below 155 could trigger a final breakdown while a surge above 200 would signal a new bull market.
I do see some fundamental positives for precious metals. Real rates and real yields may be headed lower in the future. Yields are declining and Fed hikes could be put off again. Inflation, ex energy seems to be slowly ticking up. Meanwhile, problems in Greece could boost Gold even in US$ terms. Any trouble in US equities could certainly be a catalyst for precious metals.
This being said, we need to respect the charts which can be considered bearish until precious metals take out higher levels or until they breakdown and become extremely oversold. I’m leaning to the latter scenario. Protect yourself and your portfolio so you can benefit from a final breakdown. In that scenario, technical indicators and sentiment indicators would reach major extremes as diehard bulls are forced to capitulate. Those are the conditions for great buying opportunities that can lead to a bear market bottom. Consider learning more about our premium service including our current favorite junior miners which we expect to outperform in the second half of 2015.
Here are today’s videos and charts

GDXJ Volume Rules Price Video Analysis
US Dollar ETF (UUP) Correction Target Video Analysis
Gold Bull Volume Bar Of Champions Video Analysis
Silver Moving Averages Buy Signal Video Analysis
GDX Symmetrical Triangle Video Analysis
Four Great Precious Metal Stocks Video Analysis
Thanks,
Morris
Friday, Mar 27, 2015 Super Force Signals special offer for Money Talks Readers:
Send an email to trading@superforcesignals.com and I’ll send you 3 of my next Super Force Surge Signals free of charge, as I send them to paid subscribers. Thank you!
The SuperForce Proprietary SURGE index SIGNALS:
25 Surge Index Buy or 25 Surge Index Sell: Solid Power.
50 Surge Index Buy or 50 Surge Index Sell: Stronger Power.
75 Surge Index Buy or 75 Surge Index Sell: Maximum Power.
100 Surge Index Buy or 100 Surge Index Sell: “Over The Top” Power.
Stay alert for our surge signals, sent by email to subscribers, for both the daily charts on Super Force Signals at www.superforcesignals.com and for the 60 minute charts at www.superforce60.com
About Super Force Signals:
Our Surge Index Signals are created thru our proprietary blend of the highest quality technical analysis and many years of successful business building. We are two business owners with excellent synergy. We understand risk and reward. Our subscribers are generally successfully business owners, people like yourself with speculative funds, looking for serious management of your risk and reward in the market.
Frank Johnson: Executive Editor, Macro Risk Manager.
Morris Hubbartt: Chief Market Analyst, Trading Risk Specialist.
website: www.superforcesignals.com
email: trading@superforcesignals.com
email: trading@superforce60.com
SFS Web Services
1170 Bay Street, Suite #143
Toronto, Ontario, M5S 2B4
Canada
 Silver Spikes in Perspective
“When the Hunt’s had begun accumulating silver back in 1973 the price was in the $1.95 per ounce range. Early in ’79, the price was about $5. In late ’79-early ’80 the price was in the $50’s, peaking at $54.”
“Keep in mind that it was illegal for private citizens to hold gold at that time. President Franklin Delano Roosevelt had signed Executive Order 6102, “The Gold Confiscation Act,” in 1933 and for the next forty-one years it was illegal for U.S. citizens to “hoard” gold. Since gold, the traditional store of wealth, was not a viable option, the Hunts decided to hold their wealth in silver and began to buy it in enormous quantities.
“Since they were concerned with inflation and the potential confiscation of precious metals following Nixon’s closing of the gold window, (the same worries that keep some people up at night even today) they arranged for transfer of the bullion to Switzerland.”
“By 1979 the Hunts had nearly cornered the global market. This was a time of uncertainty.”
…read the whole story HERE

-
I know Mike is a very solid investor and respect his opinions very much. So if he says pay attention to this or that - I will.
~ Dale G.
-
I've started managing my own investments so view Michael's site as a one-stop shop from which to get information and perspectives.
~ Dave E.
-
Michael offers easy reading, honest, common sense information that anyone can use in a practical manner.
~ der_al.
-
A sane voice in a scrambled investment world.
~ Ed R.
Inside Edge Pro Contributors

Greg Weldon

Josef Schachter

Tyler Bollhorn

Ryan Irvine

Paul Beattie

Martin Straith

Patrick Ceresna

Mark Leibovit

James Thorne

Victor Adair