
Gold & Precious Metals

 Analysts at the French Bank Societe Generale (SocGen) in their latest research report have forecast that the gold price, having given away all its early year gains, was headed sharply lower, as it saw the dollar continue its gain in strength. They thus expected the bear market in gold to continue further and saw the price as falling to average only $925 an ounce between 2016 and 2019. The timing of this report was perhaps unfortunate in that the forecast for a virtually immediate downturn in gold, together with dollar strength, predated the events of the past few days, which has seen the reverse occur. Gold bulls will be fervently hoping that the bank’s analysts are equally incorrect in their forecast of gold’s longer-term prospects.
While the bank actually raised its average forecast for the current year to $1,130/oz from its earlier $1,025/oz because of the higher than expected gold price performance during Q1, it expects the price…..
…..continue reading HERE

Originally published March 22nd, 2015.
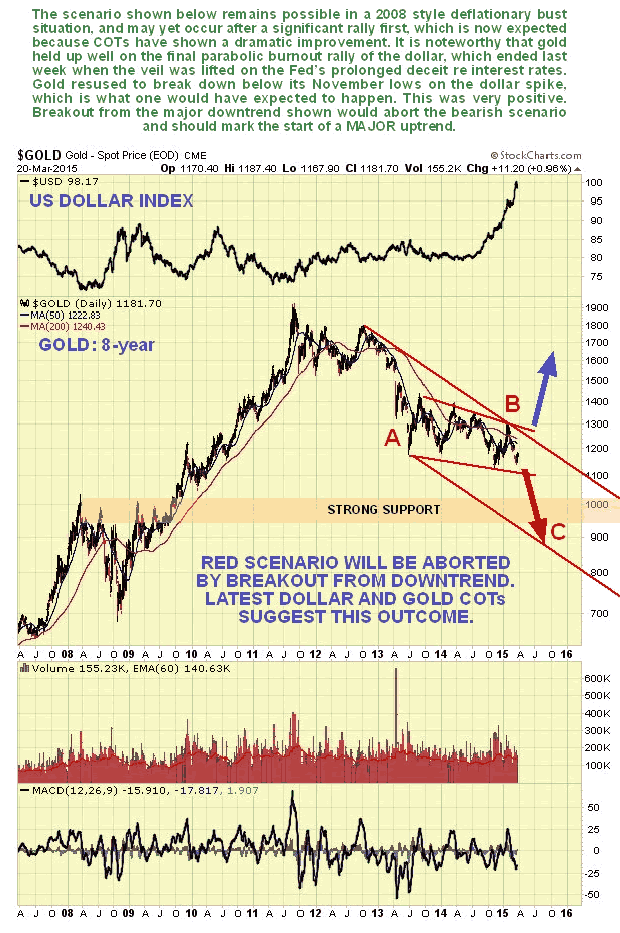
The immediate outlook for gold has improved dramatically following the dollar’s topping action of recent days after the Fed was rumbled, and the vast improvement in the COT structure of the past 2 weeks. While the negative outlook set out in the last update could yet come to pass in the event of a deflationary implosion – and remains a risk until gold breaks out of the downtrend shown here on our 8-year chart – latest COTs certainly suggest that the risk has been averted for now. In anticipation of the dollar reversing after the Fed meeting, we liquidated our PM sector short positions for a profit on the site and reversed to long, and the way things are shaping up we won’t need to close our long positions for a while.
On our 8-year chart for gold we can see that to erase the bearish scenario shown associated with a deflationary implosion, gold has simply to break up upside from the long-term downtrend shown, which wouldn’t take all that much of a rally from here. Latest COTs suggest that is about to attempt to do this. If the dollar index, shown at the top of this chart, is indeed burning out here, then gold is likely to get a powerful boost going forward as the dollar retreats.
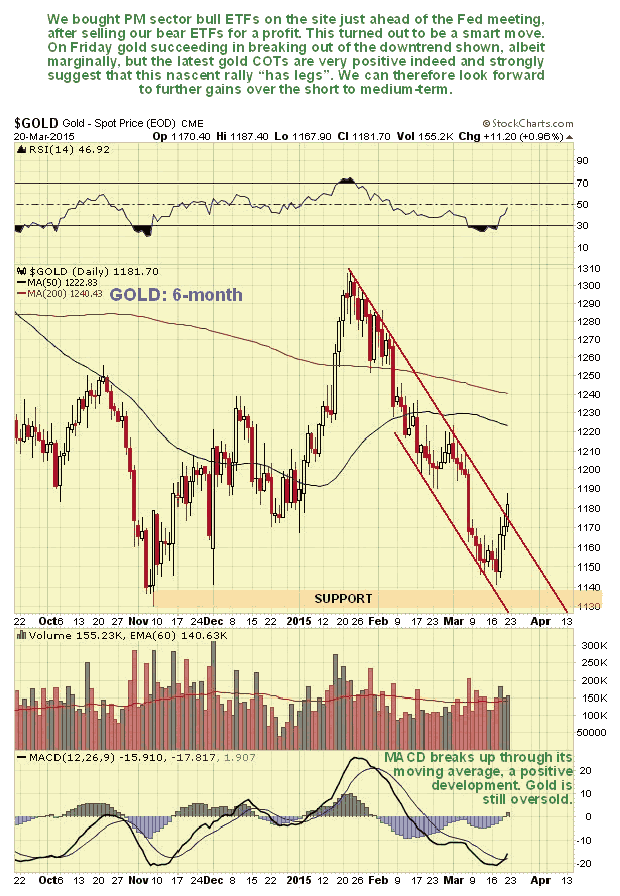
On the short-term 6-month gold chart we can see recent action in more detail. On this chart we can see how gold started to rally immediately after the Fed and it has already succeeded in breaking out from the shorter-term downtrend in force from mid-January. Although the breakout from this downtrend is still only marginal, which normally would lead us to expect some backing and filling, the now highly favorable COT suggests that it will soon get on with it and continue higher.
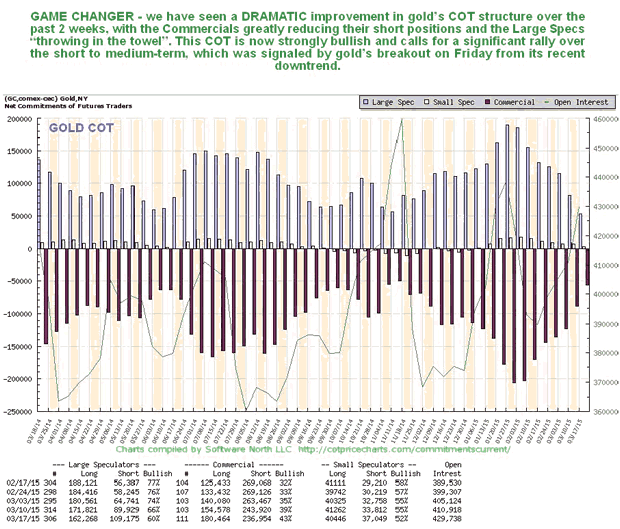
Now we come to the all-important COT. A reader once wrote in and asked “How can you trust the COTs when they could be rigged?” My response to this was simply to say that I would continue to trust them until they don’t work any more, and in any case they don’t need to rig data like this, because the fact is that most market participants are too dumb to use it. Anyway, the latest COT shows a dramatic scaling back of both Commercial short and Large Spec long positions over the past of couple of weeks, which indicates that the Large Specs have “thrown in the towel” in disgust, as they have a habit of doing at market bottoms, while the Commercials are clearly getting out the way ahead of a rally. The last time the COT was this positive was at gold’s November low.
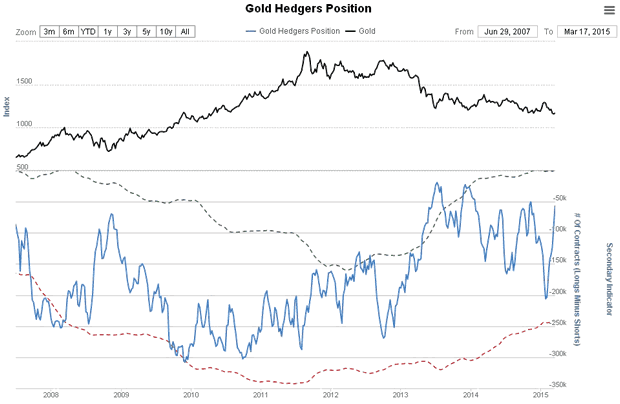
The Gold Hedgers chart, which is a form of COT chart, also shows a dramatic improvement to readings which usually precede a rally.
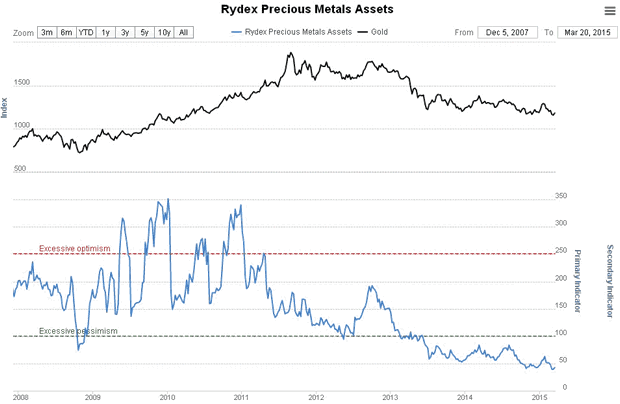
The Gold Optix chart has in recent weeks collapsed back to an extremely low level, and is approaching record pessimistic readings, which of course is another positive sign.

The habitually wrong Rydex Traders holdings in the Precious Metals sector have just hit a new record low, which is another sign of a negative extreme.
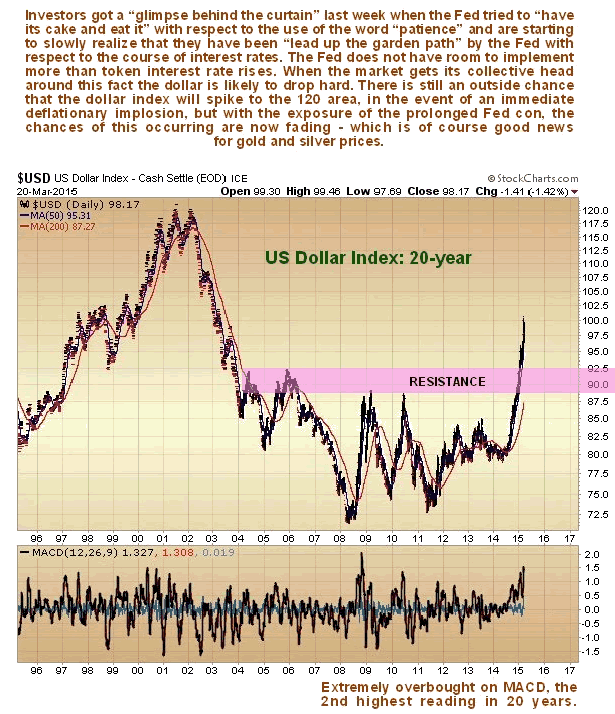
It was a momentous week for the dollar, a week in which the global investment community just started to grasp that the Fed has been playing them for suckers. This is a slow process, like watching Stan Laurel, the notoriously thick partner in the famous Laurel & Hardy comedy duo, slowly grasping some truth. What the Fed has done has been to dangle the carrot of the prospect of higher interest rates in the US in front of global investors seeking higher returns, both to mitigate the damage caused by their extensive QE programs (as in “Let’s get these stupid foreigners to pick up the tab”) and to suck capital into the US to keep its stockmarkets levitated, because gains in US stockmarkets have augmented by rises in the dollar, creating a virtuous circle for investors in US markets. The only problem with this is that it works until it doesn’t. What happened last week was that investors started to rumble that the Fed has no intention of raising rates to any significant degree – it can’t anyway because it is boxed in – and instead of the 2% – to 3% that they were expecting they will end up maybe with 0.5% to 1.00%. This became obvious when the Fed removed the word “patient” from their statement and then Yellen tried to limit the damage by saying that removal of the word “patient” didn’t mean that they were becoming impatient. This double speak has made it plain the game they are playing with the markets.
Anyway – the jig is up – investors are starting to grasp that the rate rises they were looking forward to in the US simply aren’t going to materialize, just some token rises to spin them along. This means that the dollar has either peaked is in a topping out process. You may recall in the last update that we said that the dollar index could get out as high as 120, in the circumstance of an immediate deflationary implosion. This now looks highly unlikely in view of the latest dollar and gold COT and sentiment data, and especially after the Fed “tipping its hand” last week. Action in the dollar and dollar proxies suggest that it has topped out, or at best is in the process of doing so, which could involve marginal new highs.
Accordingly, we have removed our admittedly rather outlandish target of 120 from the 20-year dollar index chart shown below, and it looks like the dollar has now peaked at “round number” resistance at 100. This would not be really surprising given that it is at its 2nd most overbought level for the last 20 years after its amazing ramp of the past 9 months.
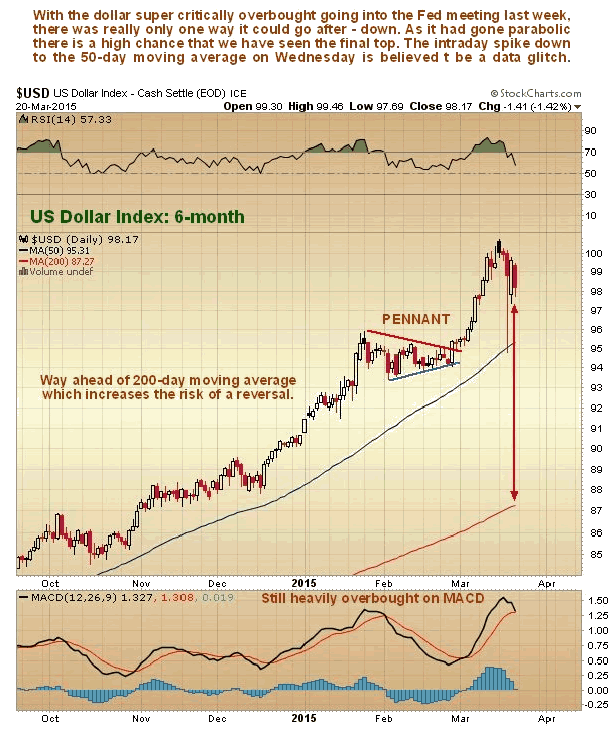
On its 6-month chart we can see how the dollar’s rise became parabolic ahead of the Fed meeting, resulting in it becoming critically overbought on its RSI and extremely overbought on its MACD indicator. Seeing this we reversed position on the site into PM sector triple leveraged bull ETFs just ahead of the Fed, a gambit that has worked out well so far. Before leaving this chart note the anomalous intraday plunge by the dollar to its 50-day moving average on Wednesday which is thought to be a data glitch.
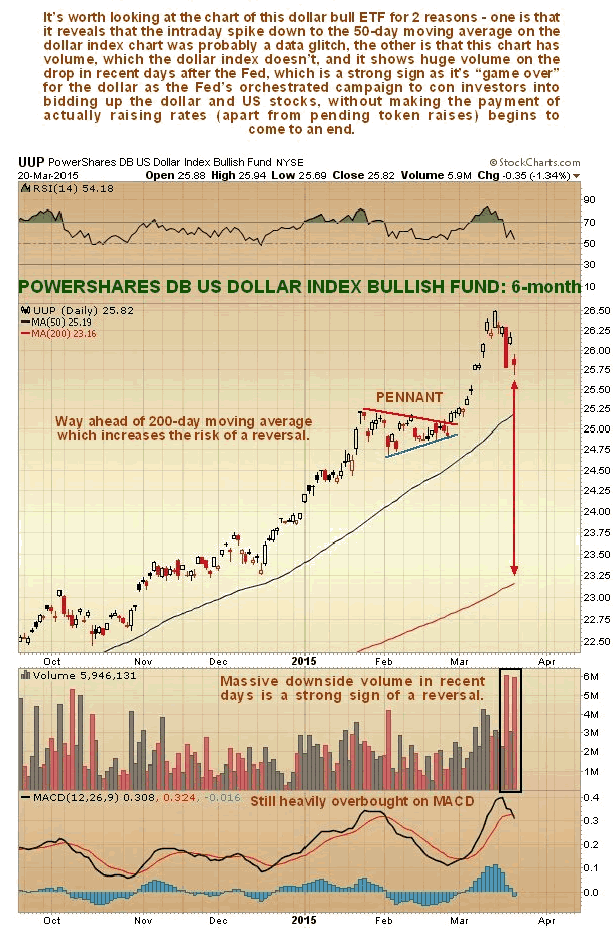
The chart for UUP, a dollar bull ETF, is useful as it enables us to see that the intraday plunge by the dollar on Wednesday mentioned above was indeed a data glitch, as UUP did not make the same move. Another advantage conferred by looking at the UUP chart is that it has volume, which the dollar index chart doesn’t, and it enables us to see that there was a stampede for the exits immediately following the Fed, which of course has bearish implications. Fortunately we were able to front run this mob.
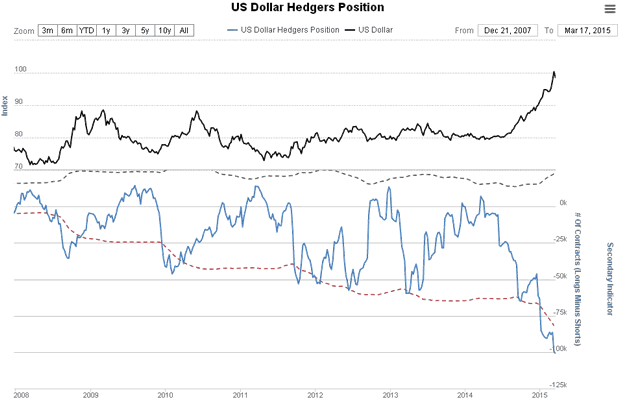
It’s a case of laugh or cry when you see the dollar Hedgers and Optix charts shown below. Starting with the latest Hedgers chart, which is a form of COT chart, we see that it has dropped to crazy record short readings as Smart Money has piled on the shorts as the dollar went parabolic ahead of the Fed meeting. Just going on this chart, the dollar will be toast before much longer.
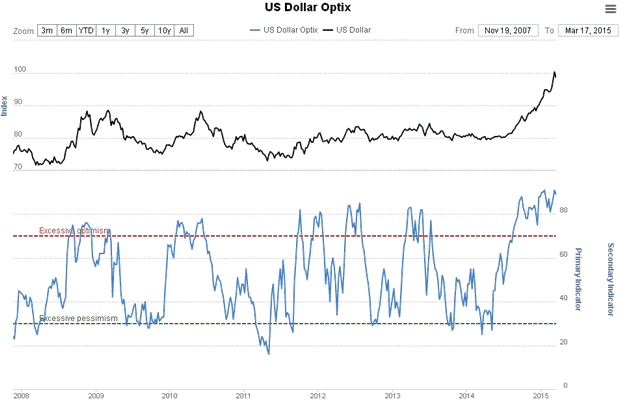
The dollar optix, or optimism index shows that bullish sentiment towards the dollar was flirting was record extremes going into the Fed meeting, another indication that it is burning out.

-
I know Mike is a very solid investor and respect his opinions very much. So if he says pay attention to this or that - I will.
~ Dale G.
-
I've started managing my own investments so view Michael's site as a one-stop shop from which to get information and perspectives.
~ Dave E.
-
Michael offers easy reading, honest, common sense information that anyone can use in a practical manner.
~ der_al.
-
A sane voice in a scrambled investment world.
~ Ed R.
Inside Edge Pro Contributors

Greg Weldon

Josef Schachter

Tyler Bollhorn

Ryan Irvine

Paul Beattie

Martin Straith

Patrick Ceresna

Mark Leibovit

James Thorne

Victor Adair