
Gold & Precious Metals
Gold has performed very well under the circumstances of declining inflation and a surging US$ index. Since 2014 the US$ index is up nearly 18% while Gold is up 3%. Since Gold’s November low the US$ index is up over 10%. Had we known that at the time, we’d have thought Gold would be headed for $1000 and not the $1300 it recently hit. At present, the US$ index appears ripe for a correction or major pause in its uptrend. Given that Gold is priced in US$ and that Gold has shown strength in real terms, sustained US$ weakness could be a major boon for Gold and precious metals as a whole.
Before we get to the US$, I’d like to provide a comparison of Gold and Gold charted against foreign currencies. To create the foreign currency index we simply took US$ data and inverted it. Thus, we are charting Gold against the currency basket that comprises the US$ index. Over the past 15 years strength in Gold relative to foreign currencies has often preceded Gold strength in US$’s. Gold priced against foreign currencies bottomed in December 2013 and reached a 21-month high last week.

Gold vs. Foreign Currency Basket & Gold in US$
Let’s take a look at the US$ index. We plot the index and its distance from its 10, 40 and 80-week exponential moving averages. A market’s distance from various moving averages can signal overbought and oversold conditions. We highlight the points at which the US$ index has been most overbought. Considering the three oscillators as a whole, the US$ index is arguably at its third most overbought point since the US$ floated in 1971. The other times were at its peak in early 1985 and during the 2008 financial crisis.
US Dollar Index
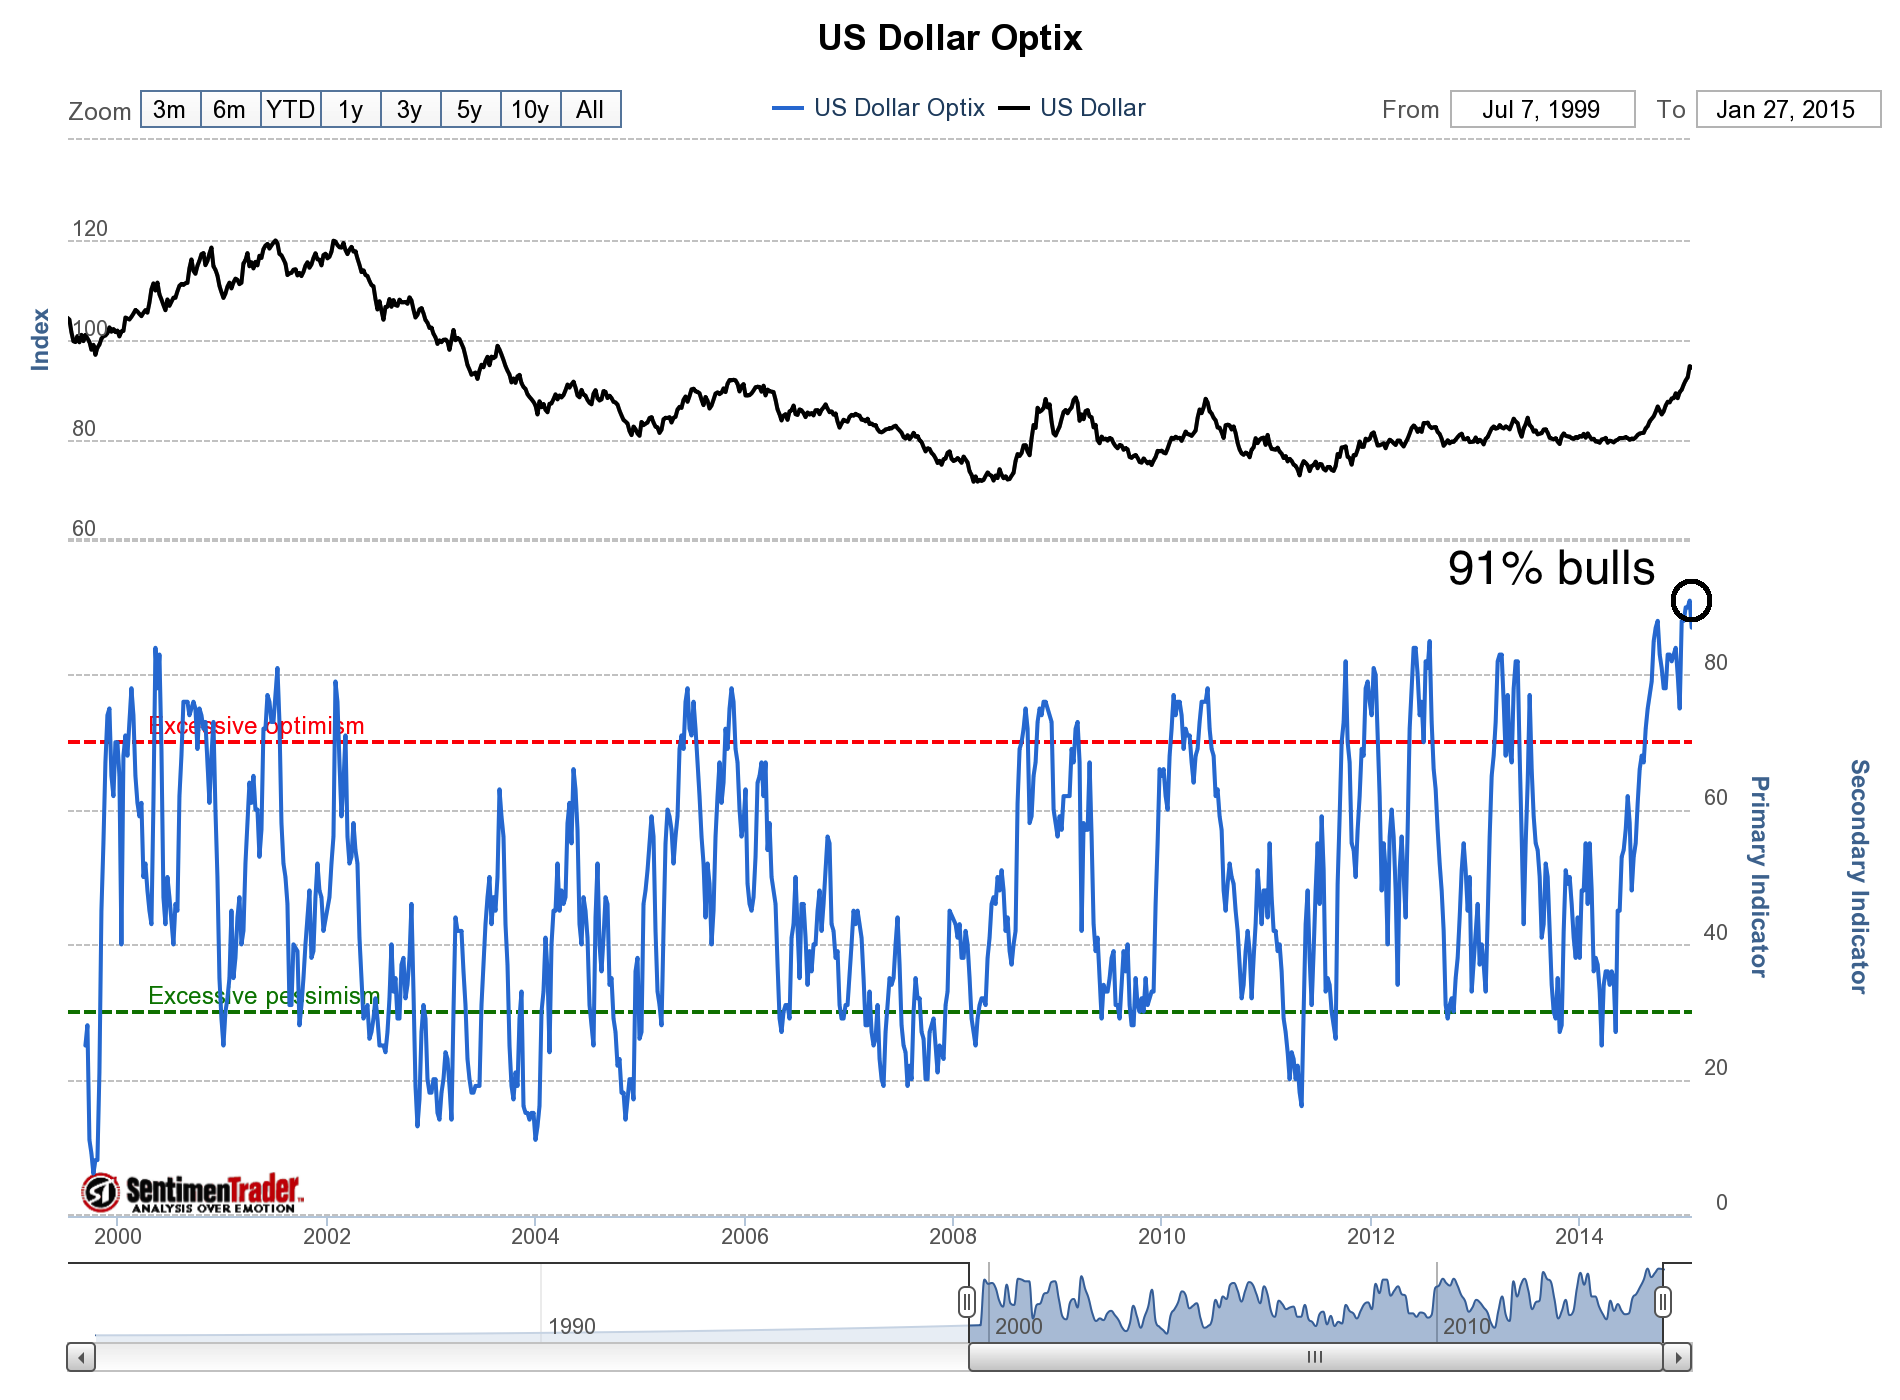
Meanwhile, sentiment on the US$ has reached a major extreme. Public opinion charted below (from sentimentrader.com) recently hit 91% bulls. That is the highest in 15 years. We should also note that the daily sentiment index for the US$ index hit 98% bulls a few weeks ago. That is the highest reading since May 2010. The US$ peaked a month later.
US Dollar Index Public Opinion
Gold has performed very well amid tremendous US$ strength and could get a further boost if and when the US$ weakens. The US$ index is extremely overbought and sentiment is extremely bullish. At the least it figures to correct or consolidate for a while. That could be Gold’s chance to begin its next leg higher and force the bears to capitulate. While recent correlations have been atypical, I find it hard to believe Gold doesn’t perform well if the US$ corrects. In the days and weeks ahead, the key support levels are GDX $20 and Gold $1240 to $1250. Consider learning more about our premium service which includes a report on the top 10 junior miners to buy.
Good Luck!
Jordan Roy-Byrne, CMT

Gold, like a slumbering giant, has come to life. After a three-year interruption of the great gold bull market, something remarkable is beginning to occur. You can see it in the chart below. The chart shows three stabs to the downside, but the latest dip completes a head and shoulders bottom, with gold now surging above both its moving averages. This is the start of the biggest story of the world monetary system for this generation. The giant of true money has reversed its decline and has broken out into the open!
Gold is the one currency that has been the cornerstone of wealth for 5000 years, and is still considered pure wealth today. Gold always retains value, while every paper currency system in history has failed. Foreign central banks are, right now, quietly building their hoards of gold, as they prepare for their next moves.
It is vital for all investors to understand the meaning of the monumental changes that are now upon us.

About Richard Russell
Richard Russell began publishing Dow Theory Letters in 1958, and he has been writing the Letters ever since (never once having skipped a Letter).
U.S. gold exports to Hong Kong and China jumped significantly in October. Not only were U.S. gold exports strong in October, they were the second highest for the year. Shipments of gold out of the U.S. spiked in January, declined in February and March and remained subdued during the summer months.
However, U.S. gold exports Jumped 70% In September, at 50.1 metric tons (mt), with the majority going to Switzerland (15.3 mt) and the United Kingdom (13 mt). If we look at the chart from the article linked above, U.S. gold exports to Hong Kong (8.5 mt) and China (3.3 mt) placed in the third and fourth position respectively:

Then in October, something interesting took place. According to recently released USGS Gold Mineral Industry Survey, the U.S. exported 51 mt of gold in October with a large increase going to Hong Kong, China and India.
As we can see from the chart above, U.S. gold exports to Switzerland gained a little in October, reaching 17.6 mt compared to 15.3 mt in September…. but the big increase came from Hong Kong (12.9 mt), China (7.4 mt) and India (6.1 mt). In addition, U.S. gold exports to the United Kingdom fell considerably from 13 mt in September to only 2 mt in October.
Now, if we look at U.S. gold exports over the past six months, we can see a striking change in October. From May to September, gold exports to Hong Kong, China and India were a quarter of total exports. However, these three countries accounted for 26.4 mt or 52% of all the U.S. gold exported in October, compared to 23% in September.

Furthermore, the 7.4 mt of U.S. gold exported directly to China was the highest monthly total I have ever seen going back several years. This increase of U.S. gold demand from Hong Kong, China and India was probably due to the big drop in the price of gold at the end of October when it fell from $1,250 on the 22nd of the month to a low of $1,160 on Halloween, the 31st.
It will be interesting to see how much gold was exported from the U.S. in November as the price of gold fell even further to a low of $1,130.
Please check back for new articles and updates at the SRSrocco Report.
Gold and Silver Trading Alert: Is the Rally in Gold Over?
Briefly: In our opinion speculative short positions (half) are currently justified from the risk/reward perspective.
Gold’s rally took place along with the U.S. dollar’s rally and this was encouraging for gold bulls, but gold’s reaction after the 1,140 billion euro QE program was announced was very disappointing. Is the rally over and will the gold market plunge once again?
In short, it’s possible, but not imminent. Let’s move right to the charts (charts courtesy of http://stockcharts.com).

Larger Image
Our previous comments on the USD Index and its link to gold remain up-to-date:
The USD Index rallied just like we’d been expecting it to. The breakout above the 2005 high was confirmed so the next move was likely to be to the upside and we didn’t need to wait long to see one. The USD Index soared as the euro declined on the QE news. The interesting thing about this rally is that it’s likely not over, as no resistance level was reached yesterday and the next significant resistance is above 96. That’s where we expect the USD Index to stop for longer or perhaps where this rally would end. The former seems more likely at this time.
Why didn’t gold decline despite a move higher in the USD Index? Because it was not the inherent strength of the U.S. dollar that caused the move – it was the weakness of the euro (let’s keep in mind that the USD Index is a weighted average of various USD-linked currency rates and the EURUSD pair has the weight of over 50%). Investors were getting out of the euro and some of them were buying U.S. dollars and some of them were buying gold – hence both assets went up.
Now, the USD Index moved much higher yesterday, but gold didn’t move much, which could mean that gold actually did not show strength by holding up well in spite of the USD’s rally, but that it showed weakness by not rallying more given the declining value of the euro.
Overall, we think the implications for gold are bearish at this time for the short term. Naturally, the European QE is a bullish piece of news for gold in the medium- and long term.
Please note that gold declined in today’s pre-market trading without a rally in the USD Index (in fact, the USD declined slightly).

Larger Image
On the long-term chart we can see what we’ve already written above – that gold moved just a little higher. Gold just got an excellent trigger to move higher – above the long-term resistance line – and it didn’t work. Gold didn’t break out. We view it as a bearish sign.
Gold indeed declined after the bearish sign and it could be on its way to form the final bottom close to the long-term cyclical turning point.

Larger Image
Our previous comments remain mostly up-to-date:
We finally saw some strength in gold, which might seem encouraging until you recall what caused the move. The move was “supposed to” be bigger given the announcement. The size of the move is something that looks like it’s about to be erased and the breakout seems likely to be invalidated. At this time we think that 2 additional daily closes would be required above the 61.8% Fibonacci retracement until we can say that the breakout is confirmed and that higher prices are likely.
Gold is already lower and back below the 61.8% Fibonacci retracement. The invalidation is a bearish signal on its own and is quite likely to lead to further declines. The short positions in the precious metals sector that we opened based on Thursday’s closing prices (gold closed at $1,302 on Thursday; the alert was sent/posted before the markets opened on Friday) are already profitable.
Will gold fall further?

Larger Image
The chart featuring the gold to USD Index ratio clearly suggests so. The ratio moved a bit higher recently, but didn’t manage to move back above the strong resistance created by the 2013 low and the 2008 high. The medium-term trend remains down.

Larger Image
On Friday we wrote the following:
We have a similar situation in silver. The white metal moved higher, but only slightly above the 2013 low. The breakout could be invalidated any day now, especially given the size of the rally and comparing it to what caused it.
We have just seen an invalidation of the breakout as silver moved visibly back below the 2013 low. We wrote about silver’s “ability” to “break out” before declining once again multiple times in the past so those who have been following our analysis for some time should not be surprised by this invalidation. The implications are bearish.
There was no breakout in gold stocks, which was one of the factors that made us doubt the breakout in silver.

Larger Image
In the previous alerts we wrote the following:
The 3 important resistance levels intersect close to the 210 level: the 61.8% Fibonacci retracement, the 50-week moving average, and – most importantly – the declining long-term resistance line. If gold stocks manage to break and confirm the breakout above this level, it might serve as a confirmation that another major upswing is underway. For now, the current rally looks similar to the corrections that we saw in July 2013, in late-2013 to early-2014, and in June 2014.
This resistance (combination of resistances) was reached (…). The HUI Index is either about to break out or about to decline once again. Since there has been no breakout so far, the odds are that it will decline once again.
We already saw a decline yesterday (which was more visible than the one seen in gold), so we have a small indication that we’ll see another decline shortly. To be honest, that’s not a strong indication. Since gold stocks reached a strong resistance after a visible rally, then a pullback is to be expected and is not necessarily a sign of big weakness. It is more bearish than not, though.
Yesterday, gold stocks had a good reason to rally (Euro-QE announcement) but they didn’t – they declined. Consequently, it seems that the decline was indeed indicating weakness in the precious metals market.
As soon as the HUI Index moves back below its 2013 low and this move is confirmed, it will make further – significant – declines much more likely.

The HUI to gold ratio has already closed back below its 2013 low, so the bearish indications are present.
Summing up, based on the announcement of the QE program in the Eurozone, the situation in the precious metals market improved for the medium and long term, but based on the gold’s, silver’s and – most importantly – mining stocks’ reaction, the outlook deteriorated for the short term. Today’s bearish action in the precious metals confirms the above.
It seems that keeping the short positions in the precious metals is justified from the risk/reward perspective at this time as the profits on them are likely (in our opinion) to become even bigger. The trade is risky, so we are still using a limited amount of capital. We will likely increase it if we see additional bearish confirmations in the coming days.
We will be re-evaluating these positions on a daily basis. As always, we’ll keep our subscribers updated should our views on the market change. We will continue to send them our Gold & Silver Trading Alerts on each trading day and we will send additional ones whenever appropriate. If you’d like to receive them, please subscribe today or sign up for our free mailing list today.
To summarize:
Trading capital (our opinion): Short positions (half) in gold, silver and mining stocks with the following stop-loss orders and initial (!) target prices:
Gold: initial target level: $1,245; stop-loss: $1,318, initial target level for the DGLD ETN: $64.60 ; stop loss for the DGLD ETN $55.00
Silver: initial target level: $16.73 ; stop-loss: $18.63, initial target level for the DSLV ETN: $55.63 ; stop loss for DSLV ETN $41.94
Mining stocks (price levels for the GDX ETN): initial target level: $20.40 ; stop-loss: $24.23, initial target level for the DUST ETN: $15.55 ; stop loss for the DUST ETN $9.28
In case one wants to bet on lower junior mining stocks’ prices, here are the stop-loss details and initial target prices:
GDXJ: initial target level: $25.43 ; stop-loss: $32.17
JDST: initial target level: $10.50 ; stop-loss: $5.19
Long-term capital (our opinion): Half positions in gold, half positions in silver, half position in platinum and half position in mining stocks.
Insurance capital (our opinion): Full position
You will find details on our thoughts on gold portfolio structuring in the Key Insights section on our website.
Thank you.
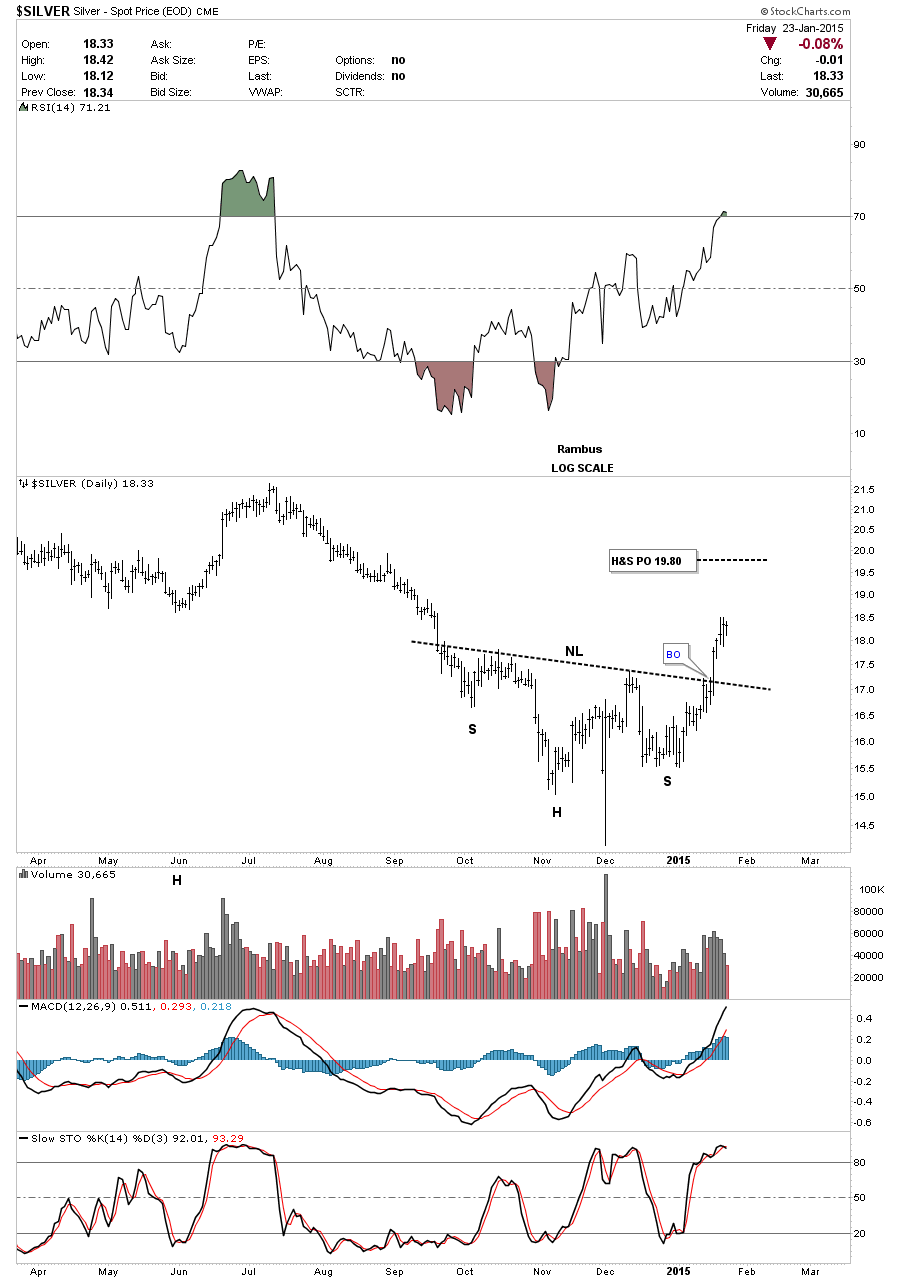
Five days ago silver broke out of an inverse H&S bottom that has temporarily reversed the downtrend. I measured the more conservative price objective using the higher low instead of the Swiss spike low which comes in around the 19.80 area on the log chart. It will be interesting to see if the Swiss spike low will be the ultimate low for the bear market or just a short to intermediate low. Sometimes big trends can end with one last shake out of the weak hands similar to the Swiss spike low.
Larger Image
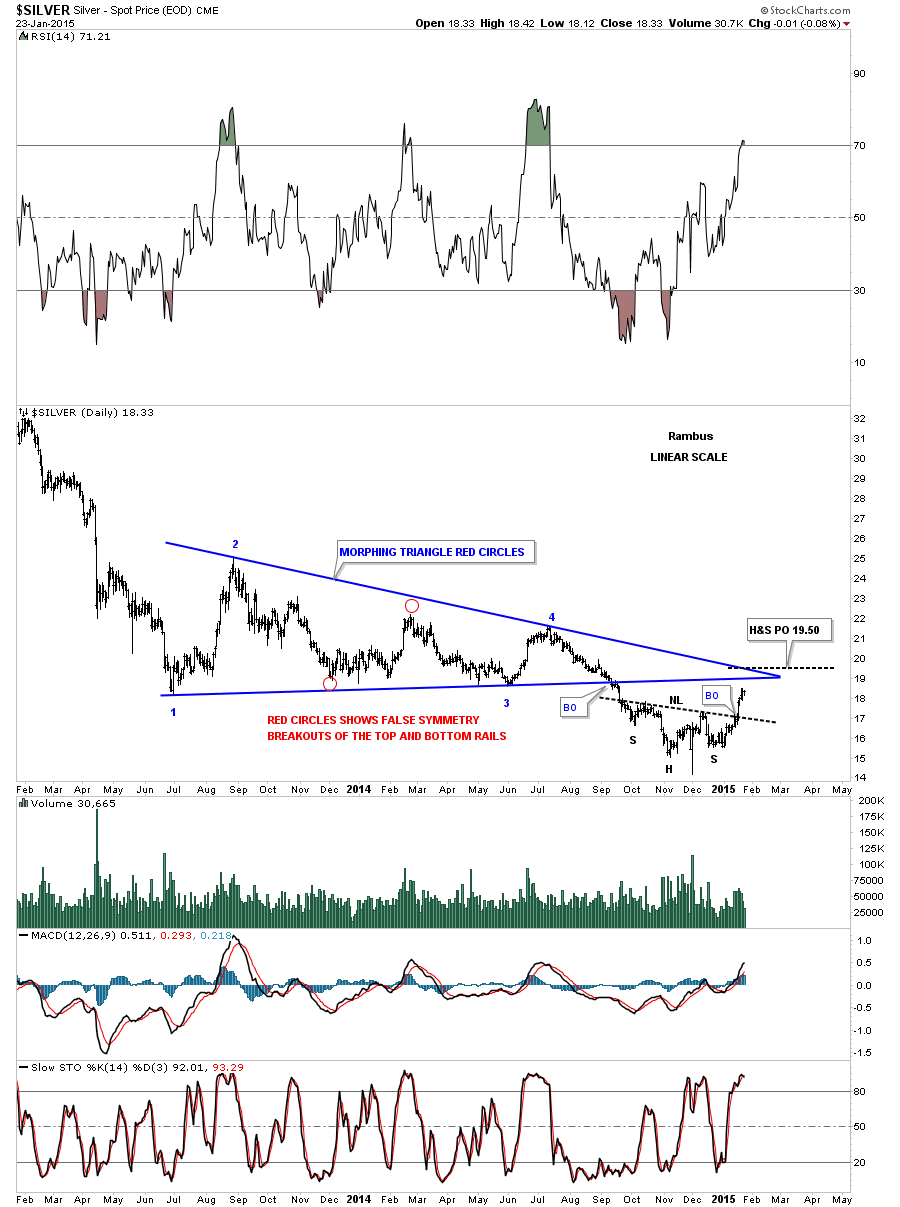
Below is a two year chart for silver that shows its big triangle consolidation pattern that did a little morphing before it finally broke down in September of last year as shown by the red circles. Since the breakout silver has built out an inverse H&S bottom and is now in rally mode. As you can see on the chart below silver is approaching two very important trendlines from the big blue triangle consolidation pattern. The price objective of that inverse H&S bottom comes in around the 19.50 area which is slightly above the apex. One thing we need to keep in mind is that the inverse H&S bottom is a reversal pattern that can reverse a downtrend. It’s way too early yet to think about a reversal of the bear market but if silver can ever trade above the apex of the blue triangle that would be the first step in the right direction.
Larger Image
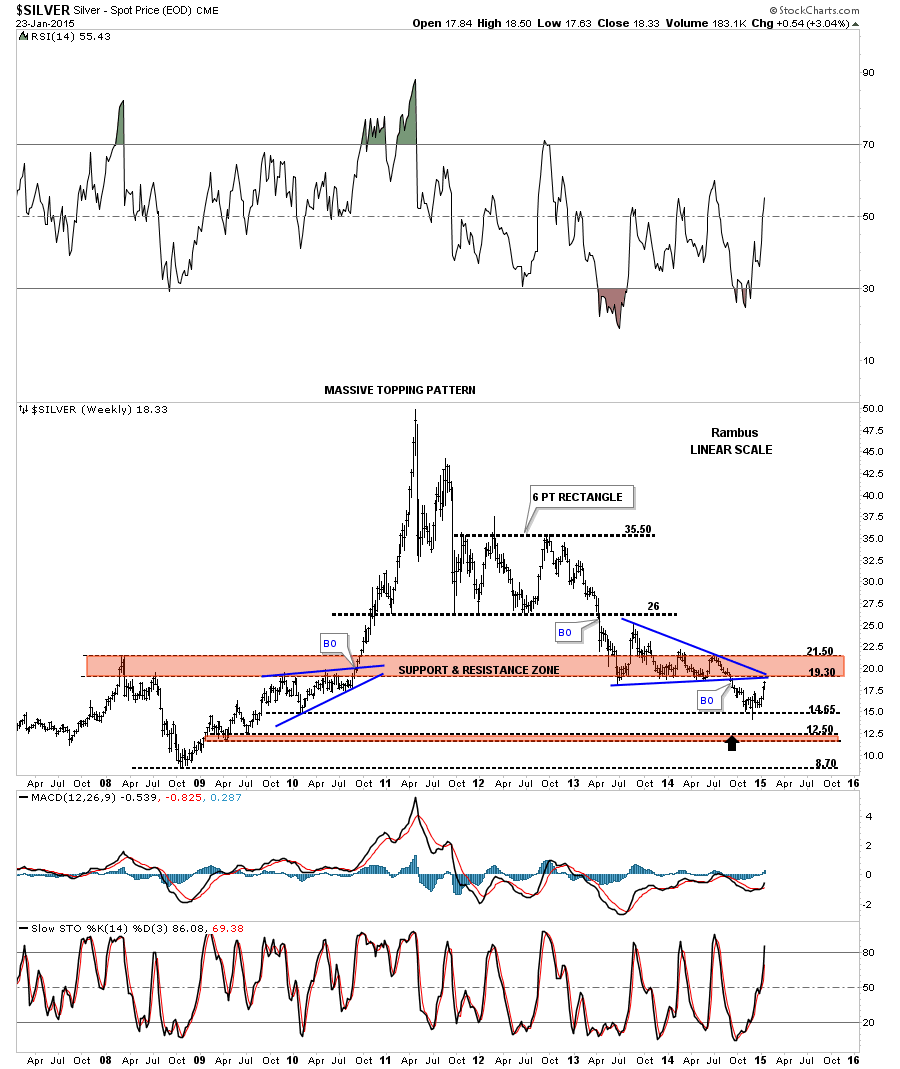
This long term weekly chart for silver shows it bouncing off of the next lower support line at 14.65 with the Swiss spike low. Now it’s entering into the brown shaded support and resistance zone which is just over head. Bottom line is silver has to have more buyers than sellers to overcome which looks like strong resistance overhead.
Larger Image
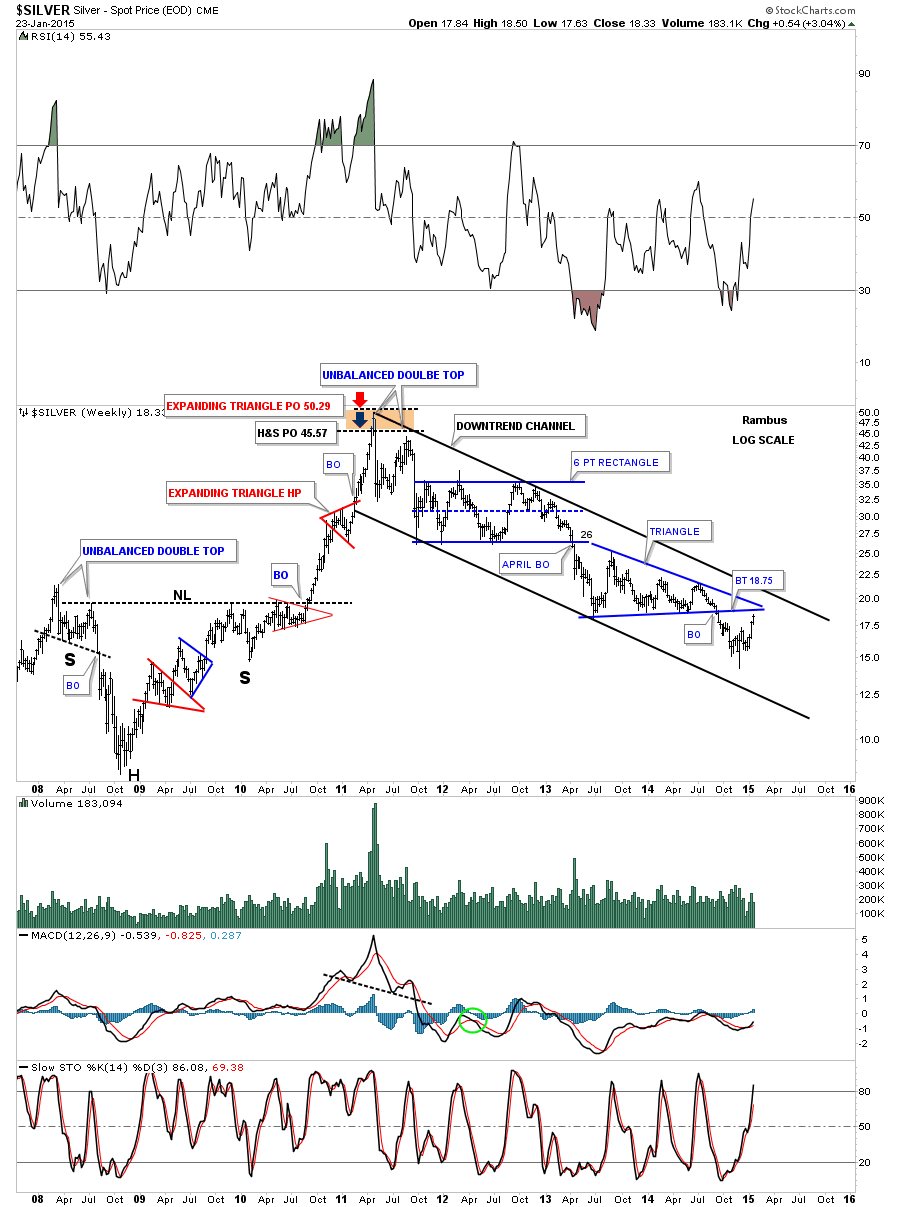
This next long term weekly chart for silver shows the parabolic rally phase into the April 2011 top which ended the bull market. From the bull market top silver has been trading in a parallel down trend channel for almost four years now which is a pretty lengthy move in one direction. Again it’s up to the bulls to reverse this downtrend channel in a similar fashion to the way they did back in 2008 crash low. You can see the price objective to the 50 area in 2011 using two different patterns. The inverse H&S bottom had a price target up to 45.75 and the red expanding triangle halfway pattern had a price objective up to 50. Impulse moves like that are mush easier to trade than these big 18 month consolidation patterns.
Larger Image
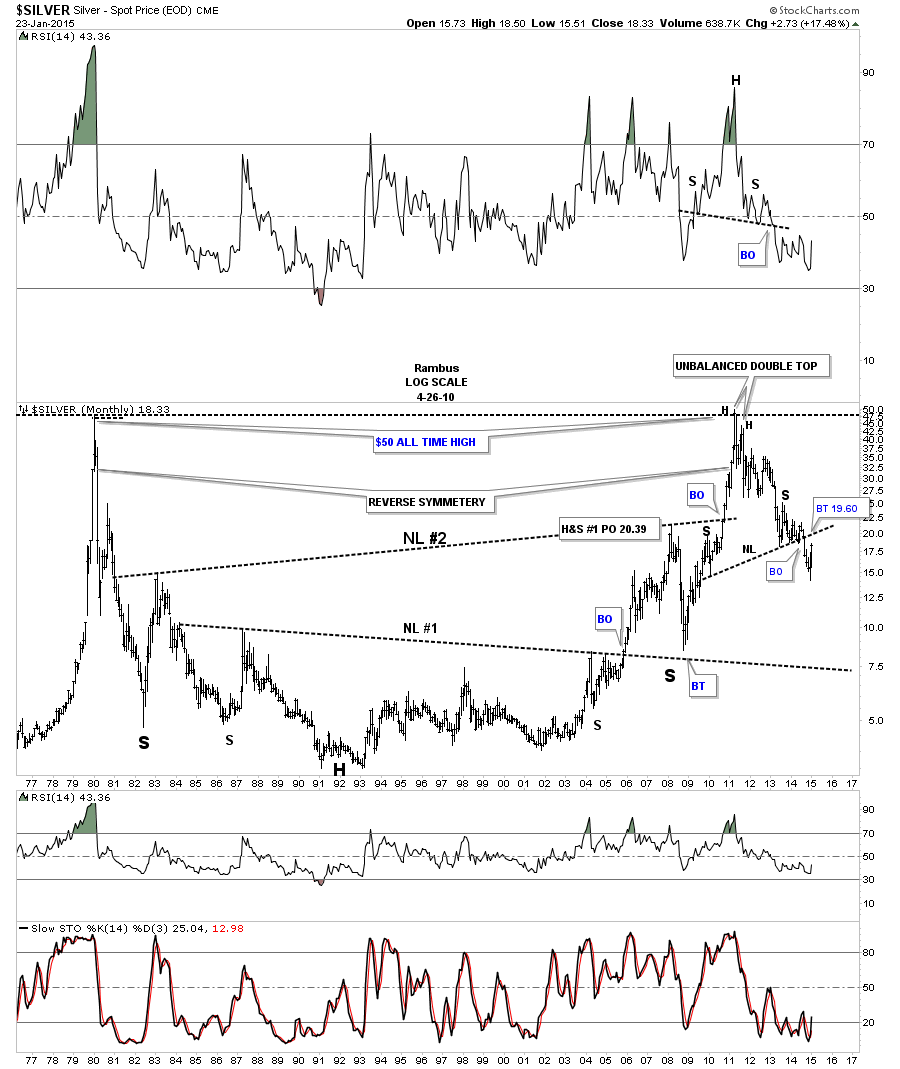
This last chart for silver is a 40 year look that shows its bull market top in 1980 and the decline that followed and the long drawn out sideways trading range that went on for many years. There is actually some very nice symmetry on the left and right side of the chart as shown by the big necklines. We’ve been following a potential very large H&S top where the price action broke below the neckline about six months ago. It’s now attempting to backtest the neckline to the 19.60 area which will be critical resistance. At least you have some perspective of where silver was in the past and how it relates to the present which is important to know.
In the Weekend Report we’ll take a good hard look at some of the Kamikaze stocks to try and gain some insight on what is taking place right now with these volatile stocks. All the best…Rambus
Larger Image

-
I know Mike is a very solid investor and respect his opinions very much. So if he says pay attention to this or that - I will.
~ Dale G.
-
I've started managing my own investments so view Michael's site as a one-stop shop from which to get information and perspectives.
~ Dave E.
-
Michael offers easy reading, honest, common sense information that anyone can use in a practical manner.
~ der_al.
-
A sane voice in a scrambled investment world.
~ Ed R.
Inside Edge Pro Contributors

Greg Weldon

Josef Schachter

Tyler Bollhorn

Ryan Irvine

Paul Beattie

Martin Straith

Patrick Ceresna

Mark Leibovit

James Thorne

Victor Adair