
Gold & Precious Metals
 In what could be described as a rather stunning move, the Swiss National Bank (SNB) has decided to cut the interest rate on sight deposits at the SNB into negative territory. This move was necessary to defend the currency against renewed speculative positions which pushed the EUR/CHF exchange rate down again, thus increasing the pressure on the Swiss economy. As the volatility on the financial markets moved up, market participants were once again running towards the Swiss Franc as it’s still considered to be one of the few ‘safe haven’ currencies out there….

 Identifying over-arching trends is integral to successful fundamental investing. The folks at Visual Capitalist created a fascinating breakdown of some of the key macro-trends of the past year. “Motif investing enables you to invest in the world around you…….”

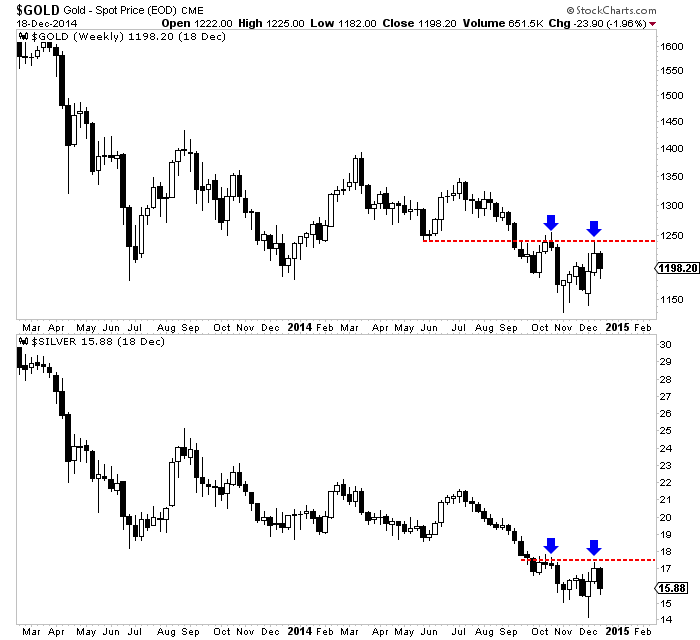
 The gold and silver stocks have put in a bullish weekly reversal but gold and silver have not confirmed it. The interplay between the metals and the shares has been complicated in recent weeks.
Gold and silver are charted below in weekly candle format. Before this week the metals looked bullish. Each tested support and rebounded strongly towards resistance. However, both metals gave back much of the recent gains. Bulls would say they are correcting and still in position to test resistance. Bears would say the metals failed to reach resistance and are headed to new lows.
Though the mining stocks are selling off today (Friday), they’ve completed a bullish reversal and double bottom on most weekly charts. Below we plot GDXJ, GDX and our Top 40 index. Other than GDXJ just about every miner index has completed a double bottom. Though GDXJ made a new low it did form a bullish reversal. GDX and the Top 40 index formed bullish hammers and potential double bottoms. We say “potential” double bottoms for a reason. The double bottom is a very bullish pattern in which the market should explode up from the second bottom. Only time will tell if the miners follow that path or if the reversal fizzles.
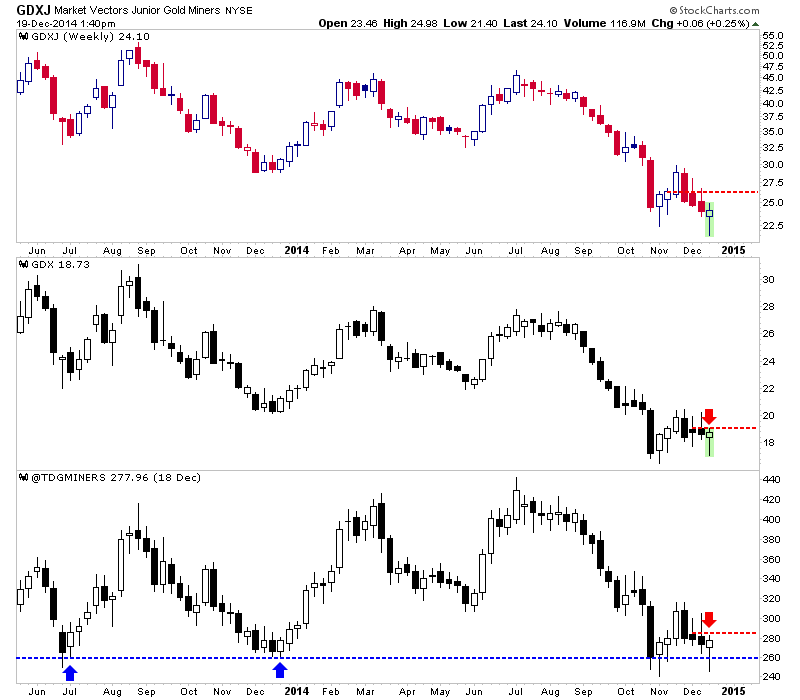
Interestingly, the metals and the miners have been disjointed in recent weeks. Gold lost 2% this week while Silver lost 6% yet the miners put in a positive reversal. During the two prior weeks metals rebounded strongly yet miners sold off. Part of that could be tax loss selling in the miners which has created additional weakness.
Investors and traders have a good setup in the miners. Downside support is defined by the double bottom. A weekly close below that could be the stop out point and would limit losses. Meanwhile, if the metals are destined to take out their October highs then the miners should explode higher sooner rather than later. After 2013 tax loss selling, GDXJ rebounded over 50% within two months. We are working hard to prepare subscribers for this opportunity.
The Daily Gold
Today’s videos:
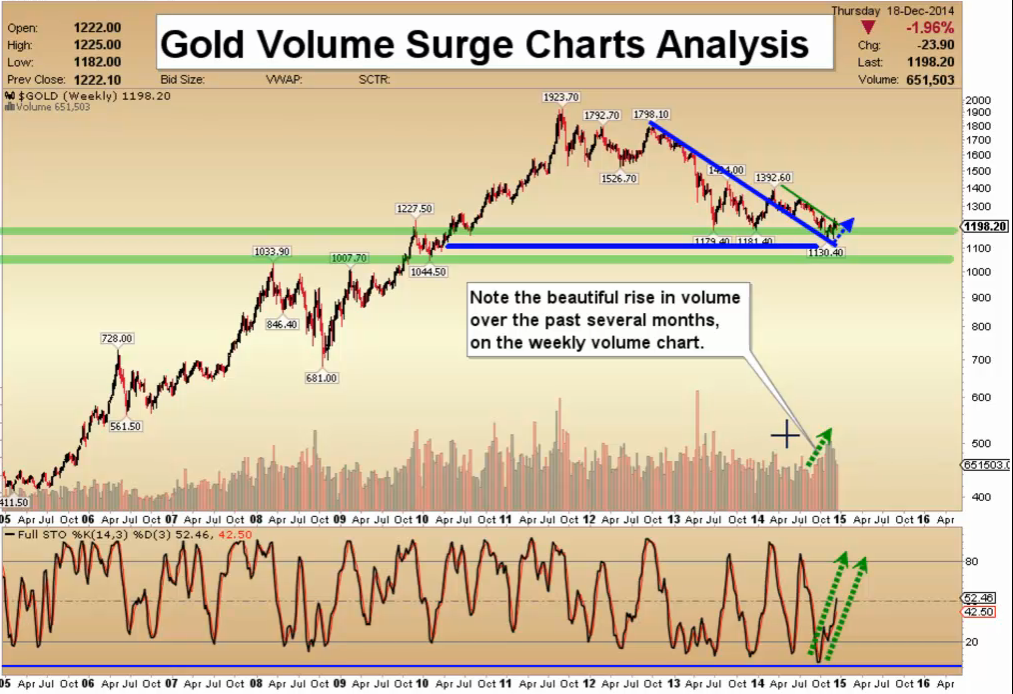
Gold Volume Surge Charts Analysis
Silver Short Term Buy Signal Charts Analysis
FXI Century Of China Charts Analysis
GDX Happy New Year Charts Analysis
GDXJ Bull Wedge Charts Analysis
Thanks,
Morris
Super Force Signals special offer for Money Talks Readers:
Send an email to trading@superforcesignals.com and I’ll send you 3 of my next Super Force Surge Signals free of charge, as I send them to paid subscribers. Thank you!
The SuperForce Proprietary SURGE index SIGNALS:
25 Surge Index Buy or 25 Surge Index Sell: Solid Power.
50 Surge Index Buy or 50 Surge Index Sell: Stronger Power.
75 Surge Index Buy or 75 Surge Index Sell: Maximum Power.
100 Surge Index Buy or 100 Surge Index Sell: “Over The Top” Power.
Stay alert for our surge signals, sent by email to subscribers, for both the daily charts on Super Force Signals at www.superforcesignals.com and for the 60 minute charts at www.superforce60.com
About Super Force Signals:
Our Surge Index Signals are created thru our proprietary blend of the highest quality technical analysis and many years of successful business building. We are two business owners with excellent synergy. We understand risk and reward. Our subscribers are generally successfully business owners, people like yourself with speculative funds, looking for serious management of your risk and reward in the market.
Frank Johnson: Executive Editor, Macro Risk Manager.
Morris Hubbartt: Chief Market Analyst, Trading Risk Specialist.
website: www.superforcesignals.com
email: trading@superforcesignals.com
email: trading@superforce60.com
SFS Web Services
1170 Bay Street, Suite #143
Toronto, Ontario, M5S 2B4
Canada

-
I know Mike is a very solid investor and respect his opinions very much. So if he says pay attention to this or that - I will.
~ Dale G.
-
I've started managing my own investments so view Michael's site as a one-stop shop from which to get information and perspectives.
~ Dave E.
-
Michael offers easy reading, honest, common sense information that anyone can use in a practical manner.
~ der_al.
-
A sane voice in a scrambled investment world.
~ Ed R.
Inside Edge Pro Contributors

Greg Weldon

Josef Schachter

Tyler Bollhorn

Ryan Irvine

Paul Beattie

Martin Straith

Patrick Ceresna

Mark Leibovit

James Thorne

Victor Adair