
Gold & Precious Metals
 It’s not just surfers who scrutinize wave patterns. Steven Hochberg, chief market analyst at Elliott Wave International, uses the Wave Principle to predict the movements of commodities and the stock market based on a number of factors, including sentiment. In this interview with The Gold Report, he reads the waves and sees indications that the stock market is headed for a downtrend, while commodities will move up, although not in a direct line.
The Gold Report: You have warned that the S&P 500 and NASDAQ are in retreat and that we are entering a bear market that our grandkids will have to live through. What are the signs of that?
Steven Hochberg: The retreat hasn’t been very big so far, but we see a couple of signs that its start is imminent.
First, we look at all markets through our model, which is called the Wave Principle. It is based on R.N. Elliott’s discovery that waves of social mood, from optimism to pessimism and back to optimism, create specific patterns. We believe the market is at the end of its long rally because that wave pattern is coming to its terminal point. That’s the main indicator.
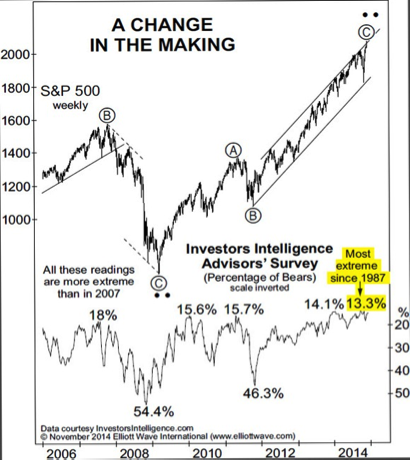
But we also look at other indicators to confirm or refute what we’re seeing. Many indicators are confirming that we’re in the end stages of the rally that started in 2009. Sentiment is one. Sentiment tends to get very extreme at trend reversal points. It is extremely optimistic at highs and extremely pessimistic at lows. The bears shrink down to almost nothing when you’re coming into a rally high. A service called Investors Intelligence tracks the percentage of bulls and bears among advisers. Recently, the bear contingent shrank down to 13.3%, which was the lowest in 27 years.
Another indicator is the percentage of money and money market funds relative to assets. That number is at a historic low. That means managers don’t feel that they need to hold anything back in reserve in case of a market decline. They’re fully invested with this market. The exact opposite happens at lows. At the lows in 2002 and 2009, managers had a huge percentage of their money in money market funds, the reason being that the market had been going down and they were scared. Now, we’re at the opposite end.
Internally, the market is starting to thin. The rally is narrowing. For example, the small-cap sector, as indicated by the Russell 2000 Index, made its closing high in March 2014, and it has not confirmed the Dow’s rally to a new high or to the NASDAQ. This narrowing is typical at the end of a stock rally, until finally only a couple of sectors are going up. Then, everything rolls over and goes to the downside. That is where we’re arriving at in this cycle. I think the next major move for stocks will be to the downside.
TGR: What does this transition look like? Will small caps and large caps be affected differently during the transition?
SH: Initially, perhaps, but eventually they will go down together.
The small-cap sector, which represents the higher-beta, less-liquid stocks within the overall market, tends to top out a bit sooner.
We look at the ratio of small caps to large caps by dividing the Russell 2000 by the Russell 1000 Index. It has been nine months since the Russell 2000 hit its high. Since then, the ratio is down 11%. During that same time, the blue chips have been making higher highs. That ratio has a succession of lower lows and lower highs. It’s in a downtrend. That’s a key signal that the market is thinning and ready to go down. When the blue chips roll over, both will be aligned on the downside.
TGR: On Nov. 11, you issued an interim report that said for the first time in three years your charts were indicating that a significant countertrend rally was at hand. What are the Elliott Waves telling you?
SH: That was a countertrend rally specific to gold—a fascinating market that we have followed and will continue to follow closely.
Gold topped out in September 2011 at a $1,921/ounce ($1,921/oz) spot price and has declined pretty persistently until now. It went sideways in late 2013 into early 2014, but the Elliott Wave pattern that we were following suggested gold would go down again, and it has.
We’ve been forecasting these waves of optimism and pessimism as they’ve been unfolding to the downside in gold. For the first time in three years, we were able to count a complete declining Elliott Wave pattern from gold’s 2011 high. That’s why we issued a combined interim report from our two main newsletters, The Elliott Wave Theorist, written by Robert Prechter, and The Elliott Wave Financial Forecast, which I write with my partner, Peter Kendall. This was only the second combined interim report that we’ve put out in our history. We did it because we saw extremes in sentiment that suggested to us the start of an impending gold rally. I think that rally is in its very infancy right now. Ultimately, it’s going to carry gold higher. I think gold has upside potential from here.
TGR: You talk about the importance of sentiment in your analysis, but different parts of the investing market act differently. What is the role of small traders versus goldbugs and institutions in both bear and bull rallies? Who turns first?
SH: That’s a good question, and it’s interchangeable.
We here at Elliott Wave International are goldbugs because we believe that gold—as it has been for centuries—is true money.
In the context of our report, which came out two trading days after gold’s recent low, we were referencing goldbugs as investors who were never going to turn bearish on gold; people who were forecasting $5,000/oz, $10,000/oz gold. Eventually, we’ll probably get there, but nothing is straight up.
We’re trying to take a more pragmatic approach, a tactical approach based on what the waves tell us. For example, sentiment, which is a big part of the gold sector, had gotten very extreme. Several days before gold hit its all-time high in September 2011, the Daily Sentiment Index, put out by trade-futures.com, moved to a record high of 96% on a five-day average. That means virtually all the traders thought gold was going higher. To us, this extreme ebullience was consistent with a high. Fast forward to today, the Daily Sentiment Index of traders had fallen to a record low of 5%. That was significant.
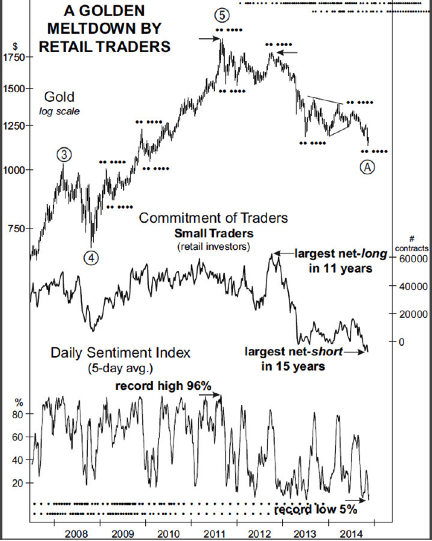
For small traders, the Commodity Futures Trading Commission (CFTC) tracks futures and options traders. The weekly Commitment of Traders Report chops the market into three cohorts: small traders whose positions are so low they really don’t have to report to the CFTC; the large speculators; and the commercials, or the insiders. Each cohort moves in its own ways.
For example, when gold was at $1,800/oz in October 2012—which was a countertrend rally high, in other words a lower high than it was in 2011—small traders had moved to the greatest net long in 11 years in futures and options. Even though gold was not at a new high, the small traders were more bullish than they were at the high. Now, small traders have gone from that October 2011 largest net long in 11 years to recently having their largest net short position in 15 years. Gold is down 37% and the small traders are betting it’s going to continue to the downside. Just as they were wrong in October 2012, we think they’re going to be wrong here at this low.
TGR: Based on that, what is your target price for gold in 2015?
SH: I think a reasonable target price is in the $1,440–1,525/oz range. We’ll be able to refine that as we see the wave structure unfold and do our internal calculations. Based on what the Elliott Waves are showing, I think this is a countertrend rally.
Major declines typically have an ABC pattern. You have your A wave down, then you have a B-wave rally that retraces a percentage of the preceding decline and then you go down in a C wave to make what is the final low in an ABC pullback, or decline.
We think that November’s low is the A wave, that initial leg down, to be followed by a B-wave rally. The A wave lasted from September 2011 to November 2014. The B wave will probably last well into 2015, if not all year.
TGR: What do the charts tell you about silver?
SH: Silver will move more or less with gold. As gold rallies in its B wave, silver will rally in its equivalent B wave. A reasonable target price would be around $22.50/oz, maybe up to $26/oz in the countertrend rally. It’s going to take a couple of months to get up there.
TGR: Are you also positive on the platinum group metals?
SH: Yes, they should go higher, too. So will oil most likely, although we think oil will decline further before the rally. Once that rally gets going, it would not be unreasonable to see oil at $84/barrel, maybe $95. That’s probably a reasonable target in a countertrend rally, but first we have to get a low in place.
TGR: Is oil more difficult to predict because there are so many political factors at play?
SH: We don’t think that outside factors cause markets to move. We think outside news events are simply the result of socio-psychological forces that have already occurred and have already been reflected in the waves.
We think movements are endogenous. They’re internal. As people get more pessimistic or optimistic, their behavior traces out waves. The news reports that you read are simply after-the-fact accounts of people’s emotions, or waves, of optimism and pessimism that have already been expressed.
The Elliott Waves look pretty clear in oil, as well as gold and silver.
TGR: Is the recent downside in commodities more about the strength of the U.S. dollar than what’s actually happening in the commodities sector?
SH: I would say the trends in commodities and oil and trends in the dollar are more coincident than causal.
Since May, the commodity markets have been down and the dollar has been rallying very strongly, giving the appearance that it’s all due to the dollar going up and the commodities going down relative to dollars. But all correlations or movements tend to be time dependent.
By that I mean there are times when they move apart as they are right now, and there are times when they move together.
For example, from January through November 2005, the dollar was rallying; it was up 15%. Commodities in the CRB Index were up 17%. Both were moving together. Today, they’re moving apart. It appears that one is causing the other, but I think they’re really coincident moves at this point.
TGR: What do your charts tell you about the prospects for the dollar versus the yen and the euro in 2015?
SH: In the longer term, we’re very bullish on the dollar.
The dollar made its low in 2008 and has quietly been creeping higher. Longer term, I think the dollar will go higher because we’re going into a deflationary environment. That’s significant for the dollar because most of the debt in the world is denominated in dollars. Debtors will need dollars to pay their debts, whether that happens through repayment, default, restructuring or whatever.
Having said that, the dollar has had a major run since May. In terms of the Elliott Wave structure, it appears that we’re in the very latter stages of a five-wave rally from the May low. Just as gold had a five-wave decline and came into a low and is now due for a big B-wave rally. Something similar could be said for the dollar, but in the opposite direction.
The dollar is in the late stages of a five-wave rally and sentiment is extreme. The Daily Sentiment Index hit 95% on Nov. 6. That means only 5% of the traders thought the dollar was going to go down; 95% thought it would continue to rally. The fact that this extreme sentiment is occurring in the fifth wave of a five-wave move suggests to us that we’re in for a correction in the dollar. So, while we are bullish longer term, it’s not going to be a straight line. We’ve had a great run-up. We’re due for a correction in the coming months.
TGR: In light of these trends, what is the optimum strategy for investors going into 2015?
SH: That’s a tough question to answer. The value of a lot of assets goes down in a deflationary environment. The metals are down from 2011, oil is down from 2008, commodities are down from 2008, the 10-year Treasury note is down from a high in July 2012. A lot of markets and asset classes are already deflating. Even though we expect a countertrend rally in some of these assets, it will be a difficult rally to play. When the U.S. stock indexes roll over, there will be an across-the-board deflation in which a lot of assets go down together. Fashioning a strategy is very difficult in this type of environment.
We are telling our subscribers to be safe in 2015. If that means cutting back on stocks or increasing short-term Treasury holdings—do what you believe will keep you safe.
I think safe means probably short-term Treasuries, even though they’re not paying you anything. If you have to be in stocks, be as defensive as possible. I like gold for money you want to speculate with on a shorter-term basis. A gold rally is likely to unfold over several months.
TGR: Steven, thank you for your time and your insights.
Readers can get a free copy of “Gold & Silver: How to Use the Wave Principle to Identify Actionable Opportunities” here.
 Steven Hochberg is chief market analyst for Elliott Wave International. He is also the co-editor of The Elliott Wave Financial Forecast, a monthly financial newsletter, as well as editor of The Short Term Update, a three times a week online market forecasting service. Hochberg began his career with Merrill Lynch & Co. and joined Elliott Wave International in 1994, where he quickly established a stellar reputation providing analysis to large institutional traders and hedge funds. Hochberg is a sought after speaker and has been widely quoted in various media outlets such as USA Today, The Los Angeles Times, The Washington Post, Barron’s, Reuters and Bloomberg and has been interviewed numerous times for his market views by CNBC, MSNBC and Bloomberg Television.
Want to read more Gold Report interviews like this? Sign up for our free e-newsletter, and you’ll learn when new articles have been published. To see a list of recent interviews with industry analysts and commentators, visit our Streetwise Interviews page.
DISCLOSURE:
1) JT Long conducted this interview for Streetwise Reports LLC, publisher of The Gold Report, The Energy Report, The Life Sciences Report and The Mining Report, and provides services to Streetwise Reports as an employee.
2) Steven Hochberg: I was not paid by Streetwise Reports for participating in this interview. Comments and opinions expressed are my own comments and opinions. I determined and had final say over which companies would be included in the interview based on my research, understanding of the sector and interview theme. I had the opportunity to review the interview for accuracy as of the date of the interview and am responsible for the content of the interview.
3) Interviews are edited for clarity. Streetwise Reports does not make editorial comments or change experts’ statements without their consent.
4) The interview does not constitute investment advice. Each reader is encouraged to consult with his or her individual financial professional and any action a reader takes as a result of information presented here is his or her own responsibility. By opening this page, each reader accepts and agrees to Streetwise Reports’ terms of use and full legal disclaimer.
5) From time to time, Streetwise Reports LLC and its directors, officers, employees or members of their families, as well as persons interviewed for articles and interviews on the site, may have a long or short position in securities mentioned. Directors, officers, employees or members of their families are prohibited from making purchases and/or sales of those securities in the open market or otherwise during the up-to-four-week interval from the time of the interview until after it publishes.

Is the halt of QE3 the end of the loose monetary policy?
The end of QE3 neither implies the real abandon of purchasing assets (due to reinvesting interest and principal payments and rolling over retiring Treasuries) nor the permanent exclusion bond-buying programs from the tools of monetary policy. Investors should also be aware that the end of QE3 does not rule out loose monetary policy. Why?
The reason is that the quantitative easing regime is only one measure in the central banks’ arsenal of monetary policy instruments. Other unconventional monetary policies are: interest rates kept very low for a significant amount of time, signaling lower market expectations for lower interest rates in the future and credit or qualitative easing, i.e., purchasing not only government bonds, but also private sector assets (e.g., related to real estate markets). These instruments did not change and are not going to change in the immediate future. Although Charles Plosser, the President of Federal Reserve Bank of Philadelphia and a voting member of the policy-setting Federal Open Market Committee, said recently that the U.S. central bank should raise short-term interest rates rather sooner than later, the Committee wrote in its latest statement that the interest rates will remain extremely low for a “considerable time”. It is worth recalling in this context that the low real interest rates are one of the most important drivers of the gold price, as we explained in one of the previous editions of the Market Overview.
The Fed is unwilling to hike low interest rates too soon, so its balance sheet will not change for a while. According to the “stock view” accepted by the U.S. central bank, the long-term interest rates are influenced by the total stock of securities held, not the flow of new purchases. Since the Fed is still going to hold these assets, investors should expect long-term interest rates to remain low. As we can read in the Fed’s press release from September 17, 2014, “the Committee expects to cease or commence phasing out reinvestments after it begins increasing the target range for the federal funds rate; the timing will depend on how economic and financial conditions and the economic outlook evolve.” So, in a sense, this is all about the proper signaling. According to William Dudley, the President of the New York Federal Reserve Bank, shrinking the balance sheet could inadvertently convince markets that interest-rate hikes were imminent. On the other hand, some think that the U.S. central bank has to reduce its balance sheet and commercial banks’ excess reserves to make the federal funds rate effective. Otherwise, the fed funds rate would no longer send signals across the yield curve because banks do not need interbank loans with so much liquidity from the QE.
The Fed has bought assets worth $3 trillion in the last six years. Purchasing has stopped, but do not confuse this with a monetary tightening. The Fed is not filling up the financial hole left by its expansionary monetary policy. It has only stopped digging itself deeper. Not surprisingly it has to be a gradual process – the U.S. central bank cannot just dispose of bonds worth $3 trillion at once as this would decrease asset prices and raise long-term interest rates. And the very probable scenario is that Fed will not actively sell its holdings of assets, but will instead allow the portfolio to shrink as bonds mature.
But let’s leave aside the Fed’s future exit strategy and emphasize once again that the end of QE3 is not monetary tightening. It will be obvious if we accept the opinion that QE3 was actually never a form of expansionary monetary policy, but rather a way to support equity markets and bail out financial institutions, because it removed some of the riskiest assets from commercial banks’ balance sheets, while it did not encourage banks to make new loans and increased only their excess reserves at Fed.

The end of QE3 is in the best case only the first step on the long road to normalizing the U.S. central bank’s policy (which also requires interest rate hikes and shrinking Fed’s balance sheet). But probably this is only a change in monetary policy tools. However, the monetary policy will remain accommodative, and any restrictive effect of the end of QE3 could be neutralized by more expansionary usage of normal open-market operations or other instruments, such as the interest on required balances and excess balances, the reverse repo or term deposit facilities. Eric Rosengren, the President of the Boston Federal Reserve Bank, also noted the intent of “holding interest rates very low for longer than anticipated and communicating that intent publicly”. Some even voiced opinions that the end of QE3 was a price paid by the dovish camp to the hawks for the promise to keep short-term interest rates near zero well into the future, which would be a positive message for gold investors.
Stay updated on the latest developments in the Fed’s policy, gold market and US economy by signing up for our Market Overview reports. We also provide Gold & Silver Trading Alerts for traders interested more in the short-term prospects. If you’re not ready to subscribe now, we still encourage you to join our gold newsletter. It’s free and you can unsubscribe in just a few clicks.
Thank you.
Arkadiusz Sieron

Dec 9, 2014
- Is there a strong bull flag pattern in play on the daily gold chart? For the likely answer, please click here or the chart now.
- The US stock market has lost upside momentum, and the falling price of oil threatens to create an “Armageddon” type of event in the junk bond market, yet gold looks and feels superb.
- Please click here now . In addition to the bullish flag pattern, there’s an inverse head and shoulder bull continuation pattern that looks solid. The target of this pattern is the $1275 – $1280 area. Is the Western gold community going to receive an early Christmas present, in the form of another rally in the gold price? These charts suggest they are!
- For a closer look at the gold price action, please click here now. That’s the hourly bars chart, which I use to magnify both the flag and the head and shoulders pattern. A solid rally seems imminent.
- I think the dollar may be about to fall fairly hard against the Japanese yen, and that could help to activate the bullish patterns on the gold charts.
- Please click here now. That’s the daily chart, showing the dollar down again against the yen, in early trading today. Note the bearish non-confirmation event in play on my 14,7,7 Stochastics oscillator.
- Many gold bears, like Jeff Currie of Goldman Sachs, appear to be somewhat stunned that when gold briefly traded under $1180, it failed to fall quickly to $1050. Instead, while the yen has suffered a truly horrific collapse, gold has rallied back to $1200.
- The error in gold market analysis by the bears can largely be explained by their complete failure to predict the recovery of demand in India. The recovery has been spectacular, and I predict it’s not just here to stay, but here to soar, on what I’m predicting will be double digit GDP growth.
- Please click here now. That’s the hourly bars chart for oil. I was a light buyer of oil stocks as oil arrived in the $73 area.
- I’ll be a much heavier buyer at $55 and $40, and I’ll ask the gold community to buy if the price falls there, but the big news about lower priced oil, is related to its powerful effects on the Indian economy and the nation’s current account.
- Please click here now . Indian inflation just fell to a record low. The mafia appears to have some influence on the Indian finance ministry, but under what appears to be substantial pressure from the central bank, I expect India to reduce and possibly completely eliminate gold import duties by the spring of 2015, and perhaps sooner.
- There is simply too much pressure to cut these duties, with smuggling totally out of control, record low inflation, and falling oil prices that could soon turn the current account deficit into a surplus.
- The chop in gold duties will boost government tax revenues. It will take hundreds of thousands of jewellery workers off the breadline, and put them back to work. Most importantly (for the Western gold community), it will boost demand for gold.
- China is also in the news, and the news is excellent. I think most analysts are seriously underestimating the importance of the Chinese central bank’s decision, made just days ago, which allows more jewellers to import gold.
- Also, Hong Kong’s top gold industry players have just formed a major link with the Shenzhen jewellery manufacturing area in China, where about 70% of all Chinese gold jewellery is manufactured.
- Please click here now. This new Hong Kong/China gold market synergy is very bullish for gold. It should quickly produce a significant increase in Chinese gold demand. To view the synergy in more detail, please click here now.
- At the current point in time, gold is clearly a pillar of strength, both fundamentally and technically. While events in China and India revolve mainly around gold jewellery demand ramp-up, America may be set to become a key driver of gold stocks. Here’s why:
- I’ve argued that the Fed would reduce its balance sheet, and that’s in play now. I’ve predicted that the reduction would create a smaller money supply, allowing for a surprising upturn in money velocity. That is happening at the same time as wage pressures grow, and commercial banks are nudged by the Fed to begin making more aggressive loans with their reserves.
- Those reserves exceed two trillion dollars. Alan Greenspan has referred to their potential movement as inflationary tinder, and rightly so.
- Influential economist Mike Ivanovitch is respected in the mainstream financial community. To understand his new views on US inflation dangers, please click here now. Interest rates will rise, but not much, because commercial banks are set to lend out reserves, and flood the system with liquidity.
- Mike ended his discussion with this strong statement: “Equities are still my preferred asset class — provided the portfolios are carefully reviewed toward a defensive posture. Also, think of putting some of that yellow stuff under your Christmas tree.” –CNBC News, December 8, 2014.
- While most gold analysts are focused on the fear trade, I think it’s too early in the economic cycle for that. Institutional money managers focused on gold bullion ETFs during the 2008 crisis. They saw system risk, and focused on bullion rather than gold stocks. I think that as the inflation I’m predicting begins to appear in 2015, the money managers will focus on gold stocks much more than bullion.
- On that note, please click here now. That’s the daily chart for GDX. The downtrend line has been clearly penetrated, and there’s an irregular drifting rectangle pattern in play. My short term target is $22. It’s tax-loss selling season. As a result, gold stocks are trading erratically, even though gold itself is doing well.
- A nice gold stocks rally should begin early in January. That’s just three weeks away. My suggestion is to put some quality gold stocks under the Christmas tree, and get ready for a super year in 2015!
Dec 9, 2014
Stewart Thomson
Graceland Updates
website: www.gracelandupdates.com
email for questions: stewart@gracelandupdates.com
email to request the free reports: freereports@gracelandupdates.com
Tuesday Dec 9, 2014
Special Offer for Money Talks readers: Send an email to freereports@gracelandupdates.comand I’ll send you my free “Seniors Six Pack” report. In it, I show you my key buy and sell points for the top six senior gold stocks for the next 12 months.
Graceland Updates Subscription Service: Note we are privacy oriented. We accept cheques. And credit cards thru PayPal only on our website. For your protection we don’t see your credit card information. Only PayPal does.
Subscribe via major credit cards at Graceland Updates – or make checks payable to: “Stewart Thomson” Mail to: Stewart Thomson / 1276 Lakeview Drive / Oakville, Ontario L6H 2M8 / Canada
Stewart Thomson is a retired Merrill Lynch broker. Stewart writes the Graceland Updates daily between 4am-7am. They are sent out around 8am. The newsletter is attractively priced and the format is a unique numbered point form; giving clarity to each point and saving valuable reading time.
Risks, Disclaimers, Legal
Stewart Thomson is no longer an investment advisor. The information provided by Stewart and Graceland Updates is for general information purposes only. Before taking any action on any investment, it is imperative that you consult with multiple properly licensed, experienced and qualifed investment advisors and get numerous opinions before taking any action. Your minimum risk on any investment in the world is 100% loss of all your money. You may be taking or preparing to take leveraged positions in investments and not know it, exposing yourself to unlimited risks. This is highly concerning if you are an invetor in any derivatives products. There is an approx $700 trillion OTC Derivatives Iceberg with a tiny portion written off officially. The bottom line:

Today’s videos:
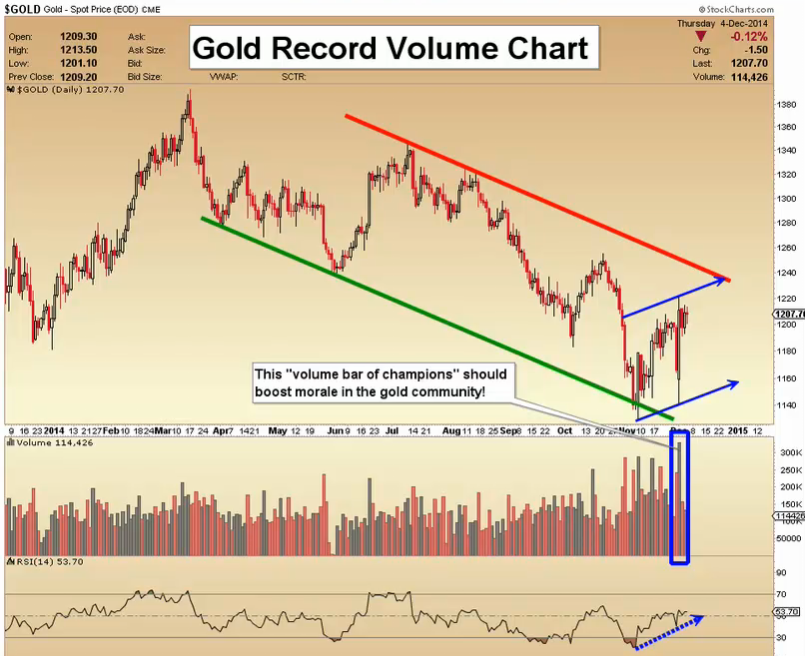
Gold Record Volume Charts Analysis
Silver Record Volume Bar Charts Analysis
FXI (China Stock Market) Gigantic Triangle Charts Analysis
GDXJ Volume Must Improve Charts Analysis
GDX Historic Volume Charts Analysis
Thanks,
Morris
Super Force Signals special offer for Money Talks Readers:
Send an email to trading@superforcesignals.com and I’ll send you 3 of my next Super Force Surge Signals free of charge, as I send them to paid subscribers. Thank you!
The SuperForce Proprietary SURGE index SIGNALS:
25 Surge Index Buy or 25 Surge Index Sell: Solid Power.
50 Surge Index Buy or 50 Surge Index Sell: Stronger Power.
75 Surge Index Buy or 75 Surge Index Sell: Maximum Power.
100 Surge Index Buy or 100 Surge Index Sell: “Over The Top” Power.
Stay alert for our surge signals, sent by email to subscribers, for both the daily charts on Super Force Signals at www.superforcesignals.com and for the 60 minute charts at www.superforce60.com
About Super Force Signals:
Our Surge Index Signals are created thru our proprietary blend of the highest quality technical analysis and many years of successful business building. We are two business owners with excellent synergy. We understand risk and reward. Our subscribers are generally successfully business owners, people like yourself with speculative funds, looking for serious management of your risk and reward in the market.
Frank Johnson: Executive Editor, Macro Risk Manager.
Morris Hubbartt: Chief Market Analyst, Trading Risk Specialist.
website: www.superforcesignals.com
email: trading@superforcesignals.com
email: trading@superforce60.com
SFS Web Services
1170 Bay Street, Suite #143
Toronto, Ontario, M5S 2B4
Canada

-
I know Mike is a very solid investor and respect his opinions very much. So if he says pay attention to this or that - I will.
~ Dale G.
-
I've started managing my own investments so view Michael's site as a one-stop shop from which to get information and perspectives.
~ Dave E.
-
Michael offers easy reading, honest, common sense information that anyone can use in a practical manner.
~ der_al.
-
A sane voice in a scrambled investment world.
~ Ed R.
Inside Edge Pro Contributors

Greg Weldon

Josef Schachter

Tyler Bollhorn

Ryan Irvine

Paul Beattie

Martin Straith

Patrick Ceresna

Mark Leibovit

James Thorne

Victor Adair