Gold & Precious Metals

Gold Stocks Volume Surge Analysis

Screen Shot 2014-11-21 at 11.40.37 AM

Today’s videos:

Gold RSI 50 Is The Key Charts Analysis

Silver Moving Averages Hold The Key Charts Analysis

FXI (Chinese Stock Market) Triangle Action Charts Analysis

QQQ (Nasdaq Proxy) Swing Trades Charts Analysis

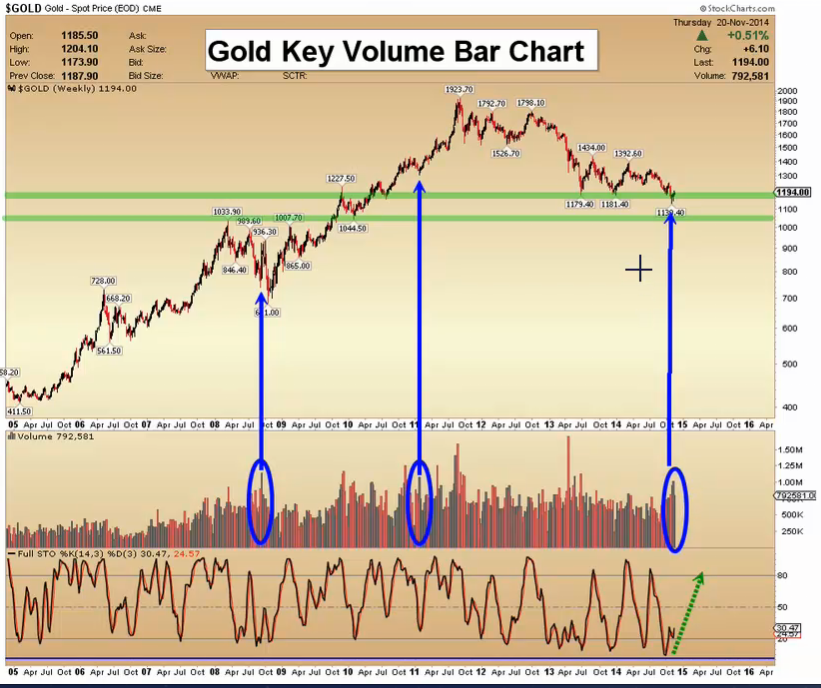
GDX Volume Surge Charts Analysis

GDXJ Moving Averages On The Verge Charts Analysis

Thanks,

Morris 

Friday, Nov 21, 2014 Super Force Signals special offer for Money Talks Readers:
Send an email to trading@superforcesignals.com and I’ll send you 3 of my next Super Force Surge Signals free of charge, as I send them to paid subscribers. Thank you!

The SuperForce Proprietary SURGE index SIGNALS:

25 Surge Index Buy or 25 Surge Index Sell: Solid Power.
50 Surge Index Buy or 50 Surge Index Sell: Stronger Power.
75 Surge Index Buy or 75 Surge Index Sell: Maximum Power.
100 Surge Index Buy or 100 Surge Index Sell: “Over The Top” Power.

Stay alert for our surge signals, sent by email to subscribers, for both the daily charts on Super Force Signals at www.superforcesignals.com and for the 60 minute charts at www.superforce60.com

About Super Force Signals:
Our Surge Index Signals are created thru our proprietary blend of the highest quality technical analysis and many years of successful business building. We are two business owners with excellent synergy. We understand risk and reward. Our subscribers are generally successfully business owners, people like yourself with speculative funds, looking for serious management of your risk and reward in the market.

Frank Johnson: Executive Editor, Macro Risk Manager.
Morris Hubbartt: Chief Market Analyst, Trading Risk Specialist.

website: www.superforcesignals.com
email: trading@superforcesignals.com
email: trading@superforce60.com 

SFS Web Services
1170 Bay Street, Suite #143
Toronto, Ontario, M5S 2B4
Canada

Gold’s Volatility & Other Things to Watch

Gold’s reversal from $1130 to $1200 combined with sharp rebounds in the gold miners has given precious metals bulls some hope that the bottom may be in. A few weeks ago we noted that the sector was extremely oversold and a snapback rally could begin. Gold has been the tell for the bear market and a real bull market throughout the precious metals complex may not begin until Gold’s bear has ended. In this editorial we dig deeper into some things to watch as they pertain to Gold.

First we will focus on Gold’s volatility. The chart below shows Gold and two volatility indicators: the CBOE volatility index and average true range. Peaks in daily volatility have coincided with important peaks and troughs in the Gold price. Volatility declined from summer 2013 through summer 2014 before perking up as Gold declined from $1255 to $1130. Yet both volatility indicators are not close to extremes. Volatility does not necessarily need to reach an extreme to signal a bottom. However, the two biggest volatility spikes were at the 2008 bottom and 2011 peak. A sharp decline in Gold below $1100 towards major support combined with a spike in volatility could signal a major turning point.

nov20edgoldvol

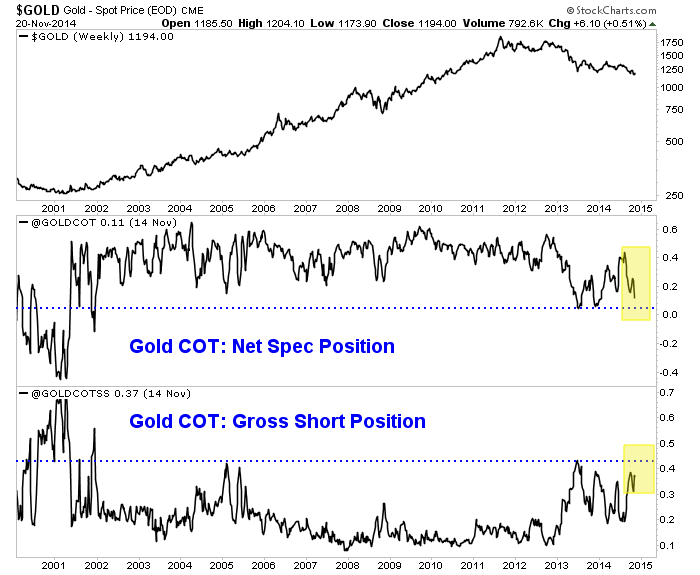
I’m also focusing on the COT as its an excellent sentiment indicator. By some metrics (objective and anecdotal) Gold’s bear market has reached extreme territory. However, the COT is presently not at an extreme. We plot (as a percentage of open interest) the net speculative position and the gross short position. If these readings can exceed the 2013 extremes then they would be at 13-year extremes. A spike in the gross short position, while negative in the short-term provides future fuel (short covering) for a very strong rebound off the bottom.

nov20edgoldcot

Meanwhile, let’s not forget Gold’s relative strength. We shared the importance in a recent missive. We noted Gold’s relative strength tends to perk up before Gold itself bottoms. The chart below plots Gold against a foreign currency basket (the inverse of the US$ index) and Gold against the S&P 500. Gold is holding up well against foreign currencies but is coming to an inflection point. I don’t think its going to breakout yet but I could be wrong. Meanwhile, Gold continues to be very weak against the stock market.

nov20edgoldudnspx

Gold has been the tell for the bear market and my work leads me to believe the bottom is ahead and not behind us. Last week we noted the likelihood of a test of major support near $1000/oz rather than a bottom at an arbitrary level. In addition, Gold has yet to have a volatility spike on par with the spikes at the 2008 bottom and 2011 top. Moreover, current positioning in the futures market remains below the extremes seen in 2013. Finally, Gold has more work to do on the relative strength front before it can sustain a recovery.

All this being said, it is important to keep an open mind to various possibilities. Silver and the mining stocks are totally bombed out and we should pay close attention if they retest their lows.  The weeks and months ahead figure to be enticing and exciting for precious metals traders and investors. Expect quite a bit of day to day volatility as we see forced liquidation and occasional short covering. Be patient but be disciplined. As winter beckons we could be looking at a lifetime buying opportunity. I am working hard to prepare subscribers. Consider learning more about our premium service including a report on our top 5 junior mining stocks to buy at the coming bottom.


Good Luck!

Jordan Roy-Byrne, CMT

Jordan@TheDailyGold.com

  1. Just hours ago, gold staged a nice upside breakout, from a bullish flag pattern. To view this exciting action on a short term chart, please  click here now
  2. After rising from an inverse head and shoulders bottom pattern, gold promptly formed a bull flag. The target of this pattern is the $1235 – $1240 price zone.
  3. Please  click here now. That’s also an hourly bars chart, with the uptrend channel highlighted. A rise above $1200 could usher in a lot of momentum-oriented buying, creating a near-vertical surge to the $1235 -$1240 price zone.
  4. In my professional opinion, gold demand in India for Diwali has been the main price driver of this rally, and that demand has overwhelmed speculators carrying short positions on the COMEX. 
  5. Tremendous corruption exists in the Indian government, and the bullion banks that have traditionally controlled most gold imports, are not happy with the recent decision of the Indian central bank to allow non-bank entities to compete with them.
  6. The profits made by the bullion banks have shrunk from $100 – $200 an ounce to just $10 – $20 an ounce. As a result, the banks and the Indian finance ministry are putting tremendous pressure on the Indian central bank to restore the bullion bank imports cartel.
  7. India is likely to announce measures to curb gold imports as early as Tuesday, a senior finance ministry source said…. “We are working on it. The measures to slow gold imports are almost ready and may be announced today or tomorrow,” said the source, who declined to be named because of the sensitivity of the matter.’ –Reuters News, November 18, 2014.
  8. A new round of restrictions appears to be imminent. That will empower the mafia and the bullion banks, but it’s unlikely to change the total amount of gold being imported into India.
  9. Even if India has to take a step or two backwards temporarily, an important policy maker at the European Central Bank has just suggested that the ECB could begin a gold buying program. This is fabulous news for the Western gold community.
  10. The Board of Governors has unanimously advocated, where appropriate, to take further unconventional measures to counteract a lengthy period to lower inflation. Theoretically, this also includes the purchase of government bonds or other assets such as gold, shares, Exchange Traded Funds (ETF) etc.”  –Yves Mersch, ECB Executive board member, in a speech posted on the ECB website yesterday. To view the entire speech, using the Google translator, please  click here now.
  11. Mersch speaks forcefully, about the need to raise the European inflation rate.
  12. My Indian jeweller contacts believe gold and silver can rally for several more weeks before suffering a significant sell-off. Please  click here now. That’s the daily silver chart, and it looks ready to rally.
  13. There’s also a potential flag pattern in play on that chart. To view it, please  click here now. A breakout from the flag pattern appears to be imminent. That could help ignite a period of outperformance by silver against gold!
  14. When gold and silver stage a tradable rally, the mining stocks tend to do very well. On that note, please  click here now. This GDX daily chart suggests that gold stocks are poised to rally to $20, $22, and perhaps to $25.60, before any kind of shorting or selling opportunity presents itself.
  15. I think the $25.60 price target is realistic and achievable. To understand my thinking on this key issue, please  click here now. That’s the GDX weekly chart, and it looks superb. 
  16. Note the action of the 14,3,3 Stochastics oscillator. GDX can easily rally ten dollars on a crossover buy signal, and it seems poised to do so right now.
  17. Please  click here now. That’s the GDXJ daily chart. Junior gold stocks tend to outperform the seniors during a serious rally, just as silver tends to outperform gold, during a serious precious metals price rally.
  18. If GDX can rise to $25.60, and I think it can, then GDXJ should rise to $40.
  19. A lot of amateur investors have been caught off guard by this precious metals rally. There are a number of reasons for that, and an overly-simplistic view of the relationship between the Japanese yen and gold is one reason for their failure. 
  20. Many of them were carrying large short positions in gold. Carrying a small tactical short position is the action of a professional investor. In contrast, wildly shorting the world’s ultimate asset with large amounts of leverage is very dangerous.
  21. Most fans of the yen-gold relationship thought that when the US dollar surged against the yen, it would surge against gold, but the opposite has now occurred; gold is surging against the dollar!
  22. Please  click here now. That’s the weekly chart of the US dollar versus the Japanese yen. The dollar’s upside progress is fading. The Stochastics oscillator looks ready to move sharply lower. If gold can move aggressively higher while the yen is collapsing, as it is now, one can only imagine the potential “super surge” in the gold price, if the yen begins to rally.
  23. I think that situation is going to occur very soon. I also would not be too quick to count out the head of the Indian central bank, Raghuram Rajan. He is a master tactician and strategist, and turned the 80-20 import rule against the bullion banks, by adjusting the fine print of the rule. In India, home of the most powerful gold demand in the world, oil prices have fallen, the rupee is stable, inflation is moderating quickly, GDP is growing, and the current account deficit is now a tiny part of GDP. Yet, incredibly, the government and the bullion banks still seem obsessed with claiming that buying gold is a cause of financial weakness. This makes them look corrupt and ridiculous. 
  24. Gold is in a tremendously strong position right now. The weekly charts are very bullish, and flag patterns are in play on the shorter term charts. Fundamentally, India is a force to be reckoned with for decades to come. The Swiss referendum is a bullish wild card, and the potential for the ECB to become a gold buyer is growing. Almost all the lights are green, for gold! 

Nov 18, 2014
Stewart Thomson
Graceland Updates
website: www.gracelandupdates.com
email for questions: stewart@gracelandupdates.com 
email to request the free reports: freereports@gracelandupdates.com

Tuesday Nov 18, 2014
Special Offer for Money Talks readers
: Send an email to freereports@gracelandupdates.comand I’ll send you my free “Natural Gas Price Explosion!” report. Prices are skyrocketing as cold weather hammers the East coast of America. I’ll show you how I’m playing this key asset, to manage risk and gain reward!

Graceland Updates Subscription Service: Note we are privacy oriented. We accept cheques. And credit cards thru PayPal only on our website. For your protection we don’t see your credit card information. Only PayPal does.

Subscribe via major credit cards at Graceland Updates – or make checks payable to: “Stewart Thomson” Mail to: Stewart Thomson / 1276 Lakeview Drive / Oakville, Ontario L6H 2M8 / Canada

Stewart Thomson is a retired Merrill Lynch broker. Stewart writes the Graceland Updates daily between 4am-7am. They are sent out around 8am. The newsletter is attractively priced and the format is a unique numbered point form; giving clarity to each point and saving valuable reading time.

Risks, Disclaimers, Legal
Stewart Thomson is no longer an investment advisor. The information provided by Stewart and Graceland Updates is for general information purposes only. Before taking any action on any investment, it is imperative that you consult with multiple properly licensed, experienced and qualifed investment advisors and get numerous opinions before taking any action. Your minimum risk on any investment in the world is 100% loss of all your money. You may be taking or preparing to take leveraged positions in investments and not know it, exposing yourself to unlimited risks. This is highly concerning if you are an invetor in any derivatives products. There is an approx $700 trillion OTC Derivatives Iceberg with a tiny portion written off officially. The bottom line:

Are You Prepared?

It seems that once again the direction or trend playing out in the markets has been interrupted by geopolitical tensions heating up between Russia, Ukraine, and the Western powers. Precious metals finished the week on higher footing, with gold initially touching below 1,150 USD this past Friday morning, but going on to finish the day approximately 40 dollars higher just shy of 1,190 USD. The predicament for those who have been anticipating a bottom in the precious metals is determining whether or not this is simply just noise that will once again wash through and see the trend of a stronger greenback and weaker precious metal prices continue.

If weeks prior can provide any indication for what Russia-Ukraine tensions mean, it’s that they have led to unsustainable rallies in the metals market. The escalation of sanctions and threat of increased violence simply subside with time, and metals prices tracked lower accordingly. Thus, a suitable question becomes why does the market again react to similar events we have witness play out before if inevitably, time will pass and they will soon be forgotten?

For certain the liquidity of the gold and precious metal markets is one factor for the surge in prices as the relatively smaller market becomes a very quick and instantaneous hedge for the US dollars and risk assets. Short term investors or traders are less concerned about the price level of gold, but instead will go long gold as it  exhibits its safe haven characteristics during these time periods.

Perhaps another reason though is the ongoing uncertainty surrounding the Russian economy. And although what we are currently witnessing with Russia is simply antagonizing tactics with Ukraine, the likelihood of escalation of sustained violence (or war) becomes more and more likely as their economy worsens. The Russian Ruble has depreciated 23 per cent against the US dollar over the past three months. Inflation becomes a huge issue for the Russian consumer with prices up nearly 8 per cent over the last year, and it is a trend that is likely to continue as the economy is extremely dependent of imports of food and agriculture as they are unable to substitute for what is inadequate domestic production.

As the Russian economy gets choked off from the rest of the world, and it’s the citizens that feel the brunt of the pain and suffering as their lifestyles adjust to a weaker economy that makes the majority of them worse off, options become limited. The uncertainty, which is very much priced into the market for Russian Rubles, and attracting a safe haven bid in precious metals, is how far into a corner is Putin backing himself, and what will be the repercussions of his actions.

And one potential repercussion becomes, as the media has been questioning, the likelihood of another cold war. Ongoing and increased sanctions with Russia are slowly cutting the economic ties to the west. It’s not without coincidence that the largest buyers of physical gold in the last quarter were Russia, Kazakhstan, and Azerbaijan. But all central banks in aggregate have bought gold now for 15 consecutive quarters. These are the long terms investors, and as one UBS analyst put it, in this kind of environment, “diversification would be deemed a logical outcome.”

Robert Levy for BorderGold
All investments contain risks and may lose value. This material is the opinion of its author(s) and is not the opinion of Border Gold Corp. This material is shared for informational purposes only. Information contained herein has been obtained from sources believed to be reliable, but not guaranteed.  No part of this article may be reproduced in any form, or referred to in any other publication, without express written permission.  Border Gold Corp. (BGC) is a privately owned company located near Vancouver, BC. ©2012, BGC.

One Of The Most Spectacular Turns In History Is Taking Place

shapeimage 22As the world continues to move into uncharted territory, today a 40-year market veteran sent King World News a powerful piece warning that one of the most spectacular turns in history is now upon us.  He also discussed gold, silver, and what investors should be doing in this dangerous environment.

….read more HERE