
Gold & Precious Metals
MARTIN ANSWERS A QUESTION: … Will the day come that you will admit that the precious metals are currently suppressed in a massive way to the downside, especially the relatively small market of silver?
ANSWER: Sorry – that day will never arrive. It is pure BS used to sell the metals. Look at it this way. WHY buy something that can never rise if these stories are true? It makes no sense whatsoever. I remain bullish long-term BECAUSE there is no such suppression. If there was, it cannot be a free market so write it off.
The decline in the metals is in line with the global economy. Come on – look at oil !!!. The metals will rise. They are NOT perpetually suppressed. The time is just not right. What would the banks, who care only about the next quarter’s trading profit, keep the metals suppressed without profits to pay regular bonuses? EVERY manipulation they have EVER done with the metals is to make fake rallies because they KNOW the gold promoters will talk everyone into buying. To many – reason flies out the window. This has become a religion to perpetually hold rather than trade. The manipulators get to sell those rallies and make a fortune.

I knew about the Hunt brothers buying in the early 1970′s. Suddenly, a few months before the high, everyone heard about the Hunts. Why? The manipulators put that info out to get the public to buy the high and they made a fortune. They trapped the Hunts who then could not sell anything without the world watching. They then rigged the game at the exchange to raise margins to go long and reduce them to go short. The government NEVER prosecuted the exchange or the manipulators for that rigged game. That is when they took their fortunes and invaded the takeover of Wall Street creating the Bank Proprietary trading game that has blown up the world.
There is NO money for them to perpetually suppress the metals. If there is no profit, they are not there. Sorry. A manipulation stands out because it is abnormal. The metals are in perfect sync with the global sectors of markets. Even the Platinum manipulation bribing Russian officials to recall all platinum sent prices up. They  need people to buy in order to sell the highs. You make 10x more in a short-sale at the high in less time than a buy and hold for decades be it stocks or metals. That is HOW they make a fortune. Not by trickle down bear markets. They know the gold believers will hold until they lose everything. They want the big bang for the buck and that comes with creating fake rallies.
I was named hedge fund manager of the year because I made more than 60% in less than 4 weeks selling the highs for the Long-Term Capital Management debacle in currencies and shares. You make more money selling the high is a very rapid short time frame because there is nothing like a panic.
I have taught for years HOW TO TRADE A PANIC. I could care less what the instrument might be. There is nothing like a panic to make heaps of money in a brief time period and then move on to the next.

This was the first silver manipulation in 1993. The CFTC demanded to know the name of the client and PhiBro refused to tell them. So they were ordered to just exit the trade. This is WHY AIG and the trading that blew up the world took place in LONDON. They moved to London after that incident.

Here was the 1997 silver manipulation. The gold promoters hate my guts because they want to get everyone fired up stating that EVERY rally is REAL while the declines are SUPPRESSION and MANIPULATION. It is exactly opposite. I would not trust anyone who preaches this nonsense for it is precisely how the manipulators sell the highs.
I came out and warned back then in 1997 that “they were back” ready to take silver to $7 by January and then would tank-it. I even gave the target objective. It was met. Buffet came out and said he bought $1 billion in silver and it was a long-term trade not manipulation. But he sold out the metal and silver made a new low.
The schmucks as always ran in to buy as always at the top and the manipulators sell it to them. How many times does this have to happen before someone connects the dots?

As a general rule, the most successful man in life is the man who has the best information
Demand
Global gold demand was 964t in Q2 2014, significantly reduced from the record high in Q2 2013.
ETF outflows slowed sharply.
Central Banks continued to buy gold for the 14th consecutive quarter in Q2 2014. CB’s purchased 118t in Q2 2014 up 28% over Q2 2013. The announcement of a fourth CBGA in the second quarter also reiterated that sales will not be forthcoming from some of the largest holders.
Jewellery demand weakened year-on-year, but the broad, 5-year uptrend remains intact. Jewellery accounted for 53% of gold’s global demand and is by far and away the anchor of gold’s market.

World Gold Council
Supply
China is the largest producer in the world, accounting for around 14 per cent of total production. East Asia as a whole produces 21 per cent of the total newly-mined gold. Latin America produces around 18 per cent of the total, with North America supplying around 15 per cent.
Around 19 per cent of production comes from Africa and 5 per cent from Central Asia and Eastern Europe.
Recycling accounts for around one third of the total supply of gold.
Thanks to the World Gold Council you now know where gold comes from, whose buying it and what they use if for.
Deeper into the #’s
Gold comes from three sources:
- Central Banks – sales stopped and are staying stopped.
- Recycling – mostly flat in 2014.
- Mining
Global gold demand across all sectors in 2013 was 4,065.60t.
The top 2013 six gold producing countries – China 420t, Australia 227t, U.S. 226t, Russia 220t, Puru 150t, South Africa 145t and Canada 120t – together produced 1,653.00t.
Other top gold producing countries include Mexico 100t, Ghana 85t, Brazil 75t, Indonesia 60t and Chili 55t.
According to GFMS estimates total gold mine supply reached 2,982 tonnes in 2013, up 4.1% from 2012.
High grading & refocusing
Two mostly unrecognized influences are at work in the global gold market, unsustainable production levels and a shifting of demand focus.
Many miners are processing greater quantities of ore to maintain revenue and contain costs at today’s lower gold prices.
It’s also very possible some companies are focused on solely mining the higher grade portions of their mines. The result is higher production and lower costs over a short term, but it is not sustainable and means a much higher gold price is needed to economically mine the lower grades left.
The focus of the gold industry is shifting east.
The key driver of gold’s price over most of the last decade was institutional investors buying gold bullion through exchange-traded funds (ETF). That changed in 2013 with investors dumping 800t or 31m ozs.
On the other side of the trade was an enormous physical, almost insatiable, gold demand coming from Asia. According to GFMS China imported unprecedented amounts of gold from the rest of the world and became the world’s largest consumer of jewellery last year, with demand rising 30% to 724 tonnes.
The quest for gold
Here’s a few facts from SNL Metals & Mining’s 2014 edition of ‘Strategies for Gold Reserves Replacement.’
Over the past two dozen years mining companies have discovered 1.66 billion ounces of gold in 217 major gold discoveries. That’s a lot of gold!
But it wasn’t enough – there were 1.84 billion ounces produced over the same period. That’s a shortfall of 180 million ounces of gold for reserve replacement over the 24 year period or a shortfall of 7.5m ozs a year.
The amount of gold discovered and the number of major discoveries has been trending downward – from 1.1 billion ounces in 124 deposits discovered during the 1990s to 605 million ounces in 93 deposits discovered since 2000.
“The amount of potential production from these major discoveries is particularly concerning when looking at the discoveries made in the past 15 years. Assuming a 75% rate for converting resources to economic reserves and a 90% recovery rate during ore processing, the 674 million ounces of gold discovered since 1999 could eventually replace just 50% of the gold produced during the same period.
However, considering that only a third of the discovered gold has been upgraded to reserves or has already been produced, and that many of these deposits face significant political, environmental or economic hurdles, the amount of gold becoming available for production in the near term is certainly much less.
Between 1985 and 1995, 27 mines with confirmed discovery dates began production an average of eight years from the time of discovery. The time from discovery to production increased to 11 years for 57 new mines between 1996 and 2005, and to 18 years for 111 new mines between 2006 and 2013.
The length of time from discovery to production is expected to continue trending higher: 63 projects now in the pipeline and scheduled to begin production between 2014 and 2019 are expected to take a weighted-average 19.5 years from the date of discovery to first production.” Kevin Murphy, mining.com
Conclusion
The production of mined gold remains well below market demand. As long as demand exceeds mined supply how can gold’s bull run be over? Your author doesn’t believe it can be.
The best way to profit is to buy when everyone else has sold and assets are at rock bottom prices. That would be now.
Your best bet for high returns will be to invest in junior resource companies.
After all, they find the deposits, so they own the world’s future mines, yeah that’s right, junior resource companies own the gold the gold miners need to replace their reserves.
Why don’t we all ignore the endless bombardment of economic white noise spewing from mainstream media outlets and instead concentrate on gold’s fundamental supply problems?
I’ve got a couple promising junior gold companies on my radar screen. Do you have a few on yours?
If not, maybe you should.
Richard (Rick) Mills
Richard lives with his family on a 160 acre ranch in northern British Columbia. He invests in the resource and biotechnology/pharmaceutical sectors and is the owner of Aheadoftheherd.com. His articles have been published on over 400 websites, including:
WallStreetJournal, USAToday, NationalPost, Lewrockwell, MontrealGazette, VancouverSun, CBSnews, HuffingtonPost, Beforeitsnews, Londonthenews, Wealthwire, CalgaryHerald, Forbes, Dallasnews, SGTreport, Vantagewire, Indiatimes, Ninemsn, Ibtimes, Businessweek, HongKongHerald, Moneytalks, SeekingAlpha, BusinessInsider, Investing.com and the Association of Mining Analysts.
Please visit www.aheadoftheherd.com
If you are interested in sponsoring Richard’s site please contact him for more information, rick@aheadoftheherd.com
***
Legal Notice / Disclaimer
This document is not and should not be construed as an offer to sell or the solicitation of an offer to purchase or subscribe for any investment.
Richard Mills has based this document on information obtained from sources he believes to be reliable but which has not been independently verified.
Richard Mills makes no guarantee, representation or warranty and accepts no responsibility or liability as to its accuracy or completeness. Expressions of opinion are those of Richard Mills only and are subject to change without notice. Richard Mills assumes no warranty, liability or guarantee for the current relevance, correctness or completeness of any information provided within this Report and will not be held liable for the consequence of reliance upon any opinion or statement contained herein or any omission.
Furthermore, I, Richard Mills, assume no liability for any direct or indirect loss or damage or, in particular, for lost profit, which you may incur as a result of the use and existence of the information provided within this Report

The selloff in precious metals intensified over the past week. GDXJ declined 25% in seven days while Gold plunged below $1180 to $1140 and Silver plunged below $16 and to as low as $15.20. Precious metals are becoming extremely oversold and the bear market is clearly in the 9th inning. Be on alert for a snapback rally to repair the extreme oversold conditions. Although we are likely very close to the bottom in the miners, Gold’s current position continues to leave me skeptical.
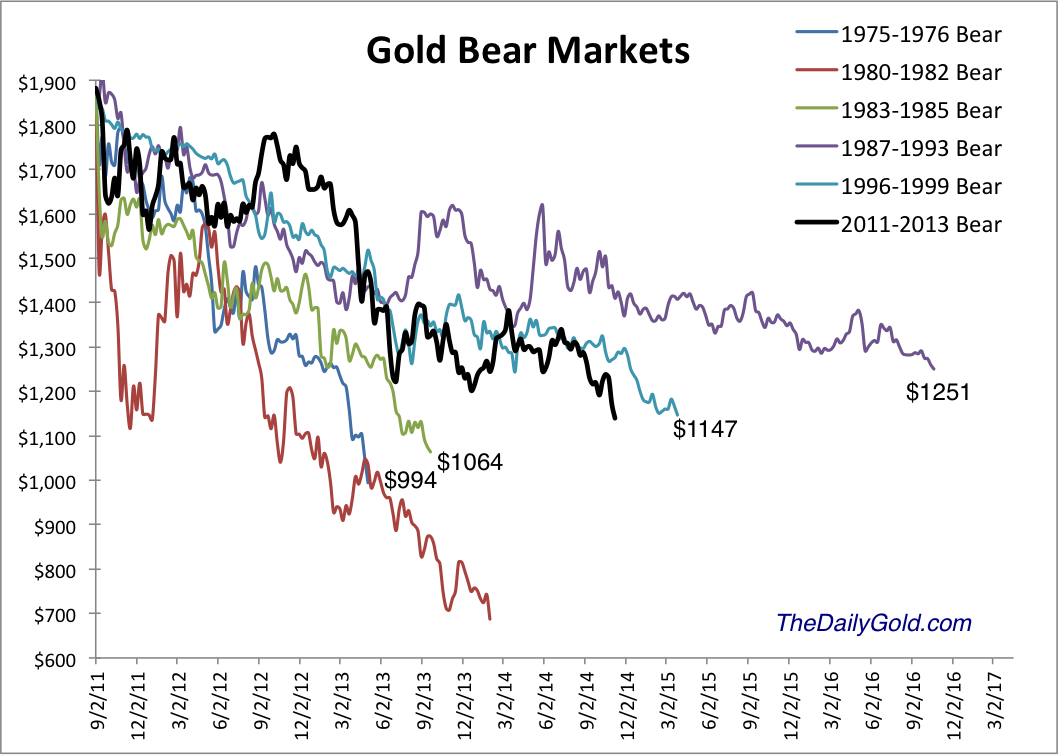
Below is the updated bear analog for Gold which uses weekly data. Gold has yet to suffer the extreme selling experienced by Silver and the mining stocks. It makes sense given that Gold peaked months after those assets. The chart illustrates how bear markets are a function of price and time. The most severe bears in price are the shortest in time while the longest bears in terms of time are the least severe in terms of price. This bear falls in between. Given that Gold went 10 years without a real bear market it makes sense that this bear could bottom very close to the 1983-1985 and 1975-1976 bears but will have lasted quite a bit longer.
Click Image for Larger View
With respect to Gold, another point to consider is the strong supports at $1080/oz (50% retracement of the bull market) as well as $1000/oz. These downside targets continue to align well with the history depicted in the bear analog chart. Moreover, the fact that Gold currently sits well above these support levels is reason to expect more downside.
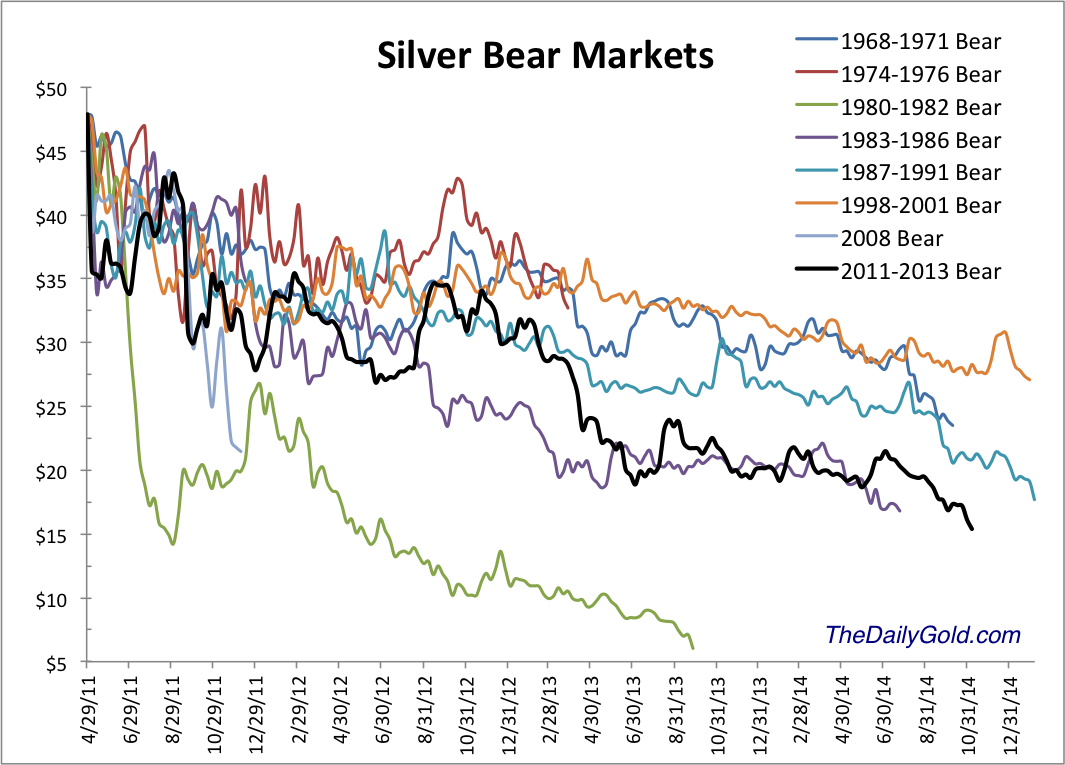
Silver on the other hand figures not to have the same degree of downside. Silver’s bear began five months before Gold’s and the bear analog below makes a strong case that the current bear will end very soon. Other than the epic collapse from 1980-1982, the current bear is the worst ever for Silver in terms of price and is the third worst in terms of time.
Click Image for Larger View
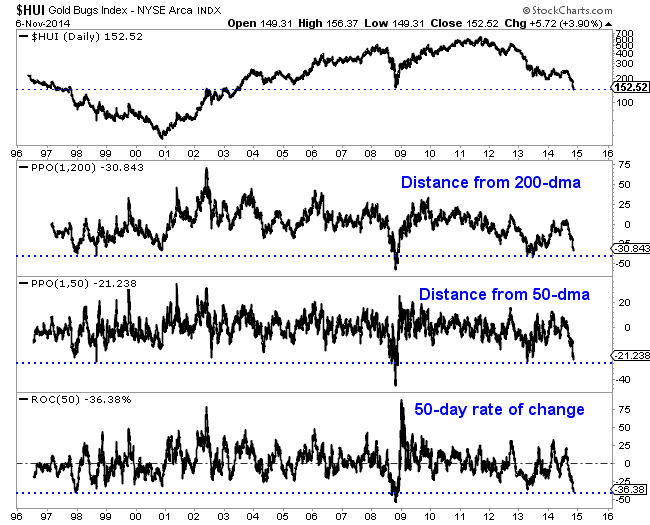
Similar to Silver, the mining stocks which led the bear market are moving from very oversold to extremely oversold. The HUI Gold Bugs Index, shown below closed Wednesday at an 11-year low. As far as the HUI’s distance from its 50 and 200-day moving averages, it is inches from major extremes. Over the past 50 days the HUI has declined 36.4%. That is the second worst performance over the past 20 years. The picture is even worse for the junior mining sector. GDXJ has declined 43% over the past 50 days. It is trading at the lowest level relative to its 50-day moving average since the creation of the ETF.
The worst bear market ever for the gold stocks was the more than four and a half year decline following the junior bubble in 1996. That bear did have a 14 month long respite where the indices rallied as much as much as 70% and 80%. That rally was longer and much larger than the one experienced recently. During the 1996-2000 bear, the GDM index (forerunner to GDX) declined 77.5%. Through Wednesday it was down 76%. The XAU declined 72.5%. Through Wednesday the XAU was off 74.2%. The Barron’s Gold Mining Index declined 75% during the late 1990s bear. Through last week it was down 68%.
The mining stocks and Silver are obviously extremely oversold and very close to the bottom. It could happen any day or any week. However, I’m skeptical because Gold is currently trading so far above its potential bottom. Sure, Gold figures to be the last to bottom but my view is the window for a bottom in the stocks could come when Gold declines below $1080. That being said, we could definitely see a snapback rally of some sort. The mining stocks and Silver are extremely oversold and could pop higher in the short-term.
In any event, the bear market is very close to its end. The weeks and months ahead figure to be very enticing and exciting for precious metals traders and investors. Expect quite a bit of volatilty as we see some forced liquidation from longtime bulls and as the sector tries to carve out a major bottom. Opportunities are fast approaching so pay attention. Be patient but be disciplined. As winter beckons, we could be looking at a lifetime buying opportunity. I am working hard to prepare subscribers. Consider learning more about our premium service including a report on our top 5 stocks to buy at the coming bottom.
Good Luck!
Jordan Roy-Byrne, CMT
Summary: I am expecting a sideways consolidation for two to four days before a resumption of the downwards trend.

Downwards movement subdivides so far as an incomplete double zigzag. This cannot be an impulse if the
movement which I have labeled primary wave X is correct as a triangle because a triangle may not be the sole structure in a second wave position.
The first zigzag in the double is labeled primary wave W. The double is joined by a “three”, a triangle, in the opposite direction labeled primary wave X.
The second zigzag for primary wave Y is moving price lower to deepen the correction, and so this structure has a typical double zigzag look in that it has a clear slope against the main trend.
Within primary wave Y the triangle for intermediate wave (B) is now a complete barrier triangle. Movements following triangles, and particularly barrier triangles, have a tendency to be relatively short and brief (more common), or sometimes they are a very long extension. At this stage though the lower target is beginning to look more likely.
Within primary wave Y at 11.52 intermediate wave (C) would reach 0.618 the length of intermediate wave (A). At 5.309 intermediate wave (C) would reach equality in length with intermediate wave (A).
Within primary wave Y intermediate wave (A) lasted 30 weeks and intermediate wave (B) lasted exactly a Fibonacci 54 weeks. I would expect intermediate wave (C) to end in a total 21 or 34 weeks. So far it has lasted 17 weeks and may yet continue towards the target for a further 4 or 17 weeks, if it exhibits a Fibonacci duration. However, please note, Silver does not reliably exhibit Fibonacci durations nor do its waves reliably exhibit Fibonacci ratios to each other in terms of duration.

Downwards movement invalidated the wave count from two days ago. This downwards movement is too deep to be a B wave within an expanded flat for minor wave 2, so although minor wave 2 was very shallow and brief it is most likely over already.
My only concern with this wave count at this stage is the degree of labelling within minor wave 3, and unless it exhibits a long strong fifth wave (typical of commodities) then I may need to move the degree of labelling within it all down one degree.
At this stage it looks like a 5-3-5 down within minor wave 3 is complete. This may be minute waves i, ii and iii as labeled, or it may only be minuette waves (i), (ii) and (iii) within minute wave i. Either way, at this stage I would expect to see a small fourth wave correction before the continuation of more downwards movement.
Minute wave ii lasted two days and shows clearly on the daily chart. I would expect minute wave iv to last at least two days, and quite likely longer as fourth wave corrections are often more long lasting than second waves when the second wave is a zigzag and the fourth wave is a combination or triangle.
Minute wave iv may not move into minute wave i price territory above 17.212.
The blue channel about minor waves 1 and 2 is a base channel. It is overshot at the lower edge which should be expected from a third wave.

This hourly chart shows almost all the structure within minor wave 3 so far. There is no adequate Fibonacci ratio between minute waves iii and i. When minute wave iv is complete I will expect to see a Fiboancci ratio between minute wave v and either of iii or i.
Within minute wave iii there is no Fibonacci ratio between minuette waves (iii) and (i), and minuette wave (v) is .081 longer than .618 the length of minuette wave (iii).
Minute wave ii was a relatively shallow .44 zigzag correction (or possibly a double zigzag). I would expect minute wave iv to be more shallow, because it should find resistance at the upper edge of the channel and it is likely to end within the price territory of the fourth wave of one lesser degree between 15.706 and 16.242.
Minute wave iv is most likely to be a flat, combination or triangle. All of these structures may include a new price extreme beyond its start so there can be no lower invalidation point for this wave count at this time.
Draw a channel about minor wave 3 using Elliott’s technique: draw the first trend line from the ends of minute waves i to iii, then place a parallel line on the end of minute wave ii. Minute wave iv may find resistance at the upper edge of this channel. The following fifth wave down may find support at the lower edge, but is quite likely to break through that support and end below the channel.
![]()
Today’s chart provides some long-term perspective on the gold market since the turn of the century. As today’s chart illustrates, gold’s parabolic bull market came to an end in 2011 and has been trading within the confines of a downtrend channel ever since. Over the past year and a half, however, gold found support at around the $1,200 per ounce level — bouncing off this level on a total of three occasions. That support has now come to an end as a result of economic weakness in both Europe and Asia coupled with relative economic strength in the US. All this encouraged global investors to allocate some of their funds into the relative safety of the US dollar thereby reducing the cost in dollars of commodities such as gold. As today’s chart illustrates, there is now room (i.e. no nearby support) for gold to move lower.
Quote of the Day
“The gold standard makes the money’s purchasing power independent of the changing, ambitions and doctrines of political parties and pressure groups. This is not a defect of the gold standard; it is its main excellence.” – Ludwig von Mises
Events of the Day
November 11, 2014 – Veterans Day
Stocks of the Day
— Find out which stocks investors are focused on with the most active stocks today.
— Which stocks are making big money? Find out with the biggest stock gainers today.
— What are the largest companies? Find out with the largest companies by market cap.
— Which stocks are the biggest dividend payers? Find out with the highest dividend paying stocks.
— You can also quickly review the performance, dividend yield and market capitalization for each of the Dow Jones Industrial Average Companies as well as the performance of the Dogs of the Dow.
Chart of the Day is FREE to anyone who subscribes HERE

-
I know Mike is a very solid investor and respect his opinions very much. So if he says pay attention to this or that - I will.
~ Dale G.
-
I've started managing my own investments so view Michael's site as a one-stop shop from which to get information and perspectives.
~ Dave E.
-
Michael offers easy reading, honest, common sense information that anyone can use in a practical manner.
~ der_al.
-
A sane voice in a scrambled investment world.
~ Ed R.
Inside Edge Pro Contributors

Greg Weldon

Josef Schachter

Tyler Bollhorn

Ryan Irvine

Paul Beattie

Martin Straith

Patrick Ceresna

Mark Leibovit

James Thorne

Victor Adair