
Gold & Precious Metals
Gold to Silver Ratio – Sentiment
A disaster or an opportunity? Remember the admonitions:
- Buy when the blood is running in the streets.
- Buy when everyone is selling.
- Buy when nobody wants it.
- Buy low and sell high.
Consider these additional comments on current gold sentiment:
Hathaway continued: “The Ned Davis research index of gold sentiment is the lowest it’s been in 30 years of data. They have data going back to December 30, 1994. Their chart of sentiment right now is basically at zero.”
“The other thing worth mentioning is that Mark Hulbert’s gold sentiment index is now at the second-lowest level ever. Hulbert said, ‘There has only been one time in the last 30 years when the HGNSI got any lower than it is today. That came in June 2013 when it fell to minus 56. Today it’s at minus 46.9.’”
Examine the GSR for the past decade and compare the extremes in the ratio to the bottoms and tops in the price of silver.

The current GSR is approximately 70 – very high and the price of silver is at a 4.5 year low. I have circled other times when the ratio was either quite high or quite low.Those extreme readings usually marked highs or lows in the prices for silver and gold.
Other Ratios….continue reading HERE

An analysis of 8 Gold Stocks that are in uptrends in this current environment – Money Talks Editor
Well, the headlines are rightfully bearish for gold, silver and the major precious metals stock indexes, ETFs and senior gold miners. The technical damage is real. Today’s burst could be and probably is just short covering. [edit; post was mostly written before the end of day flop]
But improbably enough, there is a stealth uptrend going on in certain royalties, miners, developers and explorers. Believe me, if you could hear me talk instead of write you would not hear anything resembling desperation in my tone. That is because I have worked hard during this bear market to manage risk, stay strong and out of the bear’s way. So I am not talking any sort of a book here other than my biggest picture view (an economic contraction environment that ultimately benefits the counter cyclical gold sector), which could still be out on the horizon.
Don’t take my word for it, here’s Investopedia’s definition of an uptrend:
“Describes the price movement of a financial asset when the overall direction is upward. A formal uptrend is when each successive peak and trough is higher than the ones found earlier in the trend.”

Graphic : Investopedia
Complicated it’s not.
The following charts are what they are (in up trends), and considering that legions of gold bugs have now sworn off the promoters and puked up gold for good, the time is nearing that this sector will again be investment worthy. At the very least, NFTRH for one is going to point out positives along with the ample negatives. Just so we keep a level playing field and an unbiased viewpoint.
We reviewed a condition on HUI’s weekly chart in an update the other day for instance. It’s a lower probability thing, but if it were to manifest it would rip the shorts’ heads off. Picture it, they’d be running around headless, bumping into each other, falling down, getting up again, until they realize they too are dead from shorting something that everybody already knew was left for dead… except for who ever has been buying these charts since last year.
Franco Nevada

Royal Gold

Kirkland Lake Gold

Lake Short Gold

Premier Gold

Semafo

Rio Alto Mining

Timmins Gold (a little wobbly, but still…)

Subscribe to NFTRH Premium for your 25-35 page weekly report, interim updates (including Key ETF charts) and NFTRH+ chart/trade ideas or the free eLetter for an introduction to our work.

Everywhere you turn today, gold is again being dismissed as a relic of the past, totally worthless, non-producing, with no place in any modern day portfolio. During the past 3 years, the gold complex has experienced the progressive stages of fear, capitulation, and despair, all classic bottoming phases of a long term Cycle. The question now is whether this high level of apathy is a symptom of a new secular bear market or a period of “stealth smart money” accumulation.
As an analysts of market Cycles, I’m encouraged by extremes in sentiment, as it correlates well with major Cycle turns. An asset’s price is just a reflection of the collective markets willingness to own it, so it naturally oscillates in response to changing sentiment, over a predictable period of time. Each ebb & flow of a Cycle may not repeat the last, but they sure do rhyme and they are as natural as breathing.
This brings us to the current Weekly Cycle, now standing at week 17 and in the early portion of the timing band for a Cycle Low. We know from experience that the final days of a Weekly Cycle can be thrilling; at times gold could lose $100 in the final 3 sessions. And that cannot be ruled out here, nobody can predict gold’s price movements over short periods of time. What we have is an asset that is in the timing band for a Daily and Weekly Cycle Low, sentiment at extremes, a COT report that is bullish, and miners that are showing relative strength. This is the very environment that spawns new Cycle rallies, not the setup for sustained declines.
For a Large image Click the Chart then Click again
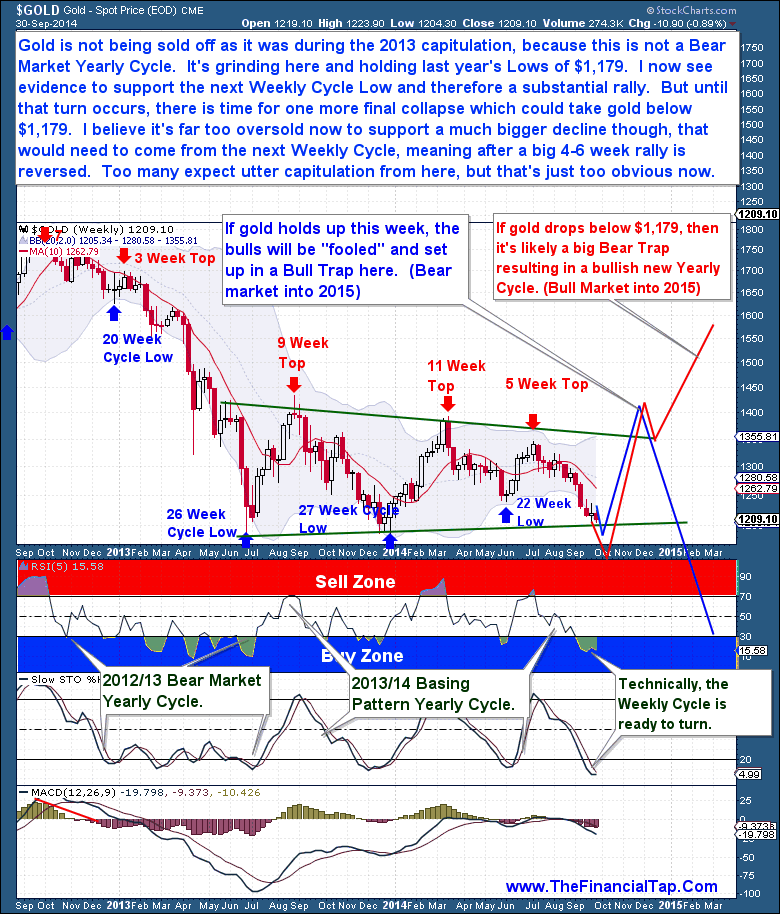
I have been bearish for a while, for good reason, and I’ve been joined by most analysts of late as gold
has fallen further. We’re seeing this reflected within extremely low (the 2nd Lowest of the past 15 years) sentiment numbers. Almost all financial analysts now expect to see a massive breakdown within the gold complex. And the recent Cycle failure and 4+ year lows within Silver has many expecting gold is just a step or two behind.
On the surface, this theory makes a lot of sense, the trend is lower. Gold is behaving in such a way that one can realistically expect a waterfall decline to quickly develop. But before we can entertain that idea, we must consider that this viewpoint has become a far too “scripted” notion. Setups that are so widely circulated and discussed, especially with sentiment at such levels, rarely ever develop that way.
To seriously consider a bear market continuation (from the 2011 top) or waterfall decline, we need to be aware that such developments require room (technically) and time (Cycle count) to transpire. In both cases, this is not an ideal position from which a significant gold sector breakdown could occur. The current deep Cycle count of the Yearly Cycle, the sentiment and technical readings, and even the U.S dollar’s massively stretched and overbought position do not support a sustained gold collapse.
Instead, what we should consider and focus our energy on is the coming Yearly Cycle Low, rather than what is likely to occur in the coming week or two leading up to that low. This current 15 month basing pattern is obviously very important because it is the foundation from which the significant move will be based from. At this time, we don’t know if the that move will be a continuation pattern lower or the next leg higher. However in both cases, gold’s first surprise is that a significant Yearly Cycle rally is about to begin.
For a Large image Click the Chart then Click again
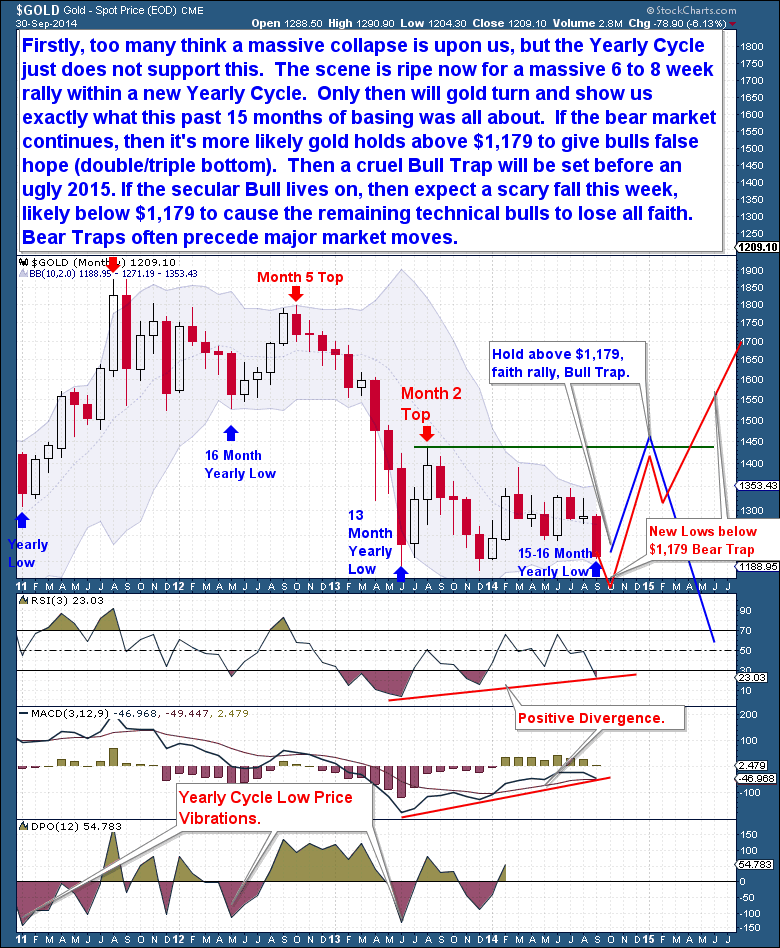
Notice how on the monthly chart above, the last 2 Yearly Cycles topped (red arrows) on month’s 4 and 2 respectively, that’s bear market behavior. Both were comfortably Left Translated, meaning that they topped early (Left of Center) and spent the most part of the Yearly Cycle in decline. But in each case, we still witnessed at least an 8 week rally to start each Cycle, in both cases adding at least $300 before topping. Yearly Cycle Lows occur only every 13 to 16 months and by definition coincide with the end of a (shorter) Weekly Cycle. What the evidence clearly shows is that we’ve come to another Weekly Cycle Low juncture, just as the Yearly Cycle is ready to turn here on Month 16.
The point here is that a (quick) loss of the $1,179, June 2013 lows within the next few weeks is a real possibility. But that reversal will mark the end and the beginning of a new Yearly Cycle. As shown earlier, even within a Bear Market, we see violent counter trend rallies; this coming Yearly Cycle rally should be no different. This rally will dominate the remainder of 2014 and take many people by surprise.
It won’t be until the 2nd or 3rd month of that rally that our next gold surprise will come. We will need to reconsider at that point whether this current 15 month Yearly Cycle basing pattern was just a continuation pattern (Bear Market) or a basing pattern (Bull Market) to support the next up-leg. It’s at the 2 to 4 month period where a bull or bear market will reveal itself again.
I could offer you an opinion as to where I believe gold is headed in 2015, but I see no point in making such brash predictions. My only concern is with where gold is headed in the intermediate future, that’s where the trade lies today. I will leave it to others who can do a much better job of entertaining you with lofty (biased) calls.
The Financial Tap publishes two member reports per week, a weekly premium report and a midweek market update report. The reports cover the movements and trading opportunities of the Gold, S&P, Oil, $USD, and US Bond Cycles. Along with these reports, members enjoy access to two different portfolios and trade alerts. Both portfolios trade on varying timeframes (from days, weeks, to months), there is a portfolio to suit all member preferences.
Summary
- Volatility in foreign exchange market as investors flee euro and yen for liquid U.S. dollar.
- Euro and yen hitting multi-year lows. Inflation picking up outside US.
- US dollar seen as temporary safe haven. Could the US dollar be the next currency to decline?
- Precious metals and junior miners trading at historic discounts should be considered as an alternative to fiat currency.
- Deflations set the stage for hyper-inflations.
Over the past few months, I have seen an influx of capital and high net worth investors who are getting interested in the junior mining resource area. Now may be the worst time to panic out of the precious metals and junior mining sector into the overbought US dollar. Smart capital may be carefully looking at ways to diversify away from the euro and yen which has collapsed hitting multi-year lows. Inflation may pick up rapidly in Europe and Japan. The European Central Bank is printing euros (NYSEARCA:FXE) like crazy causing a collapse in the currency and its worst quarter in many years. This is a manipulative attempt to stimulate a weak economy and boost exports from the region.
The flight of capital from Europe and Japan (NYSEARCA:FXY) has looked for temporary liquidity in the US dollar (NYSEARCA:UUP) which is hitting three year highs as investors expect the Fed will raise interest rates by 2015. But I wouldn’t count on that so quickly. Investors are also buying the S&P500 (NYSEARCA:SPY) large caps sitting on record cash positions. The US may be the most dangerous overbought market right now that could correct from those nosebleed levels delaying interest rate increase.
The US dollar has soared as a liquid alternative. For how long is the main question. Can the S&P500 continue to rally alongside the dollar? The yen and euro is collapsing. Could the US dollar be the next currency to fall or could it be the US equity markets which have gone up for three years now with no meaningful correction?
A strong US dollar could put pressure on the large US multinationals and S&P500 as US exports become more expensive. US deficits continue to soar to record levels and they must be paid with cheaper dollars.
Eventually, the large US dollar position should rotate into the commodities and natural resources as deflations set the stage for hyper-inflations.
What one must do during these periods is prepare for inflation to pick up by buying precious metals and junior miners. Deflationary periods do not last long. The long term trend favors inflation. Three to four years is already an extended period of time for a correction by historical standards.
Deflations breed the best buying opportunities as one can protect oneself ahead of the inflationary storm that may be directly ahead.
Gold (NYSEARCA:GLD) and silver (NYSEARCA:SLV) prices have been declining since 2011 but may soon bottom as the US dollar begins to test multi-year highs. The US dollar is very overbought as investors fear that the US will raise interest rates while other countries continue to print money like the ECB, Japan and China.
This rally in the US dollar should not last much longer as it may be a dead cat bounce before the next downturn. This may actually be a great time to transfer cash into real assets such as the junior miners (NYSEARCA:GDXJ) trading near multi-year lows.
The US deficit is continuing to increase especially as new wars are announced in Europe and the Middle East. The Fed will continue to support inflationary policies and prevent deflations at all costs.
Rising deficits and war are usually quite bullish for gold and bearish for the dollar. Silver is already in new four year lows trading below $18. Gold has not yet violated the $1200 mark but may soon bounce off that level. The Junior Gold Mining ETF is continuing to hold its 2014 lows.
Meanwhile, the US dollar is strong at new six year highs despite billions of dollars of bailout and quantitative easing. The Fed is running the risk of deflation and may actually be forced into more easing to boost inflation. The U.S. must pay back its record debts with cheaper dollars.
Right now, the bottles of champagne are popping in the US as real estate and equity markets continue to hit new highs. However, the piper must be paid and it is harder to pay down debts with a strong dollar. Don’t be surprised to see the Fed eventually make a reverse move to devalue the dollar to pay down debts. Expect more bubbles to explode not just in 3-D printing, but in social media stocks and get rich quick real estate scams.
There is a huge cash position waiting on the sidelines to buy real money such as gold and silver especially from the Europeans right now dealing with a currency on verge of collapse and China, which just announced a new Shanghai Gold Exchange. Major institutions are sitting on large amounts of US dollars/bonds and must transfer that into the form of real money in the form of gold, silver and ounces in the ground controlled by the junior miners.
Look for huge volume and accumulation in gold and silver over the next few weeks and in some high quality junior mining stocks. Negative capitulation followed by strong accumulation could be the indicator that the smart money expects gold and silver to bottom. The question for many is when this will occur. It should be soon as this correction in the junior miners has been one of the worst and longest in decades providing possibly a once in a generation buying opportunity.
###
Jeb Handwerger
email: thehandwergers@bellsouth.net
website: www.goldstocktrades.com
Gold Stock Trades Editor Jeb Handwerger is a highly sought-after stock analyst syndicated internationally and known throughout the financial industry for his accurate and timely analysis of the equities markets, particularly the precious metals sector. Subscribe to his FREE Newsletter right now.
Read full disclaimer by clicking here…
Silver Update
Many investors have been freaked out by silver’s recent breakdown from a Descending Triangle and the sharp drop that followed, but as we will see this morning there is now a strong case to make for silver either being at its low for this cycle, or very, very close to it.
We’ll start by looking at silver’s 6-month chart, on which we can see its recent action in detail. Here we see the breakdown from the Triangle (shown on the 4-year chart below) and the resulting sharp drop. This drop is now regarded as a final capitulation following the long and grueling downtrend that preceded it. Note the pronounced high volume bull hammer that occurred early last week. There is a good chance that this marks the final bottom, and if not, we are considered to be very close to it. This hammer was followed the next day by a “spinning top” candlestick, a sign of indecision and another sign that the downtrend has exhausted itself. You may recall that it was stated in the Silver updateposted on the site a couple of days ago that “Traders wanting to buy here have a low risk setup, as silver may be bought here, or ideally on a short-term dip towards the hammer intraday low, with a stop a little below the low of the hammer.” Well, the price has since drifted back to the vicinity of the hammer low, and on Thursday dropped to a whisker below it intraday, and this may turn out to be a near perfect entry point. Before leaving the 6-month chart, note how horribly oversold silver is on its short-term oscillators after its prolonged downtrend, especially its RSI which shows it to be super-critically oversold.

Now let’s see
what has got so many traders freaked out on the 4-year chart. On this chart we can see the breakdown from the Descending Triangle which has been forming from late June last year. We can readily understand why this has got so many people worried as it looks like silver is starting another heavy downleg just going on this chart, but before we join this crowd, let’s quickly move on to consider why this breakdown is believed to be a bear trap, and why the bullish case for silver is now strong.

The 15-year chart presents the other side of the story, as it reveals that silver has still not broken down from its long-term uptrend in force from 2003 and is still in a zone of major support arising from the extensive trading in this price zone in 2008 and again in late 2009 and 2010. This chart makes plain that while silver has certainly been in a bearmarket from April – May 2011, in the larger scheme of things this may only be a severe correction within an ongoing major bullmarket.

Now let’s move on to see what the latest COT and sentiment indicators have to see about silver at this juncture. In a word, sentiment towards silver stinks – it is absolutely awful, and the number of people that you know who are bullish on silver you can probably count on the fingers of one hand – this is the classic extreme of negative sentiment that is the hallmark of a bottom.
The standard silver COT is now most encouraging. It shows that at last positions have eased to a low level that must be construed as bullish. The formerly enthusiastic Large Specs, who are always wrong, have given up and are out.

The silver hedgers chart (which is a form of COT chart that goes back further), shows that readings are now rapidly swinging into bullish territory.

Larger Image Above
Chart courtesy of www.sentimentrader.com
Next we move on to the silver optix or optimism index where we see that sentiment is already at an extreme that in the past has already correlated with an important bottom, or been close to it. This chart alone makes a strong case for a silver bottom here.

Larger Image
Chart courtesy of www.sentimentrader.com
While we normally look at the US dollar in gold updates only, it is so important to both metals and at such an extreme that we will include a look at it in this silver update.
The whole world is optimistic on the dollar now, probably up to and including IS, which is understandable considering how many greenbacks they have robbed from banks, and sentiment towards it is at wild “off the scale” bullish extremes. For this reason, a correction in the dollar looks imminent, even if it later continues higher for a while, and if it is gold and silver should turn higher. Let’s now review the evidence.
First, the long-term 11-year chart for the dollar index shows the runup of recent weeks in the context of prior pattern development, and while the runup so far doesn’t look all that big historically speaking, it has arrived at a twin target and is critically overbought on its RSI indicator.

The 4-year chart shows to advantage the dramatic spike in the dollar index, which has resulted in it arriving at the target shown in a wildly overbought state. Thus it is now vulnerable to a sudden reversal.

The 6-month shows recent action in detail, and how the dollar’s advance has ramped up in stages. The RSI indicator at the top of the chart shows that it has been critically overbought for over a month, a situation which cannot persist indefinitely.
Next, the dollar hedgers chart (COT) shows that positions are already at record extremes – this chart calls for a reversal, and very soon.

Larger Image Above
Chart courtesy of www.sentimentrader.com
Meanwhile, the dollar optix or optimism index chart shows that optimism also is already at record extremes and is “off the scale” – optimism is so widespread that Barack Obama no longer feels the need to put his cup down when saluting the military – and here we should note that we are much more worried about the example set to youngsters not by his saluting with a plastic cup in his hand, but that it appears to be a nasty carcinogenic polystyrene cup. The record shows that such wild optix index extremes have almost always coincided with a top or closely preceded it.


Larger Image Above
Chart courtesy of www.sentimentrader.com
Finally, the dollar seasonal chart, which is admittedly only a background influence, shows that the next few months are not historically the best time of year for the dollar

Conclusion: although we have vacillated in the recent past – with good reason given that silver just made a new low, we can now emphatically conclude that silver is believed to be either at or very close to an important low here, especially as the dollar looks set to turn lower soon. Only in the event of an immediate all-out across the board deflationary plunge would silver prices be likely to drop further.

-
I know Mike is a very solid investor and respect his opinions very much. So if he says pay attention to this or that - I will.
~ Dale G.
-
I've started managing my own investments so view Michael's site as a one-stop shop from which to get information and perspectives.
~ Dave E.
-
Michael offers easy reading, honest, common sense information that anyone can use in a practical manner.
~ der_al.
-
A sane voice in a scrambled investment world.
~ Ed R.
Inside Edge Pro Contributors

Greg Weldon

Josef Schachter

Tyler Bollhorn

Ryan Irvine

Paul Beattie

Martin Straith

Patrick Ceresna

Mark Leibovit

James Thorne

Victor Adair