Gold & Precious Metals

Destroying the Dollar a Penny at a Time

recent article on the Wall Street Journal’s blog draws attention to the high cost of producing a single penny – 1.6 cents each, to be exact. They blame this unsustainable price on the high cost of zinc, which makes up 97.5% of every American penny. The online publication Quartz ran with this story, giving it a new headline: “It costs 1.6 cents to make one penny because of the rising price of zinc”. Time for a short economics lesson. (Ed note: Richard Russell has an article that boost Pete’s point about currency debasement HERE)

An alternate, more accurate headline for this story would be, “It cost 1.6 cents to make a penny because of currency debasement.” Rather than pondering whether or not the United States should simply stop producing pennies to save money, Americans should really be thinking about the long-term effects of currency debasement that has been going on for generations.

To debase a currency is to weaken its purchasing power. This is often done by inflating the money supply through quantitative easing, which the Federal Reserve has been practicing for years. When a currency is debased, a unit of that currency doesn’t buy the same amount of stuff that it once did. The US dollar has been seriously debased over the last hundred years or more. Just take a look at the handy infographic at the end of this blog post to see how bad it has become.

Currency debasement is the same reason why the US ditched the copper penny in 1982, as well as silver half-dollars, quarters, and dimes in 1964. Today we call these old silver coins “junk silver,” and they’re popular physical precious metals investments. However, they’re anything but junk – they actually contain a useful commodity that has held its value for centuries. It’s not that zinc or copper or silver has become “too expensive,” it’s that those coins have lost some of their purchasing power.

The government debases our currency and says it is because it became too expensive to produce instead of the real reason – destructive monetary policies. The policies of central banks around the world are supposed to stabilize economies and protect the people from currency debasement. However, the truth is that these policies only enrich the politically well-connected, while hurting the poor, those on fixed incomes, and savers.

When currencies aren’t debased, prices tend to fall, not rise. This gives more purchasing power to the poor, those on fixed incomes, and savers. It also decreases the need to gamble savings in the stock market, which means you have fewer bubbles like the one we’re experiencing right now.

So the next time a friend brings up the pretty well-know fact that it costs more to produce a penny than its worth, take the time to educate them about currency debasement.

35210 b

his article first appeared on Peter Schiff’s Gold Blog.

To learn more about the destructive monetary policies of central banks and how to protect yourself from a collapse of the US dollar, subscribe for free to Peter’s Schiff’s Gold Videocast.

Bulletproof, Low-Cost Names

Can Gold Act as a Safe Haven Again?

Christos Doulis says six years ago when the financial crisis was in full swing, safe-haven buying made gold skyrocket. Today, the fear component is down, as is the price of gold. That is why Doulis believes investors need to own bulletproof, low-cost names that can survive this environment. In this interview with The Gold Report, Doulis discusses some M&A possibilities and points to management teams getting the most out of their low-cost precious metals assets.

Companies Discussed: Cayden ResourcesIntegra GoldSierra MetalsSilver WheatonAgnico Eagle Mines Ltd.: Alexco Resource: Endeavour Silver: GoGold Resources: Goldcorp Inc.Premier Gold MinesRio Alto Mining: Yamana Gold Inc.

The Gold ReportThe World Gold Council, which gets its numbers from Thomson Reuters GFMS, reports that total gold demand in Q2/14 fell by 15% versus the same period in 2013. Furthermore, physical bar and official coin demand were basically cut in half while jewelry demand fell by 217 tons or 30%. What do you make of all of that?

Christos Doulis: Clearly, there has been less enthusiasm for owning gold in recent years. A lot of that has to do with the concept of gold as a safe haven. Six years ago, when the financial crisis was in full swing, gold was $800–900/ounce ($800–900/oz), but on its way to $1,900/oz in September 2011. The fears associated with that period have largely receded and we’re seeing a decrease in both gold investment and jewelry demand, which is often a form of savings in non-Western nations. We’re seeing a reaction in demand because the fear component that drives interest in the gold space is down significantly.

TGR: Meanwhile, central bank gold purchases were up 28% year-over-year. Is that the silver lining?

1CD: I’m a goldbug in that I think everything that has happened since 2008 is ultimately positive for precious metals prices. We’ve had a massive money printing exercise. The markets are running because there’s so much money and the money has to go somewhere. The fact that central banks are buying gold tells me that gold—the currency between states and central banks—is still regarded as an important part of the reserve mix. While the demand for gold among general investors may have decreased during the last few years, the policy makers in the central banks are well aware of the seeds that have been sown in a fiat-currency race to the bottom.

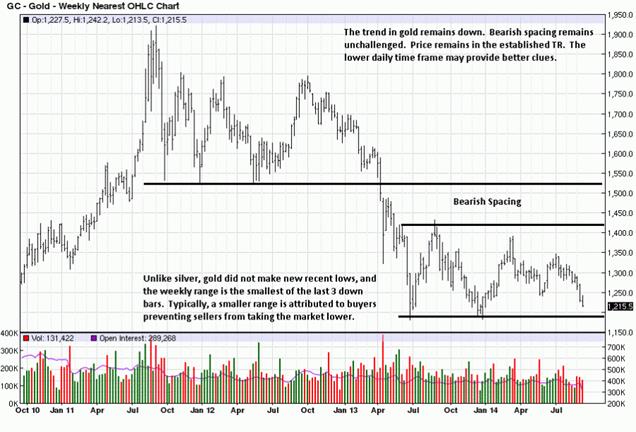
TGR: With the U.S. economy seemingly strengthening, gold seems destined to trend lower in the near term. What’s your view?

CD: The trend is certainly negative. There is an argument going around that a triple-bottom is forming and it could lead to upward momentum going forward. The other side of that argument is that gold has broken through many of the moving averages and seems to have little support. Gold could trade sideways with a slightly negative bias for quite some time.

TGR: What’s your near-term gold forecast?

CD: I don’t like to prognosticate about the short term, but I am still a believer in higher metals prices in the medium and long term—it’s all about money creation. We’re still in a stagnant global economy. The fear associated with 2008–2009 has receded but when it comes to unemployment, median household income, etc., the new normal is more ugly than the old normal. At some point metals and real things are going to outperform paper things like stock markets, fiat currencies and bonds, but I can’t predict when that will happen.

TGR: Would you consider yourself a silver bug, too?

CD: Generally, yes. Silver tends to outperform gold both on the up and down side. If gold goes down 2%, silver could go down 3%. On a technical basis I have serious concerns about the metal in the short term.

2TGR: What’s your investment thesis for gold and silver equities as gold trends toward $1,200/oz and silver toward $18/oz?

CD: You want to own the gold producers with all-in costs less than $1,000/oz and silver producers with all-in costs below $15/oz. They may not get the EBITDA numbers higher-cost producers would if the metals turn around, but the low-cost producers can survive a long period of weak metals prices.

TGR: Would you talk about what is happening in the merger and acquisition (M&A) space?

CD: Cayden Resources Inc. (CYD:TSX.V; CDKNF:OTCQX) recently received a takeover bid from Agnico Eagle Mines Ltd. (AEM:TSX; AEM:NYSE). I expect to see other senior producers make bids for early-stage developers.

A lot of M&A activity tends to take place at tops or near bottoms. I’m still a gold bull but I could see sideways or negative trading for some time. Wise mining company CEOs are looking to pick up quality assets now. I expect more M&A activity for quality assets during this period of price weakness.

TGR: What are some things investors can learn from Agnico’s bid for Cayden?

3CD: There have been other significant M&A deals like Yamana Gold Inc. (YRI:TSX; AUY:NYSE; YAU:LSE) and Agnico buying Osisko. Those two senior producers bought a lower-cost producer. Cayden is not a producer but it’s a quality project that will likely be among the lower-cost producers. I expect more M&A activity but it’s not going to be for the marginal assets with all-in sustaining costs in the range of $1,400/oz or higher. Acquirers want assets that can generate positive free cash flow at $1,000–1,100/oz gold. The industry is seeking to protect itself from the downside momentum in metals prices.

TGR: What are some potential M&A targets in the junior mining space?

CD: One that I quite like and believe is an M&A target is Premier Gold Mines Ltd. (PG:TSX). Its primary asset is the Trans-Canada project near Geraldton, Ontario. The Hardrock deposit is an open-pit deposit running about 1.5 grams per ton (1.5 g/t) gold with a decent stripping ratio. It’s a long-life asset that should produce 200,000 ounces (200 Koz) annually. That’s the kind of project that would likely attract M&A interest from an intermediate or major producer. Hardrock should be in the lower half of the cost structure and it’s in Canada. Over the last couple of years we have seen a return to politically favorable jurisdictions like Canada.

TGR: Premier Chairman Ebe Scherkus was once chief operations officer at Agnico Eagle. He and the team that he has assembled are developing Hardrock the same way a major producer would. How much of an advantage is it when you have proven operators developing a preproduction asset?

CD: That is a testament to the quality of the asset and the quality of the people involved in Premier, from CEO Ewan Downie on down. Even if Premier doesn’t get a takeover bid, its intention is ultimately to put Hardrock into production. Premier doesn’t have the financial resources to do so today, but as confidence in Hardrock increases Premier may be able to get the capital required to build Hardrock. My thesis is that it gets taken out before that.

TGR: Premier recently reached an agreement with Newmont Mining Corp. (NEM:NYSE) to consolidate 100% ownership of the Cove project in Nevada. Your thoughts?

CD: It was a good deal for Premier because Newmont had a back-in right at 2.5 times exploration spending so there was little incentive for Premier to spend to develop the Cove assets. With the ownership situation cleared up, Premier should feel more comfortable spending exploration dollars to unlock value at Cove, which has a historical grade of 10+ g/t: the resources at Cove are pre-NI-43-101. Cove is a small piece of my valuation for Premier but with drills turning, the company should be able to quickly add meaningful ounces.

TGR: Premier is developing Trans-Canada, Red Lake and Cove. Does the company get sold in pieces or as a whole?

CD: A lot of the value is in Hardrock. It’s the biggest resource. I could see an acquirer buying Hardrock and spinning the rest of the assets into another company. There is always a chance that Premier could do a deal with Goldcorp Inc. (G:TSX; GG:NYSE) on the Red Lake assets and use the cash to advance Hardrock. Goldcorp is the logical buyer for the Red Lake assets given the joint venture relationship.

TGR: Any other potential takeover targets?

CD: I cover Rio Alto Mining Ltd. (RIO:TSX.V; RIO:BVL), which recently completed the takeover of Sulliden Gold Corp. Rio could be in play now. The company will produce 200 Koz gold equivalent at La Arena this year, and with the acquisition of Sulliden’s Shahuindo gold-silver project in Peru, Rio Alto has another potential 100 Koz asset. Rio Alto has done a great job with La Arena, and Shahuindo should give the company life beyond the five years worth of oxide reserves at La Arena.

TGR: Is there a possibility that the mine life could be extended?

CD: Absolutely. On May 15, Rio reported a drill intercept of 314 meters of 0.7 g/t gold and it extends far outside the existing La Arena pit boundary.

TGR: With the Sulliden transaction all wrapped up and the costs at La Arena dropping in Q2/14, Rio looks poised to deliver more strong results in Q3/14 and probably Q4/14. Why do you have a neutral rating?

CD: I was an early champion of Rio Alto four years ago. On the back of the Sulliden deal I took my target down to $2.50 from $3.25 and my rating to Hold from Buy. The stock is currently above $3/share. My take on Rio is that it’s a Hold. It’s fully valued at current metals prices and the premium it’s getting is due to the market’s perception that Rio can do with Shahuindo what it did with La Arena, which may be correct.

President and CEO Alex Black is a mining engineer with a good track record; Shahuindo should ultimately be a low-cost asset. I’m eating a little crow on this one, but at the same time I wouldn’t be chasing it north of $3/share in a $1,230/oz gold price environment.

TGR: Freeport-McMoRan Copper & Gold Inc. (FCX:NYSE) has considerable assets in Peru. Do you see Freeport as a potential acquirer?

CD: It could be Freeport. It could be Barrick Gold Corp. (ABX:TSX; ABX:NYSE). Barrick is already active at Lagunas Norte, which is close to La Arena. With the Sulliden acquisition, Rio Alto is getting the mass where it could become an M&A target.

TGR: Do you expect takeover bids for any other companies under coverage?

CD: Premier is my top pick for M&A. Rio Alto is likely my second choice. I don’t expect a bid for Sierra Metals Inc. (SMT:TSX)Alexco Resource Corp. (AXR:TSX; AXU:NYSE.MKT), which I’ve just launched on, or Endeavour Silver Corp. (EDR:TSX; EXK:NYSE; EJD:FSE). Endeavour is more of a consolidator than a target.

TGR: Sierra Metals, like Rio Alto, has a mine in Peru that is performing above expectations. Tell us about the Yauricocha silver-copper-lead-zinc mine.

CD: Yauricocha is a polymetallic underground mine in the mountains of Peru that has low-cost cash costs per ounce of silver—usually in the negative $20/oz range—because of byproduct credits. The company will survive a period of weak metals prices and because of its polymetallic nature, an investor is not betting on only one commodity.

The base metals add an industrial component. The Arias Resource Group, a Peruvian company, owns a large equity position in Sierra Metals, so Yauricocha doesn’t get a lot of attention. There are not many assets like it. I have a $2.60 target and a Buy rating.

TGR: I should note that Sierra owns roughly 82% of Yauricocha.

CD: Yes, it is not 100% owned. A publicly listed company on the Peruvian Exchange owns the other chunk. This 18% interest is in a Peruvian publicly traded vehicle (Corono) that commands a high valuation because of the dividends associated with it.

TGR: What does Sierra plan to do with its cash flow?

CD: The cash flows are going to go into its Mexican assets—Cusi and Bolivar, which are ramping up as we speak. Yauricocha is the engine that provides the cash for the growth of the company in Mexico.

TGR: On Endeavour Silver, your target price is $6.10, while at least one other analyst has a $7.30 target. How do you explain that gap?

CD: It could be related to silver price assumptions or that analyst could be ascribing a higher net asset value multiple to some of Endeavour’s assets. Most of the other analysts are closer to my target than $7.30. I have a Hold rating because the stock ran up to $6/share.

TGR: Where does growth come from? Is it all about San Sebastián?

CD: Yes. Endeavour has done a good job growing San Sebastián. That’s where the majority of growth could come. Don’t forget that the company is still turning around El Cubo and it has had substantial exploration success in the El Cubo area. We could see some production growth from the existing assets, but it’s going to be incremental. The real growth will come with a production decision at San Sebastián.

TGR: What are your thoughts on Endeavour’s management?

CD: CEO Brad Cooke has done a pretty good job. Endeavour has not made silly acquisitions when silver prices were falling. I want a CEO who doesn’t buy growth for the sake of growth. Cooke buys assets for the bottom line rather than just to make the company bigger.

TGR: You said you recently launched coverage on Alexco. Tell us about it.

CD: Alexco is a Canadian silver company that owns the past-producing Bellekeno silver mine in the Yukon. The Keno Hill district was a prolific silver-producing region in the 19th and 20th centuries until it basically shut down in the 1990s due to low metal prices. With a series of little mines everywhere, it was a big environmental mess for the government. Alexco, originally an environmental reclamation company, acquired the district from the government to conduct remediation work, but also to put some of the old mines back into production.

Alexco put Bellekeno back into production in January 2011 against a backdrop of strong silver prices and delivered some good results. But as the silver price cratered, the company faced significant challenges and the mine shut down in 2013. Now the company wants to restart it. What’s different given that silver prices are still weak? A new deposit called Flame & Moth, which is adjacent to the mill. This deposit should allow Alexco to run its 400-ton-per-day mill at capacity, thereby lowering its unit per ton costs.

Alexco also renegotiated its deal with Silver Wheaton Corp. (SLW:TSX; SLW:NYSE). It was selling 25% of silver production at $3.90/oz to Silver Wheaton, which was acceptable when silver was $35/oz. But at $20/oz Alexco was selling one out of every four ounces to Silver Wheaton at more than $15 below spot. That means the other three ounces were effectively adding $5/oz to its costs.

TGR: What’s the risk profile?

CD: It’s very speculative because Alexco needs to raise money to pay Silver Wheaton and drive the decline into the Flame & Moth deposit. That said, the mill is already built and the district is robust. It’s tough to be in the silver space at $18.75/oz. It is not a price where a lot of companies can make much money.

TGR: What is your target on Alexco?

CD: $1.40. The stock is trading a little below $1/share.

TGR: Are there some other equity narratives that you would like to share with us?

CD: A name that I don’t cover, but that has had some good news lately is GoGold Resources Inc. (GGD:TSX). Its first asset is the Parral Tailings project, where the company is reprocessing tailings from the old La Prieta base metals mine in Mexico. It’s basically a dirt moving operation that went into production in the summer. The preliminary economic assessment (PEA) suggests it could produce 1.3 million ounces of silver per year for 12 years at $10/oz all-in sustaining costs. If silver price weakness continues, GoGold could still generate free cash flow.

TGR: Does that account for the recent price spike?

CD: GoGold acquired Animas Resources some time ago for about $10 million ($10M). In that deal it acquired a project called Santa Gertrudis in Sonora, Mexico. At $1,250/oz gold, the recent PEA for Santa Gertrudis shows a $150M net present value at a 5% discount rate.

Another company that I don’t cover is Integra Gold Corp. (ICG:TSX.V; ICGQF:OTCQX), near Val-d’Or, Quebec. It has a high-grade deposit and the company just signed a deal to acquire the old Century Mining mill out of receivership. Basically, Integra is putting all the pieces together to build a mine. It has a high-grade resource. It will soon have a mill. It has a mining permit in a mining-friendly camp with a long history. I see it as a potential takeout candidate.

TGR: Any last thoughts for investors in this space?

CD: Since December, support has been breaking down for metals prices. One would expect all of these equities to be a sea of red given the negative gold phase that we’ve witnessed, yet quality equities like Rio Alto and Premier have been either flat or mildly positive as the gold price declined. The market seems to be leaning more toward the triple-bottom thesis than any further breakdown of support. If you believe that equities lead the market, they seem to be saying that the triple-bottom is the more likely scenario and that the worst is behind us.

If it isn’t a triple-bottom, then you want to own bulletproof, low-cost names because they’re going to survive. And be cognizant that the market is paying up for management that has delivered into or above expectations. In a market like this management groups that do not meet expectations are going to get penalized. I would try and bet on good jockeys, as well as low-cost projects.

TGR: Thank you for your insights, Christos.

Christos Doulis, a mining analyst with PI Financial, has spent 20 years in a wide variety of roles within the mining industry. Doulis was a mining research analyst at Stonecap Securities from 2010 to 2014. Previously he was a partner at Gryphon Partners Canada, an advisory firm in the mining industry that was acquired by Standard Chartered, and a vice president at Blackmont Capital. Doulis began his career as a research associate in 1994 at Scotia Capital. He covers a variety of gold and silver companies in the small- to mid-cap market with a focus on producers and late-stage development companies. Doulis obtained a Bachelor of Arts in economics from Queen’s University and holds the CFA designation.

Want to read more Gold Report interviews like this? Sign up for our free e-newsletter, and you’ll learn when new articles have been published. To see recent interviews with industry analysts and commentators, visit our Streetwise Interviews page.

Related Articles


DISCLOSURE: 
1) Brian Sylvester conducted this interview for Streetwise Reports LLC, publisher of The Gold Report, The Energy Report, The Life Sciences Report and The Mining Report, and provides services to Streetwise Reports as an independent contractor. He owns, or his family owns, shares of the following companies mentioned in this interview: Rio Alto Mining Ltd. 
2) Christos Doulis: I own, or my family owns, shares of the following companies mentioned in this interview: Integra Gold Corp. I personally am, or my family is, paid by the following companies mentioned in this interview: None. My company has no financial relationship with the companies mentioned, but may otherwise be associated with said companies at any given time. I was not paid by Streetwise Reports for participating in this interview. Comments and opinions expressed are my own comments and opinions. I determined and had final say over what companies would be included in the interview based on my research, understanding of the sector and interview theme. I had the opportunity to review the interview for accuracy as of the date of the interview and am responsible for the content of the interview. 
3) The following companies mentioned in the interview are sponsors of Streetwise Reports: Cayden Resources Inc., Integra Gold Corp., Premier Gold Mines Ltd., Sierra Metals Inc. and Silver Wheaton Corp. Goldcorp Inc. is not associated with Streetwise Reports. Streetwise Reports does not accept stock in exchange for its services. The companies mentioned in this interview were not involved in any aspect of the interview preparation or post-interview editing so the expert can speak independently about the sector. 
4) Interviews are edited for clarity. Streetwise Reports does not make editorial comments or change experts’ statements without their consent.
5) The interview does not constitute investment advice. Each reader is encouraged to consult with his or her individual financial professional and any action a reader takes as a result of information presented here is his or her own responsibility. By opening this page, each reader accepts and agrees to Streetwise Reports’ terms of use and full legal disclaimer.
6) From time to time, Streetwise Reports LLC and its directors, officers, employees or members of their families, as well as persons interviewed for articles and interviews on the site, may have a long or short position in securities mentioned. Directors, officers, employees or members of their families are prohibited from making purchases and/or sales of those securities in the open market or otherwise during the up-to-four-week interval from the time of the interview until after it publishes.


Gold & Silver – Current Price Is The Story

Forget all the news, all the fundamentals, all the [mostly errant] price projections. There is a reason why a picture is worth more than 1,000 words, and this is one of those times where it is best to focus on pictures of the market, over various time frames, to get a better handle on what to expect moving forward. Put to rest every so-called PMs pundit or blogger that has persistently been calling for higher prices or saying the low is in.

We keep saying that the best and most reliable indicators come from the market. Time to stop listening about what others have been saying about the market and pay closer attention to what the market is saying about others. Several months ago, we expressed the thought that 2014 would likely be more like 2013 and to not expect a dramatic increase in gold and silver prices. Even that was optimistic as silver just reached recent 4 year lows.

Are the markets manipulated? Absolutely! The United States and United Kingdom are both in the throes of desperation to keep alive the largest ever Ponzi scheme, that of Western central banks run by the unelected bureaucrats of the Bank for International Settlements [BIS], and all of the similarly unelected bureaucrats from the International Monetary Fund [IMF], who rule over all Western governments. Gold, and silver to a much lesser extent, are the proverbial wooden stake to be driven into the heart of the fiat system which rules over your life, realize it or not, like it or not.

Have these unseen faces been successful in suppressing PM prices? Without question. Can it continue? Without question, but the increasingly pertinent question now is, for how much longer? No one has the answer, which has been proven despite the never-ending opinions asserted over the past few years. With each passing month it becomes sooner rather than later, but even sooner is taking longer than most have expected.

A look at the charts tells us in no uncertain terms that the end is not yet in sight. Here is our read of what the market is saying, and has been saying for some time. We start with silver because it just broke to low levels not seen for the past 4 years. The importance of acknowledging the trend deserves front and center attention because this simple circumstance is so often overlooked for its power to prevail over price direction. Bearish spacing is also mentioned because of what it connotes: a bearish undertone in the market. With successive lower swing highs, the message of both the trend and bearish spacing have gone unchallenged, and that means there is no way the down trend can end. The KISS principle at work.

Even in a down market, past support still has validity to check, at least temporarily, any downward momentum. It does not mean a turn in trend is imminent, so one should not read sentiment into market reality, rather, just be aware and pay closer attention to how price develops/reacts around this possible support area.

The weekly chart is context, and we look at the daily chart for more clarity, if any is to be found.

Larger Chart

image002


There are no definitive signs of trend change. None. We can see that silver has reached an oversold market condition. That being said, it can never be forgotten that oversold can easily become more oversold, so this current condition is no reason to take a position from the long side in anticipation of an upside reaction.


Ask yourself a simple question. Over the past 4 years, how many longs are showing a profit? Counting on just one hand may provide an adequate answer. Is that the kind of position in which you want to find yourself? This is why the trend is your friend.

Larger Chart

image004

Trust us, a 60 minute chart is not going to overrule to strength of a weekly chart. What we want to see here is how the market looks in the aftermath of last week’s decline. The picture tells an interesting story not seen on the weekly or even the daily chart. What you have to understand is the role volume plays in any market. It is akin to the energy, or the lack of energy behind any market move.

When you see sharp volume increases, pay close attention for it is usually smart money making a move, preferably without being detected. Knowing how to read volume activity, an art more than not, the intent of the market movers becomes more apparent. We are all like minnows that can buy and sell without any impact on the market. Smart money has substantial position size that must be moved over a period of days, sometimes weeks so as to not impact the market and show their hand.

The first line, marked “1″ at the bottom of the chart, shows the average volume turnover on any given day. The second line, “2,” shows notable volume pick-up and should be viewed more closely because the large market movers are doing something without trying to tip their hand.

Then, there are the exceptional spike volume standout days, such as what occurred last Friday as silver descended to 4 year lows. Anytime there is such an extreme, count on it being a change from weak hands into strong hands. Here, weak-handed sellers and stops are being triggered, and it is strong hands that are buying, strong hands that generate the exceptionally high volume. The public does not have the ability to independently create such strong volume, rather, the public reacts to it, almost always to its detriment.

What the intra day market activity from last Friday does is create a need to focus very closely on HOW the market develops over the next several days. Notice has been served that something important just occurred. When silver activity is viewed along with what transpired in gold, at the same time, the potential for change becomes a higher probability, but one that must still be confirmed.

The market is “speaking” for those willing to pay attention.

Larger Chart

image008

The standout difference between weekly gold and silver is that gold has not made a new recent low. In fact, gold did not even reach the TR support [Trading Range]. Is the market “speaking” here? Yes. In fact, it does all the time, the trend being its most important message for it tells everyone that the market momentum will persist in one direction for some undetermined length of time.

The market message we see is more at hand, and it is shown by the smaller TR from last week, compared to the two preceding weeks as the market has declined. The smaller range tells us that the downward momentum was stopped, to a degree, at a point in time where sellers have clearly been in control.

The fact that buyers prevented sellers from moving price lower than occurred does not mean the trend is changing, but it is a piece of information, just like in a jigsaw puzzle where one piece may not mean anything special, but when combined with a few other pieces interconnecting, a part of the puzzle become clearer.

A look at the daily chart may provide additional insight.

Larger Chart

image010

Within the same down channel as silver, gold did not even reach its lower support channel line, and that is a tribute to buyers for preventing sellers from exerting more influence with momentum on their side. We discussed how last week’s smaller range might be an important message, and the daily activity shows why.

Focus on the last 3 bars, all with red volume because each close was lower than the day preceding. The 3rd bar from the end was the widest range and lowest volume, and it tells us the there was Ease of Downward Movement [EDM], but the close was in the upper 3rd of the range, buyers winning the battle over sellers that day.

On the 2d bar from the right, volume increased, the bar range was smaller, and the close was near the high of the day, again, buyers are showing up and controlling sellers. Friday’s bar is the most interesting. Volume was second highest of the month. Increases in volume are usually attributable to smart money intervening, [which may account for why the prior two bars had higher closes; smart money trying to disguise their buying activity].

The question to be asked is, why did smart money increase the effort, via increased volume when price was at the low? It is not because they were selling into a hole, but more likely scooping up all the offerings from sellers and stops being triggered by the lower prices. Reading volume is an art form, and one can sometimes, even often, be wrong.

Maybe the intra day chart can add to the interpretation?

Larger Chart

image012

Indeed it does. The chart comments explain the set-up. Comparing the activity, [volume effort and extent of resulting price movement] between Wednesday and Friday confirms what was surmised on the daily chart read. Pay attention to these two days and what they mean for you will see this kind of activity repeat itself over and over in all markets and over all time frames. Frankly, most people do not know how to read charts, and that is why they offer opinions about what they think is happening instead of what the market is actually saying.

The volume effort from Friday is clearly higher than the volume effort from Wednesday, yet the EDM was much greater on Wednesday than it was on Friday. Here, you can see readily that strong hands were very active buyers on Friday, taking everything sellers had to offer, as well as all sell stops.

Will this mean a change in trend? No, but it could be an important step that leads to a change, if we see evidence that buyers are persistently putting in a greater effort than sellers. We need to be patient and wait for confirmation. Actually, there is no other choice. Those too impatient to wait for more confirmation are the ones who were more than likely selling out their longs on Wednesday and Friday from higher prices.

What does this mean for holders of the physical? More buying opportunities. What about those who bought at higher levels and have seen a “loss in value?” Ask yourself this question? Are you going to sell any of your holdings at these low levels? If no, then do not be bothered about where price is, unless you are buying more. One has not “lost” anything unless one sells. You have the best form of wealth preservation insurance for what is inevitable, and 5,000 years of history is on your side.

We have purchases of silver when priced at 47, and gold at 1,800. Is there any concern over having paid much higher prices? Not in the least. The reason for buying has not changed, and there was more buying of silver on Friday when price was just under 18. We practice what we preach.

It is wrong to focus on what one paid over the past few years as price peaked. It is necessary to look at the broader time frame. Those who have been buying silver since $4 and gold since $300 continue to do well. Keep in mind, a quarter made of 90% silver still buys a gallon of gas at today’s prices. When the price of PMs one day jumps a few hundred percentages overnight, as is likely to happen, those who paid top dollar for either metal will be overjoyed at their smart decision-making, although that is not currently how they feel.

The preference is for silver over gold, at this point where the ratio is around 68:1. In fact, in line with the previous article, Use Magic Of Gold/Silver Ratio, we are starting to look at switching some gold into silver. As a reminder, assume you exchange 10 oz of gold at 65:1, getting you 650 oz of silver. At some point in the future, the ratio may go under 35:1 or 30:1, and you switch back 650 oz of silver to gold at 40:1. You will then have 16 oz of gold, 60% more than previously held, all without risk, just by “playing the ratio.”

Steady the course PM holders. Add whenever possible


http://edgetraderplus.com/

#1 Most Read This Week: Fear is in the Wind!

The James Turk Fear Index has always been interesting www.fgmr.com.

1

It is an easy concept. The Turk Fear Index is a measurement of gold’s relative value in relation to currency. The Turk Fear Index centres on the US by comparing gold’s value to money but a fear index could be calculated for any country and any currency and for that matter the world as well. The US being the world’s largest economy is most likely a good indicator for the rest of the world.

The Turk Fear Index compares the stock in gold held by the central bank with the country’s currency outstanding (money supply). The Turk Fear Index uses M3 the broadest definition of money supply. The formula is simply

9-11-2014 12-47-47 PM


Besides being a measurement of gold’s relative value it measures gold trends. In that respect, it is not a lot different from the Dow Jones/Gold ratio. When the index is rising, there is concern or fear for the stability of the country’s monetary and banking system. When it is falling, it suggests that confidence has been restored. As can be seen there was growing concern about the US’s monetary and banking stability from 2001 on. That culminated in the financial collapse of 2008 when the global banking system almost collapsed because of the weight of bad loans backed by derivatives that few understood. The world (primarily the US, EU and Japan) embarked on a massive bail out of the financial institutions and a program of quantitative easing (QE). Since 2009, the US has had three programs of QE although they are currently in the process of winding QE3 down.


Gold and the Fear Index peaked in 2011. After that, it appears as if confidence has been restored and the Fear Index has been falling (along with the price of gold). The world and the US have been going through a period of grudging slow economic growth and the financial system appeared to have returned to stability. With confidence seemingly restored, the world has gone back to its ways prior to the 2008 financial collapse.

Governments have passed legislation that would shift the burden of bailouts of the banking system at the expense of the taxpayer in the event of a financial/banking collapse to a system of bail-ins where the depositor’s and bond holders funds would be at risk (subject to the limitations of bank insurance that covers deposits). Little or nothing has been done to change governance in financial institutions. The US banking lobby has fought successfully against reinstating Glass-Steagall that limited securities activities in banks and securities firms.

In 1999, Glass Steagall was repealed and affiliations between banks and securities firms got underway. In the US a small handful of bank/securities firms dominate. They include JP Morgan Chase, Citibank, Bank of America, Goldman Sachs and Morgan Stanley and Wells Fargo Bank. Goldman and Morgan Stanley are two former securities firms who have converted themselves into bank holding companies in order to be eligible for FDIC insurance as would the banks. Canada broke down its four pillars (banks, trusts, insurance and securities) in the late 1980’s. The big five banks dominate Canadian banking and securities.

What ending Glass Steagall and breaking down the four pillars did was to allow the securities arms of the giant banking institutions to use the balance sheet of the bank for securities trading. This allowed the securities arms to leverage up the bank’s balance sheet 20, 30, 40 and 50 to 1 and sometimes higher. If things went wrong as they did in 2008 it was okay as the taxpayer through FDIC in the US and CDIC in Canada could bail out the bank. The major banks in the US received over $700 billion under a program called TARP and banks in Canada also received bailout money. It all came from the taxpayer. The money has been mostly paid back but the bank/securities firms went right back to their previous ways using the banks’ balance sheet to leverage up their securities trading operations. Leverage today is as high as it was pre-2008.

Since the financial crisis of 2008, debt has grown considerably. According to the Bank for International Settlements (BIS), global debt has grown by roughly 40% since 2007 to $100 trillion. As central banks in the western economies have suppressed interest rates, borrowing has soared. While a great deal of the debt growth has been government, individuals and corporations have also increased their borrowing. Tradable US Government debt has soared from $4.5 trillion in 2007 to over $12 trillion today. Globally corporate debt has soared roughly $21 trillion.

There has also been considerable growth once again in sub-prime type lending that was at the centre of the 2008 financial collapse. The growth has come in housing, which was the area behind the 2008 financial collapse as well as student loans and other areas such as car loans. Derivatives have also grown as debt has grown. Today it is estimated that total global derivatives outstanding exceeds $1 quadrillion although official figures show roughly $750 trillion. The major US banks noted above dominate this business in both the US and globally.

2

Rather than creating a system of stability and confidence, the old practices have continued and the amount of debt outstanding has soared. A shock to the financial system similar to what occurred in 2007 with the sub-prime crisis could cause a financial collapse larger than what occurred in 2008. Yet the Fear Index is not reflecting that. Has complacency that nothing could go wrong overwhelmed common sense? The perception is that the government has the banks backs and if anything does go wrong government would come to the rescue irrespective of the shift from a bailout program to a bail-in program.

The Fear Index is testing support of a rising trendline from the low of 2001. This is not dissimilar to the price of gold itself that is testing its long-term support. Yet there remains fear that gold is going to collapse even further to $1,000 to $700. Gold sentiment is close to where it was at the 2008 financial crash low although still above where it was in 2001.

With sentiment so low, (yes it could get lower) odds are more favourable for a rebound to get underway rather than another collapse. Yet the possibility of another collapse remains. The background is becoming potentially more negative. Global geopolitics are causing instability. The ramping up of the war against the Islamic State (IS) is probably not a potential flash point to trigger a financial crisis. But the war has cost the US roughly $500 billion so far and it has barely begun. The previous wars in Iraq and Afghanistan cost the US between $4 to $6 trillion. The cost of the wars are added directly to the US debt.

A possible overlooked issue concerning the war with IS is that IS is trying to change the borders of countries that have existed since the Treaty of Paris 1919 when Britain and France divided up the remains of the Ottoman Empire after WW1 with little regard to the people that lived there. IS had been operating in Syria and the war against IS did not begin to ramp up until IS crossed the border into Iraq and began to tear down symbols of the border in order to create a Sunni caliphate stretching from Syria into Iraq. If successful IS could seize the Kirkuk oil fields in the north of Iraq. These oil fields are currently under some control from the Kurds.

The crisis in Eastern Ukraine has more potential to become disruptive. Sanctions against Russia are trade sanctions. Russia is the world’s 8th largest economy and has the potential to strike back economically. Trade wars do not work. They are lose-lose and not dissimilar to the “Beggar thy neighbour” policies of the 1930’s. Those policies, many believe, contributed significantly to the Great Depression.

The financial situation in the world is tenuous. There are numerous signs that many of the EU banks are insolvent. The US banks have major liquidity concerns. The EU is planning on embarking on another round of QE. Japan has been providing QE for the better part of two decades and all it has accomplished is that their government debt to GDP ratio has jumped to the highest of all the major western economies in excess of 200%. The US government debt/GDP ratio is over 100% yet everyone is touting that the US economy is recovering even as the EU and Japan are sliding back into recession and the Mediterranean countries in the EU remain in a depression. Numerous EU countries have debt/GDP ratios over 100 and even the major EU countries (Germany, Britain, France) have debt/GDP ratio’s over 80. A debt/GDP ratio over 100 could shave at least 1% off economic growth according to most economists.

Worse, the debt ridden western economies led by Britain and the US are pressuring NATO members to ramp up their defence spending because of Russia and the crisis in Ukraine. Given that many of them are suffering under austerity measures or trying to cut back on debt, it will most likely be left up to the US, the world’s most debt ridden nation, to lead the NATO forces in Europe.

Separation movements are underway in a number of countries and this could prove to be quite economically destabilizing if they are successful. With polls showing that the Scotland separation could be successful, it has already caused the British Pound to fall sharply and British politicians to rush to Scotland to try and convince them to stay. Political careers are riding on the outcome. Economic and social instability could follow a yes vote.

In Spain, there is a referendum to be held in Catalonia. Support for leaving Spain is split.  If Catalonia were to leave Spain, it could be very disruptive to the Spanish economy where they have 25% unemployment, 50% youth unemployment, have already come close to debt default and there has been ongoing social unrest including clashes with police.

If Scotland were successful in separating from Britain (after 300 years) it could embolden other separatist movements in Europe, Asia and even North America where in Canada there have been separatist movements in Quebec and Alberta and even in the US where secession papers reached the floor of state Congress’s in a few instances. Depending on the separatist movement, it could be peaceful or it could be met with a military response as is being seen in Ukraine.

Sharply growing debt; failure to correct the excesses that were a cause of the 2008 financial crash; insolvent banks being propped up by QE programs; growing geopolitical instability with the potential for war between the Great Powers; and, separation movements in a number of countries that could cause economic, financial, social and military disruption and embolden other separation movements.

Where’s the fear? The Turk Fear Index is testing a rising trendline from the 2001 low. This appears to be not dissimilar to the test of the rising trendline in the 1970’s. When the Turk Fear Index turned up again gold soared from $100 to $850. Gold sentiment is quite negative. Stock market sentiment on the other hand is at levels seen at the 1987 and even above the tops of 2000 and 2007.  Stories of gold collapsing to $1,000 and even $700 abound and the DJI soaring to 20,000 and 25,000.

Against this background Russia and China are continuing to try to move away from use of the US$ for trade purposes. China has arranged numerous swap agreements with a number of countries in order to conduct trade in Yuan. The most recent one is with Argentina.  Yuan trading hubs are being created in a number of countries. Russia and China are in the process of building a major pipeline that will allow Russia to refocus its energy exports to Asia rather than the EU. Russia and China will conduct trade in Rubles and Yuan. Russia is starting to demand payment in Rubles from the EU. These are attacks on the hegemony of the US$ as the world’s reserve currency even though neither the Russian Ruble or the Chinese Yuan have convertibility and global acceptance as does the US$.

The world appears to be entering a potential period of economic, financial, geopolitical and social instability. Fear is in the wind. But is anyone paying attention?

TECHNICAL SCOOP

CHART OF THE WEEK

Charts and commentary by David Chapman

26 Wellington Street East, Suite 900, Toronto, Ontario, M5E 1S2

Phone (416) 604-0533 or (toll free) 1-866-269-7773 , fax (416) 604-0557

david@davidchapman.com

dchapman@mgisecurities.com

www.davidchapman.com


Copyright 2014 All rights reserved David Chapman 

General Disclosures

The information and opinions contained in this report were prepared by Industrial Alliance Securities Inc. (‘IA Securities’). IA Securities is subsidiary of Industrial Alliance Insurance and Financial Services Inc. (‘Industrial Alliance’). Industrial Alliance is a TSX Exchange listed company and as such, IA Securities is an affiliate of Industrial Alliance. The opinions, estimates and projections contained in this report are those of IA Securities as of the date of this report and are subject to change without notice. IA Securities endeavours to ensure that the contents have been compiled or derived from sources that we believe to be reliable and contain information and opinions that are accurate and complete. However, IA Securities makes no representations or warranty, express or implied, in respect thereof, takes no responsibility for any errors and omissions contained herein and accepts no liability whatsoever for any loss arising from any use of, or reliance on, this report or its contents. Information may be available to IA Securities that is not reflected in this report. This report is not to be construed as an offer or solicitation to buy or sell any security. The reader should not rely solely on this report in evaluating whether or not to buy or sell securities of the subject company.

Definitions

“Technical Strategist” means any partner, director, officer, employee or agent of IA Securities who is held out to the public as a strategist or whose responsibilities to IA Securities include the preparation of any written technical market report for distribution to clients or prospective clients of IA Securities which does not include a recommendation with respect to a security.

 “Technical Market Report” means any written or electronic communication that IA Securities has distributed or will distribute to its clients or the general public, which contains an strategist’s comments concerning current market technical indicators.

Conflicts of Interest

The technical strategist and or associates who prepared this report are compensated based upon (among other factors) the overall profitability of IA Securities, which may include the profitability of investment banking and related services. In the normal course of its business, IA Securities may provide financial advisory services for issuers. IA Securities will include any further issuer related disclosures as needed.

Technical Strategists Certification

Each IA Securities technical strategist whose name appears on the front page of this technical market report hereby certifies that (i) the opinions expressed in the technical market report accurately reflect the technical strategist’s personal views about the marketplace and are the subject of this report and all strategies mentioned in this report that are covered by such technical strategist and (ii) no part of the technical strategist’s compensation was, is, or will be directly or indirectly, related to the specific views expressed by such technical strategies in this report.

Technical Strategists Trading

IA Securities permits technical strategists to own and trade in the securities and or the derivatives of the sectors discussed herein.

Dissemination of Reports

IA Securities uses its best efforts to disseminate its technical market reports to all clients who are entitled to receive the firm’s technical market reports, contemporaneously on a timely and effective basis in electronic form, via fax or mail. Selected technical market reports may also be posted on the IA Securities website and davidchapman.com.

For Canadian Residents: This report has been approved by IA Securities, which accepts responsibility for this report and its dissemination in Canada. Canadian clients wishing to effect transactions should do so through a qualified salesperson of IA Securities in their particular jurisdiction where their IA is licensed.

For US Residents: This report is not intended for distribution in the United States. 

Intellectual Property Notice

The materials contained herein are protected by copyright, trademark and other forms of proprietary rights and are owned or controlled by IA Securities or the party credited as the provider of the information.

Regulatory

IA Securities is a member of the Canadian Investor Protection Fund (‘CIPF’) and the Investment Industry Regulatory Organization of Canada (‘IIROC’)

Copyright

All rights reserved. All material presented in this document may not be reproduced in whole or in part, or further published or distributed or referred to in any manner whatsoever, nor may the information, opinions or conclusions contained in it be referred to without in each case the prior express written consent of IA Securities Inc.

The Alibaba IPO May Shine, But Gold is Glistening

Scotland voted to remain part of the United Kingdom, Alibaba (BABA) is going to become the United States largest initial public offering (IPO), U.S. stock market indexes are up nearly 2% this week, Treasury yields are near lows, and gold and silver prices are getting bludgeoned in the paper market.

While U.S. financial prognosticators are raving over Alibaba and the IPO, the price action in precious metals and in the broader U.S. equity indexes showed signs of weakness about the time it was announced that Alibaba could start trading in the low to mid eighties.

The gold and silver charts shown below demonstrates the strange price action in silver futures after the announcement regarding Alibaba’s likely price increase at the open of trading in the stock today.

35188 a

The chart below shows gold futures prices during the same time frame as the silver chart above.

35188 b

The hype surrounding the Alibaba IPO is almost nauseating. However, it may provide an excellent trade entry into a long position in precious metals. Both gold and silver have been under major selling pressure for several weeks.

In silver, the selling pressure started around July 15th of this year and the selling has not stopped. Silver futures prices dropped from roughly $21.50 to $18.50 an ounce in about two months. This represents a near 14% decline in the price of silver over the past 2 months.

Gold prices have also seen strong selling over the same period from July 15th to present. Gold prices fell from around $1,340 per ounce to a recent low slightly below $1,220 per ounce. Gold prices dropped nearly 9%, showing some strong relative strength against silver futures.

We have been watching the precious metals sector very carefully for several weeks and price action seems poised for a bounce as major support is underneath both silver and gold futures here. A break of these levels would trigger some potentially strong selling pushing metals prices considerably lower. The daily chart of gold futures is shown below:

35188 c

The $1,180 – $1,200 price level has shown major support for gold futures prices which is clearly depicted on the weekly chart of gold futures shown above. We are contrarian traders and the price action in precious metals is ripe for a potential bounce. We view the opportunity more as a trading opportunity than an investment opportunity for now, but that could change in the longer term.

As an options trader, we will likely use a put credit spread using the gold ETF (GLD) as the underlying asset. The trade will have defined risk and will capitalize on higher gold prices, the passage of time, and reduced volatility in GLD options. Recently the options alert service from TheTechnicalTraders has put up some huge winning trades and the track record has been impressive thus far.


About Chris Vermulen

Founder of AlgoTrades Systems., internationally recognized market technical analyst and trader. Chris is also the founder of TheGoldAndOilGuy.com, a financial education and investment newsletter service. He is responsible for market research and trade alerts for of its newsletter publication. He is the author of “Technical Trading Mastery – 7 Steps To Win With Logic” and has  been featured in Futures Magazine, Gold-Eagle, Safe Haven, The Street, Kitco and dozens of other financial websites.