
Gold & Precious Metals
In recent weeks we wrote about the ongoing consolidation in precious metals miners. We touched on the history of September, not as a bullish month but as an important inflection point. With the miners holding up well and Gold still holding its lows we thought a breakout could be coming. Yet we’ve been whipsawed before. Several times over the past year (and as recently as late July) we’ve written about the possibility of a final low in Gold to precede the next impulsive advance in the miners. These scenarios came to a major head this week and the nasty decline across the entire sector suggests the bears are back for one last time.
Below is our chart for Gold’s bear markets which are scaled to the 2011 peak. We exclude the two extreme bears (one lasted six years while the other was the post bubble crash). Longer bears tend to be less severe in price whereas the most severe bears in price tend to be short in time. Examples of that include the 1975-1976 and 1983-1985 bears. The 1987-1993 bear (the longest) only shed 35% while the 1996-1999 bear, which lasted three and a half years bottomed well above $1100 on the current scale. History makes a strong argument that while a new low is likely, anything much below $1100 appears unlikely.

The next chart shows all of the bear markets in Silver sans the 1980-1982 bubble crash. A close below $18.82 would mark a new weekly low. This analog makes a very strong case that Silver’s bear is likely to end in the coming weeks or months.

Staying with Silver, we note that while Silver could make a new low it would soon find 11-year trendline support. This is another reason we will be very bullish on Silver if it breaks to a new low.

So how does affect the miners?
Until days ago the miners looked very strong and on the cusp of a breakout. That possibility has gone out the window. The chart below shows a nasty reversal in our top 40 index which is down 7% on the week and officially broke its consolidation low on Thursday. The index closed Thursday at 382 and the next strong confluence of support is near 350.

GDXJ is down 9% this week and sliced through support on big volume. The next strong support is the previous low around $33. There is nearly 15% downside to that strong support.

Going forward, $1240 Gold and $1200 Gold on a weekly basis are key levels to watch. The miners are very oversold in the short-term and should bounce along with Gold (from $1240). However, the bears have regained control. The bear analogs are quite clear and the miners have suffered major damage which implies more downside. I don’t envision a buying opportunity for the miners until Gold and Silver make new lows. This week could mark the start of that final plunge that has eluded us several times over the past year. We invite you to learn more about our premium service in which we highlight the best junior companies and manage a real portfolio for subscribers benefit.
Good Luck!
Jordan Roy-Byrne, CMT

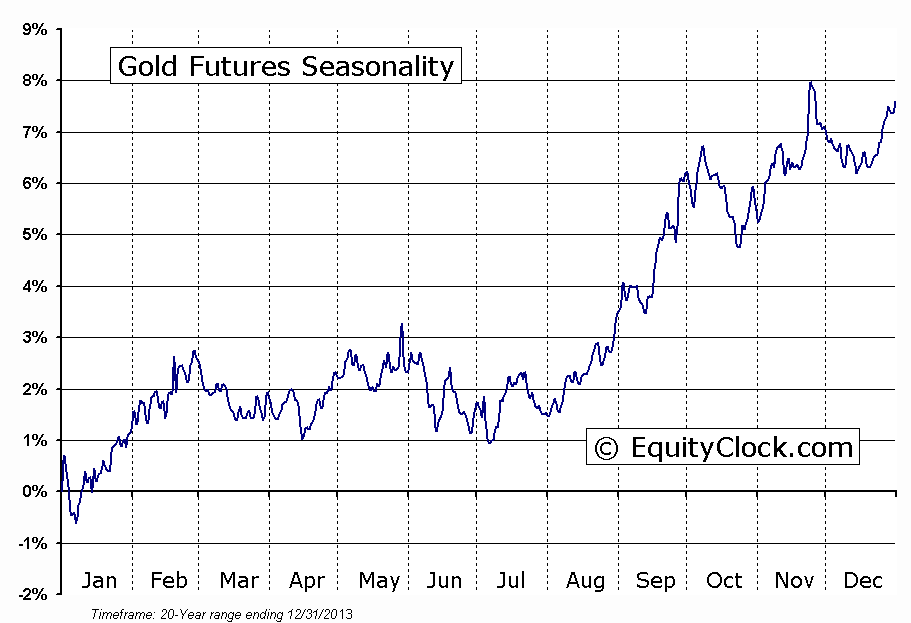
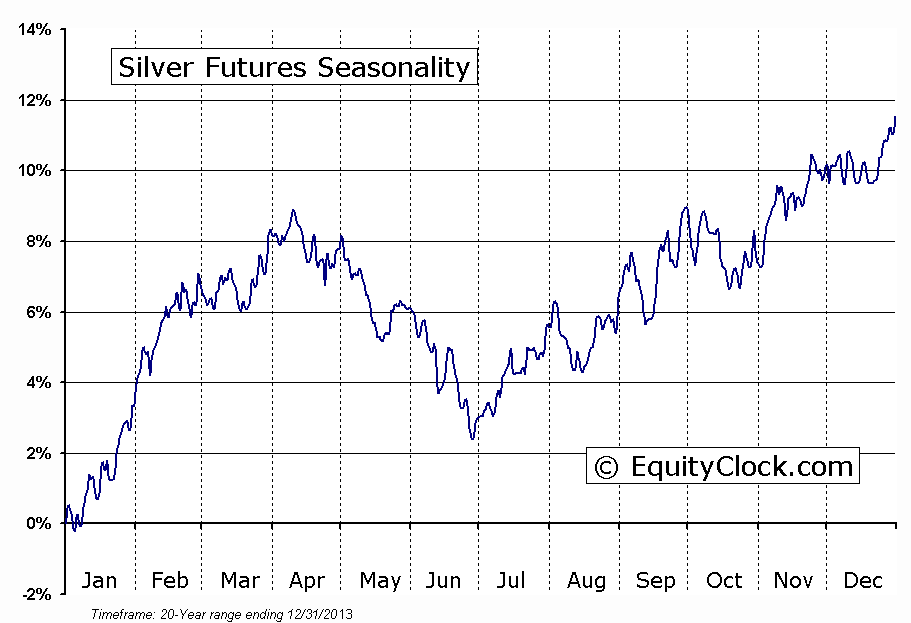
The month of September has historically been the strongest for precious metals. Since the start of the current bull market, gold has averaged a gain of 2.6% during the month of September. This is typically followed by a smaller gain of 0.8% in October and then a few more strong months in November, January and February. Taken together, we are exiting the weakest seasonal period for gold (Spring-Summer) and entering into the strongest seasonal period (Fall-Winter).
Chart & more commentary HERE
…Also seasonal charts from Equity Clock, you might also want to click on a chart below to be taken to Jon Vialoux’s excellent Stock Market Report for Sept. 4th – Money Talks Editor
Sometimes, when assets are stuck in trading ranges, it creates short-term trading opportunities.
I have been writing lately that precious metals and precious metal companies have been stuck in ranges. This continues to be evident in the SPDR Gold Shares (GLD), iShares Silver Trust (SLV) and Market Vectors Gold Miners ETF (GDX).
But are these ranges to buy … or beware of?
SPDR Gold Shares (GLD)
Below is a chart of GLD:
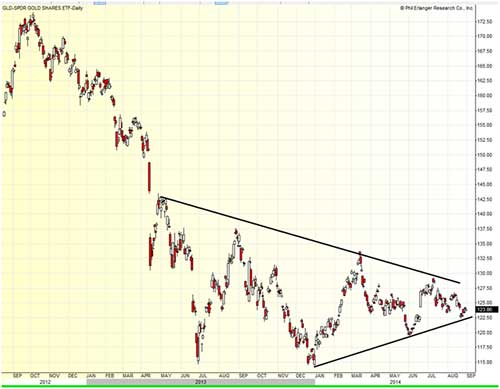
Let’s review the chart:
- It’s normal for prices, after a decline, to base (i.e., go sideways) for some time. Basing is considered a consolidation period.
- The basing started over a year ago.
- The basing pattern has turned into a neutral symmetrical triangle and participants are buying pullbacks, but selling rallies. A symmetrical triangle is considered a consolidation pattern.
- Prices did hold the bottom rising trendline and could currently rally to the “declining tops” trendline, the $127.50 area.
- Once prices reach an apex, they will normally follow the direction of the dominant trend. In this case, the dominant trend is bearish.
- Eventually, prices will most likely pull back to the $120-to-$115 area.
It is not a good time to trade gold. Wait until it pulls back to the $120 area.
The iShares Silver Trust (SLV)
Here is a recent chart for SLV:
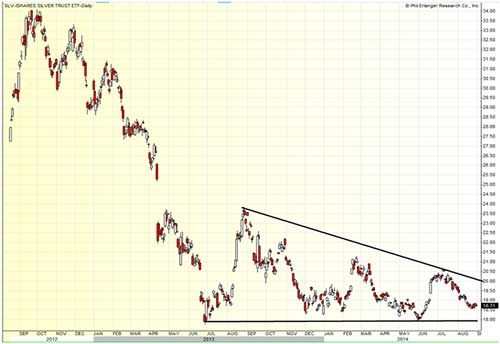
Silver has a bearish descending triangle on its chart, and participants are selling the rallies.
Normally, prices will breach support around the $18 area at some point.
It is best to avoid this type of price action.
Market Vectors Gold Miners ETF (GDX)
Here is a current chart for GDX:
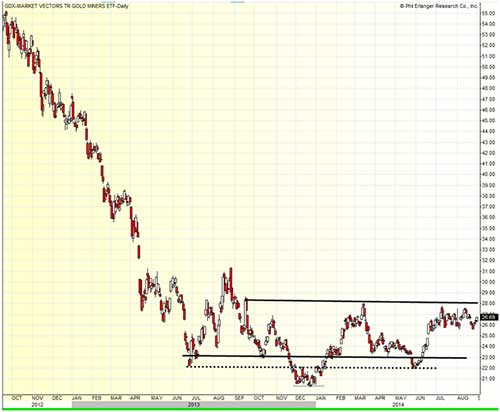
Let’s review the chart:
- GDX has also been basing for over a year.
- Resistance is the $28 area. Support is from $21 to $23.
- It is interesting that prices have not pulled back since the last rally to resistance. This could mean participants don’t want to get out. There is a chance that prices could break above resistance.
However …
If gold continues to trade in a range and pulls back to support, will gold take the GDX and other gold miners down with it?
I recommended GDX back in March when prices were closer to support and the risk/reward relationship was better, about 1.5 to 5.
As of right now, however: When in doubt, stay out.
I recommend waiting until prices pull back closer to support before buying GLD, SLV and GDX. This will give you a better risk/reward potential. And if you’d like to receive timely alerts from me when it’s time to buy the metals and/or the miners, complete with detailed trade instructions, you can click this link here >>
Good Gold and Energy Investing,
Dan Hassey

….either they break down to new lows soon or a major new uptrend is about to start. Which is it? – while we cannot be 100% sure either way, we can certainly attempt to figure which way they are likely to break.
Click on the chart below for a very throrough analysis with 7 compelling charts like the one below only larger – Money Talks Editor

…click HERE for the whole potent analysis

-
I know Mike is a very solid investor and respect his opinions very much. So if he says pay attention to this or that - I will.
~ Dale G.
-
I've started managing my own investments so view Michael's site as a one-stop shop from which to get information and perspectives.
~ Dave E.
-
Michael offers easy reading, honest, common sense information that anyone can use in a practical manner.
~ der_al.
-
A sane voice in a scrambled investment world.
~ Ed R.
Inside Edge Pro Contributors

Greg Weldon

Josef Schachter

Tyler Bollhorn

Ryan Irvine

Paul Beattie

Martin Straith

Patrick Ceresna

Mark Leibovit

James Thorne

Victor Adair