
Gold & Precious Metals
Why could September be fateful for the precious metals complex? First, consider its history within the current secular bull market. The years 2005, 2007, 2009 and 2010 have seen very important breakouts in either or both Gold and gold stocks in the month of September. Conversely, September marked important peaks in 2008 as well as in each of the past three years! Currently, Gold and more so the gold miners are consolidating their recent gains just below very important resistance. This consolidation figures to end before the end of September which means September will produce another important inflection point.
Last week we noted that Gold has started to show strength against the stock market, commodities and notably foreign currencies. Bears expected Gold to decline below $1280 due to the rally in the greenback. Instead, Gold stabilized in part because of foreign buying. The following chart plots Gold and then Gold priced against the major currencies. The 200-day moving average is shown. Every plot is trading above its 200-day moving average.

Take a careful look at these charts and you will notice how the character of the market has changed. These charts show the April 2013 crash followed by a decline to a new low. That final low was retested at the tail end of 2013. In every chart Gold had a strong rally to start 2014 and after a correction has worked its way back above its 200-day moving average which is no longer sloping down. The action of the past month has been critical. Gold kept its higher low intact and remained above its 200-day moving average.
The action in the stocks should prove more telling as they have led this bottoming process and remained well above their 200-day moving averages. We plot our Top 40 index with GDXJ in the chart below. Both indices remain entrenched in a consolidation. After Thursday’s decline the bias over the coming days could be down.

There is also an obvious change of character in the trading of the miners. First, compare the recent peak to the previous peaks (March 2014 and August 2013). At both peaks GDXJ shed 20% within 10 trading days. GDXJ and the top 40 have consolidated for over one month yet haven’t declined more than 10%. In addition, the 200-day moving averages, which were sloping down and resistance in 2013 are now sloping up slightly and figure to provide support if need be.
As I indicated last week, we are positioned for a breakout. My only concern has been the weakness in Gold. However, it held $1280 and is showing increasing relative strength against currencies, equities and commodities. Meanwhile, the miners have remained in a tight consolidation for weeks. They are digesting huge gains in a bullish fashion. If this breakout occurs in September then it truly will be Old Turkey time. Then the key for us speculators and investors will be company selection much more so than trading. We invite you to learn more about our premium service in which we highlight the best junior companies and trade and invest a real portfolio for subscribers benefit.
Good Luck!
Jordan Roy-Byrne, CMT
About Jordan Roy-Byrne, CMT
Jordan Roy-Byrne, CMT is the editor and publisher of The Daily Gold.

One cannot ignore the terrific relative strength in Palladium trading in the 870s and back to its 2011 peak, especially when Platinum, Gold and Silver are well off their 2001 peaks. Supply shortages due to a South African miners strike and strong demand in the auto industry have certainly been catalysts for recent strength. Technical reads project Palladium into the 900s, but I can’t help but feel the 1050 peak from 2000 may very well be challenged. Participation comes via PALL, SWC and very speculative PAL.


ABOUT MARK LEIBOVIT
Mark Leibovit is Chief Market Strategist and Publisher for the Leibovit VR Gold Letter and the author of ‘The Trader’s Book of Volume’ which was published in 2011 by McGraw-Hill. You may have recognized Mark as one of the ten “Elves” on Louis Rukeyser’s Wall Street Week television program where he served as a weekly consultant for 7 years and also as a regular Market Monitor guest for the past 30 years on PBS’ The Nightly Business Report. He is a popular speaker at investment conferences both in the U.S. and Canada and is often seen on PBS, BNN and FOX Business News. TIMER DIGEST Magazine has named him the #1 Gold Timer for the twelve-month period from 8/26/10 to 8/26/11 and the #2 for 2011 He was also named the #1 Intermediate Market Timer for the 10-year period ending in 2007. Mr. Leibovit was a member of the Chicago Board Options Exchange where he became a market maker in several stocks including Newmont Mining. Through the late 1980s he was Technical Research Director for Rodman & Renshaw and subsequently began publishing several financial newsletters. He holds a CIMA and AIF designation and is a member of the Market Technicians Association (MTA) and the CFA Institute.
Our charts are based on data compiled at the market close prior to publication. If you have questions on our current stops or targets, please don’t hesitate to drop us an email at mark.vrtrader@gmail.com. If overall market action necessitates a bulletin, we will send it out as necessary, but I would encourage you to subscribe to the VRtrader Platinum service which often sends out multiple bulletins each day. Please go to www.vrtrader.com for more information. If you would like access the Leibovit Volume Reversal signals daily, subscribe to my ‘Add-on’ Leibovit VR Tool Kit from Metastock (a stock market charting service) or eSignal. Here is an introduction to the eSignal platform with the VR ‘Add-on’ now available: http://youtu.be/ZsmykOx9DT0.
Please note that daily, weekly and monthly charts can show different technical patterns. Sometimes the formation of Positive Leibovit Volume Reversals occurs in the weekly charts and not in the daily charts. Just look for the red ‘VRs’ which represent sellers and the blue ‘VRs’ which represent buyers. The blue line in our metal charts represents the 200 day moving average and the green line represents the 50 day moving average. Keep in mind moving averages are only points of reference, but their existence becomes a self-fulfilling (almost like magnets) among traders.
A surprise 90 per cent slump in the silver inventory of the Shanghai Futures Exchange, where physical metal rather than paper is traded, has silver bulls talking today.
The emptying of the vaults accelerated in the past two weeks with 23 million tonnes taken in the week ending July 25th and another 21 million tonnes in the last week of August, according to the website SRSrocco Report.
Shanghai surprise
Since March last year the silver held by the Shanghai Futures Exchange has crashed from 1.4 billion tonnes to just 148 million:
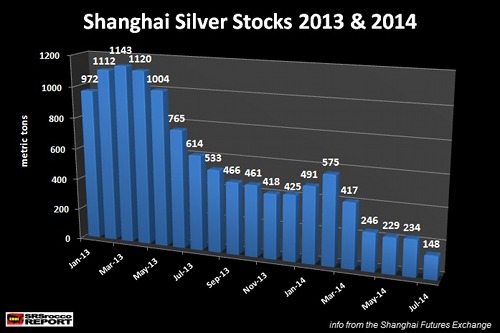
Experts cited in this report note that the trading volume of the Shanghai Futures Exchange and Shanghai Gold Exchange are nearly three times higher than the volume at the Comex in Chicago, and claim ‘investors are beginning to realize the Comex is nothing but a paper rigged market so they are moving to Exchanges where one can actually acquire physical delivery.’
Not rocket science
But you don’t need to be a hedge fund rocket scientist to see the supply and demand issue emerging in the Shanghai market. Commodity shortages are the very stuff of price inflation.
At first sight it is odd that silver prices have not risen further so far this year with this kind of supply dynamic. But with prices there is often an element of pulling and pulling a brick on an elastic band until it snaps.
Spot yet another reason to be bullish about silver this autumn to add to our previous list (click here).
Related:
Bo Polny’s $2,000 gold and $49 silver forecast for 2014 still on track
Bo Polny is famous among precious metal analysts for correctly calling the tops of 2011 and the bottom for both metals in 2013….read more HERE
– Gold versus the S&P 500 from 2000-2014: Why we still recommend dollar-cost averaging ounces (Marc Faber seems to be doing as much)…
– Then, Dr. Faber and Dr. Ron Paul lend over 80 years of gold market experience to explain why you shouldn’t worry about gold’s low price or its weak response to QE the past two years…
– Then, Dr. Faber goes on to explain why the risk in the U.S. stock market far outweighs the potential reward, even if the S&P 500 soars by 30%…
“But… but…” we hear you stammering.
What about raising rates? Won’t the price of gold fall if the Fed starts to tighten monetary policy?
And what of money printing and geopolitical risk? Both have escalated, yet gold’s barely reacted. What gives?
OK, OK. One at a time… starting with rising rates.
If the Fed raises rates (and that’s a big “if”), it doesn’t necessarily spell lower gold prices. Look at this chart, courtesy of our friends at DailyWealth this morning. Based on 40 years of data they showed that, over history, gold gained 20% a year before rates rise:

As for the correlation between gold prices and the Fed’s quantitative easing the last three years… here’s how our former employer Ron Paul put it last week in a CNBC interview:
“If you understand the subjective theory of value, you don’t get too concerned about that, because, yes, increasing the money supply weakens the dollar, and a weaker dollar raises the price of gold and it’s a long-term measurement. But you can’t measure it by saying, ‘The money supply went up a certain amount, so gold’s going to go up a certain amount.’
“There’s a subjective element… But long term, economic law says that if you keep printing a lot of paper money, the value of that dollar or currency will go down, and things, most prices, will go up. And indeed, gold always goes up… But I don’t get into the business of saying in a year or two or three, it’s going to be $2,000 or $3,000 or $4,000.“
Perspective is everything, explained Dr. Paul leveraging at least 4½ decades of experience in the gold market. “I remember watching gold when it was $35 an ounce, and we thought that if it ever hit $100, the world would come to an end.” Heh. Imagine what he would’ve thought in 1970 if he heard today’s price of $1,285, let alone that it peaked in 2011 at $1,921. Or that the Fed’s balance sheet stands at $4.5 trillion…
“As long as we continue to do this,” Dr. Paul concluded, “[gold] could go to infinity, because if people just leave the dollar, who knows what…”
Then, as Dr. Faber explains in today’s featured essay, “the only ‘cash’ that would still have the quality of being a ‘store of value’ would be precious metals.” In today’s episode, Dr. Faber arrives at that conclusion via an explanation of why risk outweighs reward in the U.S. stock market.
We strongly encourage you to read on for his full analysis “U.S. Stocks’ Risks Outweigh Their Future Return” below…
Further Reading: Dr. Faber himself is still accumulating gold at the current price of $1,285. If you’d like to do the same, we highly recommend you first read The Quickest, Easiest Way to Store Your Wealth Overseas by our founder, Addison Wiggin, on the DR’s website. It will show you our preferred method for buying and storing gold. It takes just five minutes to read.
U.S. Stocks’ Risks Outweigh Their Future Return
by Dr. Marc Faber
In the late 1990s, just ahead of the bursting of the NASDAQ bubble, I reproduced, courtesy of the late Peter Bernstein (author of Against the Gods), a table showing how many quarters of previous capital appreciation were given back in the 12 largest US bear markets since 1929.
In the meantime, we have had another three bear markets and I have updated his table to reflect the new data. (Bernstein used Dow Jones data, and I used S&P 500 data for the period since 1998.)

As can be seen in the table , on average, bear markets gave back 21 quarters, or a little more than five years, of previous capital gains, while the worst bear market (1929-1932) gave back over 15 years of previous gains.
The second-worst bear market was the slump ending in March 2009, which gave back 12 years (48 quarters) of previous gains. I have now calculated by how many years of previous capital gains, and by how much the market would decline from the current level, were it to lose the same number of “quarters of price appreciation lost” as in each of the previous bear markets. In other words, and to make it simple:
Assuming the S&P 500 were to peak out now and lose the smallest number of previous “quarters of price appreciation lost” (four quarters in the bear market ending in 1998), it would drop to the level in the third quarter of 2013 (down 20%).
Conversely, if the S&P index dropped from the current level by the average of quarters of price appreciation lost over the last 85 years (a little more than five years — or, to be precise, by 21 quarters), it would decline to the level it stood at in the second quarter of 2009. (In such a case, the index would drop by 52%.)
But this is not so relevant, since everyone seems to be convinced that the US stock market will keep on rising. Therefore, let us also be bullish and assume that the S&P 500 will soar by 30% to 2,570 within a year and then retreat by 21 quarters of previous price gains (the average number of quarters of price appreciation lost since the bear market of 1929-1932).
In this case, the S&P 500 would drop following its high, from 2,570 in the second quarter of 2015 to the second quarter of 2010, or to less than 1,200, a loss of 38% from the current level of 1967 for the S&P 500, and of more than 50% from the 2015 high at 2,570. However, not to worry.
When the world is mad, we need to be a little mad as well. So, let us all become academics and live in a glass palace in LaLa Land and let us be just as optimistic as Mrs. Yellen and adhere like the Fed to George Orwell’s principle that “political speech and writing are largely the defense of the indefensible…. Thus political language consists largely of euphemism.”
And since we all also want to make the world a better place, we should assume that the S&P 500 will double from its current level to almost 4,000 over the next five years. If the S&P 500 were subsequently to decline by 21 quarters of previous price gains, we would be precisely a little lower than today’s level. (Remember, the 21 quarters would be the average of quarters of price appreciation lost over the last 85 years.)
I further need to point out that the stock market has become rather selective and that numerous “popular” stocks are already down meaningfully from their 12-month highs. My friend Christopher Hayes has compiled a table showing some of the carnage that has already occurred.

So, whichever way I slice it, I believe that the risks of buying US stocks outweigh the potential of future returns. While it is correct that stocks may move higher, that doesn’t imply that they are attractive.
Moreover, propelling stocks to around 4,000 for the S&P 500 would not require “a high degree of monetary policy accommodation” (Yellen), but rather a huge increase in the rate of asset purchases. Under this scenario, it is likely that the US dollar would collapse (as well as the US dollar bond market), creating a global systemic crisis from which the price of precious metals would benefit.
I say this because a sharply declining dollar would force other central bankers around the world also to print massive amounts of money in order for their economies to stay competitive. Consequently, the only “cash” that would still have the quality of being a “store of value” would be precious metals.
Regards,
Marc Faber
for The Daily Reckoning
[Ed. note: In the past six months alone, many little-known mining plays have taken off — 53% on NovaGold (NG), 53% this year and 85% on Fortuna Silver (FVI:TSX), for example. The field was analyzed by the likes of Rick Rule, Doug Casey and our own Byron King at this years’ Sprott Vancouver Natural Resource Symposium. We just put the conference MP3s online if you’re interested in listening to them. Click here for access.]

 Silver use in three fast-growing technologies could grow 275% over the next four years, according to new research. Produced for the Washington-based Silver Institute of international miners, refiners, wholesalers and manufacturers, the 22-page report notes that these newer uses of silver “might at first glance seem modest” compared to industry’s total 15,000-tonne demand for silver per year…..continue reading HERE

-
I know Mike is a very solid investor and respect his opinions very much. So if he says pay attention to this or that - I will.
~ Dale G.
-
I've started managing my own investments so view Michael's site as a one-stop shop from which to get information and perspectives.
~ Dave E.
-
Michael offers easy reading, honest, common sense information that anyone can use in a practical manner.
~ der_al.
-
A sane voice in a scrambled investment world.
~ Ed R.
Inside Edge Pro Contributors

Greg Weldon

Josef Schachter

Tyler Bollhorn

Ryan Irvine

Paul Beattie

Martin Straith

Patrick Ceresna

Mark Leibovit

James Thorne

Victor Adair