Gold & Precious Metals

Gold Is Unstoppable With Stocks Leading the Way

Downward manipulation of gold and silver is real, declares Jason Hamlin, but the longer it continues, the higher prices will go when the free market reasserts itself. In this interview with The Gold Report, the publisher of the Gold Stock Bull newsletter argues that rising geopolitical anxiety coupled with endless monetary expansion could lead to explosive growth in precious metals and equities. He also lists his favorite royalty/streaming companies and gold and silver miners.

COMPANIES MENTIONEDFRANCO-NEVADA CORP. :GOLDCORP INC. : LAKE SHORE GOLD : PINECREST RESOURCES LTD. : ROYAL GOLD INC. : SANDSTORM GOLD LTD. : SILVERCREST MINES


The Gold Report: You told The Gold Report in December 2012, “I think the official inflation adjusted [gold] high of $2,400 per ounce ($2,400/oz) will be taken out within the next 12 months.” Why didn’t this happen?

Jason Hamlin: One reason is that inflation hasn’t risen significantly until lately. That is due to the recent record low velocity of money. Trillions of dollars in new money were created to stimulate the economy and get us out of the financial crisis of 2008–2009, but the banks have held this money in excess reserves, earning interest from the Federal Reserve. As a result, it hasn’t been loaned out and hasn’t flowed through the economy. I think we are beginning to see this change, and coupled with de-dollarization driven by Russia and China, I expect the inflation rate to increase at a quicker pace than most people expect.

The other reason why the price of gold didn’t increase was outright manipulation. Before people roll their eyes at seeing this “conspiracy theory” once again, we should point out that Britain’s Financial Conduct Authority actually fined Barclays Bank £26 million (£26M) in May for manipulating the daily gold fix between 2004 and 2013. In my estimation, this is just the tip of the iceberg. A number of class-action lawsuits have recently been filed against the big banks for gold manipulation and one needs only look objectively at the recurring not-for-profit selling to understand that manipulation is taking place. When you consider the immense power that printing the world reserve currency gives a nation, the motive to continue this system and suppress alternative currencies becomes clear. We could never have the endless wars and continual deficit spending without Nixon delinking the dollar from gold.

TGR: What do you make of the report by the <href=”#axzz38yvtopxn” target=”_blank”>Financial Times that central banks have invested $29.1 trillion in markets, mostly equity markets?

JH: This is another example of “conspiracy theory” becoming “conspiracy fact.” It helps explain why there’s been such a divergence between equity prices and the true health of the economy. This also supports theories of a plunge-protection team working to prop up the market and keep confidence high. The greater the interventions and the farther we drift from free market price discovery, the more extreme the boom and bust cycles will be and the more devastating the impact on everyday investors. This grand experiment ends very badly, in my estimation.

TGR: The financial media pays great attention to the Dow Jones Industrial Average and the S&P 500, but are these really such good indices of the broad health of the U.S. economy?

JH: Not at all. You can look at the weak manufacturing numbers. You can look at stagnant wages or at median household net worth, which plunged 36% from 2003 to 2013. You can look at the labor force participation rate, which hasn’t recovered at all from 2008. There are so many divergences from the official story of a full recovery and we are now finally starting to see some cracks in the facade.

TGR: We had stock market crashes in 2000 and 2008. Are we due for another?

JH: The warning signs have been flashing for quite some time, but stocks have continued marching higher. Valuations on a price/earnings basis have risen to lofty and unwarranted levels. By any number of measures, we are due for a major correction in the stock market. It’s just a matter of when, not if. In the meantime, I haven’t been shorting the market. I think it’s wise to continue to ride the trend higher. We’ve been doing that with some technology and agricultural plays because, if the markets are manipulated, this bubble can last much longer than most people would think. But it is important to mind your stops.

TGR: Given how high the Dow Jones and S&P 500 numbers have become, what would be the psychological and political effects of another crash?

JH: Devastating. That’s why we have so much manipulation behind the scenes. On the political front, it would gravely damage the current administration. On the psychological front, investors would suffer a grave loss of confidence in the market. And, very rapidly, these effects could spin out of control. Some of the financial conditions that led to the last crisis in 2008–2009, such as leveraged indebtedness and derivatives exposure by banks, are far worse today than in 2008.

TGR: Some people willing to admit manipulation of gold and silver prices ultimately conclude, “So what?” What do you make of that response?

JH: It makes sense in one respect. Essentially, holding down gold prices through manipulation allows investors to accumulate gold at lower prices. Manipulation is similar to holding down a spring. The countervailing force continues to grow stronger as the artificial forces weaken, and when the spring is finally released, it moves with explosive force.

Precious metals manipulation frustrates short-term investors and speculators because the price action doesn’t match the fundamentals or technicals. If you have a long-term investment horizon, however, as we do, you can live with it because it gives you more time to accumulate at lower prices.

TGR: Why haven’t events such as the war between Hamas and Israel, the downing of a civilian airliner over Ukraine and the ISIS takeover of much of Syria and Iraq led to a flight to safety in gold?

JH: There is always an initial kneejerk reaction toward liquidity, i.e., the U.S. dollar. However, the world is starting to move away from the dollar as its reserve currency. We see bilateral trade agreements inked by a growing number of nations and a $400 billion natural gas deal just signed by Russia and China that bypasses the dollar. As this “de-dollarization” continues, I believe investors will increasingly reject all fiat currencies, and precious metals will reassert themselves as the safe-haven asset in times of financial crisis.

TGR: You have decried the demonization of Vladimir Putin by Western leaders. What’s your opinion of U.S. sanctions against Russia?

JH: They are really foolish. We are needlessly antagonizing nuclear powers—not only Russia but China as well. As scary as it sounds, the long-term goal is probably to drag Russia into some type of protracted conflict that will weaken its economy and give the U.S. an excuse to initiate force against Russia. Putin is seemingly aware of this plan and has avoided the trap. He has provided some support for the rebels in Eastern Ukraine, but Russia’s involvement in that region has been quite restrained since the new Ukrainian government came to power.

I believe that these maneuvers by America to isolate Russia economically will eventually backfire.

TGR: Will the European Union (EU) back President Obama’s campaign against Russia?

JH: It is my understanding that many EU nations, Germany in particular, do not share America’s antagonism against Russia. Yes, sanctions can harm Russia, but the EU is already on a shaky economic footing, and so its members are worried about a boomerang effect. To harm ties with Russia, a huge trading partner, simply to please the U.S. for political reasons doesn’t seem to make a lot of sense.

TGR: Why do you believe the price of gold could rise to $10,000/oz or higher?

JH: An increase in the supply of fiat money. The faster the money supply increases, the higher the gold price targets can be. As outlandish as it may seem, we must consider as models what happened in Zimbabwe, Argentina and other countries that have suffered currency crises. And what happened was a rapid devaluation of each currency and tremendous price rises in stable assets, such as precious metals.

More important than the gold price in fiat dollars, however, is how gold performs in preserving wealth and increasing purchasing power. On that front, gold has an unblemished success rate throughout history in times of crisis. Gold price targets of $10,000/oz and above reflect the belief that the U.S. dollar losing world-reserve status could lead to a panicked move out of dollars and dollar-denominated assets.

TGR: A gold price of $10,000/oz or even $5,000/oz would be great news for gold holders, obviously, but wouldn’t it be terrible news for everyone else? Wouldn’t socioeconomic conditions be dreadful?

JH: I tend to agree. Unfortunately, that’s the trajectory we’re on. So we hope for the best but prepare for the worst. I may not like the economic conditions that would accompany $3,000/oz, $5,000/oz or $10,000/oz gold, but I would at least know that my hard work and the wealth it generated would not be stolen by the Fed-induced forces of inflation. Gold is basically an insurance policy, but it also has the added benefit of significant capital appreciation over the past decade. People like to criticize gold for not paying a dividend or generating income, but the price has more than tripled in the past decade, even counting the recent correction. By comparison, the Dow Jones is up around 65% in the past 10 years. Which investment would you choose?

I would hope there is still some way to avoid the economic crash that I see coming. On the other hand, however, this crash is in some ways essential. It’s needed to clear out the excess and mal-investment from the markets and begin again with a system that’s more sustainable. I just hope we learn lessons from the past and find ways to avoid the same type of mistakes and crony capitalism that has taken over the current system.

TGR: What’s the best way for investors to hold gold and silver?

JH: I recommend holding physical metals in your possession first and foremost, but I believe it’s good to diversify geographically, so as to not have all your assets in one place. Physical bullion should be supplemented with investments in mining stocks. This is one of the only remaining sectors where I see value, and quality mining stocks will offer significant leverage to the coming advance in gold and silver prices. So far this year, we are seeing mining stocks generating returns of three to four times that of gold and silver bullion, which is a bullish indicator.

TGR: The gold–silver price ratio continues to hover around the recent historical number of 1:65. Do you anticipate this ratio changing and, if so, in which direction?

JH: Supply and demand fundamentals are now more attractive for silver than gold. It’s my expectation that the gold–silver ratio will fall toward its longer historical number of 1:30. Only under extreme short-term crisis conditions might we see gold outperform silver, because gold is viewed more as a monetary and investment metal than silver, where 50% of demand comes from industrial uses.

TGR: Franklin Delano Roosevelt banned private gold ownership in the United States. Could future Western governments move to contain an economic crisis with similar measures?

JH: Anything is possible, but I don’t expect it. Gold investors are wise to the possibility of confiscation, and the decentralization of information that has occurred over the Internet over the past 20 years makes it less likely. I doubt that gold investors would simply hand it over en masse now, as they did in 1933.

In addition, I know plenty of investors who buy their precious metals without a paper trail, cash and carry There’s no way for the government to know who owns these metals, let alone confiscate them.

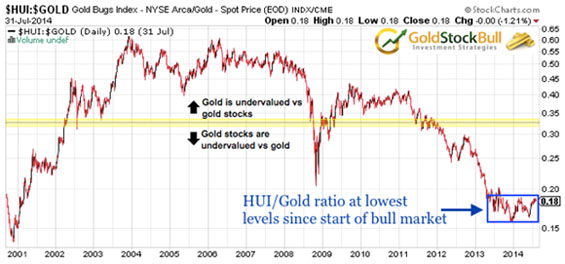
TGR: You wrote recently that “gold mining stocks remain severely oversold.” Do you expect this to continue?

JH: It continued longer than I had expected, but we’re already seeing signs of a bottom process. As I mentioned, mining stocks have outperformed the metals by three to four times in 2014, which is an encouraging trend.

I use the NYSE Arca Gold BUGS Index (HUI)-to-gold ratio to track this. It fell all the way to 0.16 and has since had a bit of a bounce back, but the upside potential remains absolutely huge. I think that as gold moves back toward previous highs, we’re going to see a major revaluation higher for mining stocks. Already, we’re seeing hedge funds and big-money traditional investors moving into precious metals equities for the first time ever because most other asset classes are so overvalued.

Hamlinchart1

TGR: Which type of mining stock do you like best?

JH: I have a particular affinity for the royalty and streaming sector. Its business model is superior to strictly mining. These companies offer the same upside potential as their mining-company partners—new discoveries, increased production, etc.—but royalty companies have mitigated downside risk because they have fixed costs as per their streaming contracts and aren’t exposed to the cost overruns that are commonplace in the mining industry.

TGR: Which streaming company is your favorite?

JH: Sandstorm Gold Ltd. (SSL:TSX; SAND:NYSE.MKT). Its market cap is about $800M, and so it has tremendous growth prospects over the next four or five years. I am a big fan of its CEO, Nolan Watson, who was previously CFO of Silver Wheaton Corp. (SLW:TSX; SLW:NYSE). Although Sandstorm has recently experienced some hiccups, I rate Watson’s business acumen very highly and believe the company will bounce back strongly during the next advance in gold.

TGR: What do think of Sandstorm’s strategic alliance with Pinecrest Resources Ltd. (PCR:TSX.V)?

JH: Sandstorm bought 18% of outstanding Pinecrest shares. As a result, it gets a share of Pinecrest’s Enchi gold project. This contains an Inferred resource base of 1 million ounces (1 Moz) gold, is open for expansion in all directions and is located in a mining-friendly jurisdiction, Ghana. In addition to buying equity, Sandstorm also gets the right of first refusal on any future streaming deals, which I expect it to pursue aggressively.

In addition, Watson hinted that Sandstorm could for the first time buy entire companies. With the junior sector beaten down and undervalued, having someone like Watson turning companies around could reap huge rewards for Sandstorm and for investors as gold climbs back to $1,800–1,900/oz. Sandstorm has over $100M, zero debt and $100M in an undrawn line of credit. I expect several exciting announcements between now and the end of the year.

TGR: Could you comment on some of the other royalty companies?

JH: Franco-Nevada Corp. (FNV:TSX; FNV:NYSE) is a more conservative play that I also like. It is better diversified than Sandstorm and has more exposure to platinum and palladium. It’s a good stock to have in your portfolio, but investors willing to take on additional risk for greater reward might prefer Royal Gold Inc. (RGLD:NASDAQ; RGL:TSX).

TGR: What do you like about Royal?

JH: Sandstorm is up 65% year-to-date. Royal Gold is up 70%, making it one of the few stocks in the precious metals sector outperforming Sandstorm. Royal benefits from the commercial production begun at the Mt. Milligan mine in British Columbia owned by Thompson Creek Metals Co. Inc. (TCM:TSX; TC:NYSE), one of its streaming partners. During Q1/14 Royal generated income of $20M on revenues of $58M. That’s more than triple the income from the same quarter last year despite gold falling around 20%. As production continues to ramp up at Mt. Milligan, we should see even greater Royal share appreciation in 2014.

I also like Royal’s project pipeline. The company’s most recent news is a 6.3% stream on Rubicon Minerals Corp.’s (RBY:NYSE.MKT; RMX:TSX) Phoenix gold project in Red Lake, Ontario. Royal got this for a $75M investment to finance construction. This is a late-stage project, with production expected in mid-2015 and returns for years to come. Royal Gold is a top performer this year, and I expect more of the same to come.

TGR: The Gold Report interviewed Pierre Lassonde, co-founder of Franco-Nevada, in May, and he arguedthat because “the silver space is smaller than the gold space,” Silver Wheaton will eventually “run out of runway” and will be forced to compete in the gold space. Do you agree?

JH: I do. And perhaps in additional commodities as well. There is only so much growth Silver Wheaton can achieve strictly in silver, so it makes sense that it branches out into other commodities in search of deals that will be accretive to shareholders.

TGR: What’s your favorite non-streaming gold company?

JH: Lake Shore Gold Corp. (LSG:TSX). I like companies that are high grade and low cost with a strong growth profile. Lake Shore has two mines in commercial production in Ontario: Timmins West and Bell Creek. Expansion of its mill to a capacity of 3,000 tons (3 Kt) per day was completed late last year. Gold production is expected to increase 27% in 2014, and Q2/14 production was a record 53,300 oz, up 70% year-to-year. Lake Shore is one of the best production growth stories, is located in a mining-friendly jurisdiction and has a strong management team. As such, I think it is a potential takeover target for a company like Goldcorp Inc. (G:TSX; GG:NYSE), so investors could see upside there.

TGR: What’s your favorite non-streaming silver company?

JH: SilverCrest Mines Inc. (SVL:TSX; SVLC:NYSE.MKT) in Mexico. This is a high-grade epithermal silver producer with low costs. In today’s environment, the value of these attributes cannot be stressed enough. The company is in the middle of the expansion plan that is expected to increase production by roughly 50% this year. It has a base-case internal rate of return of 88% on its Santa Elena expansion in Sonora. I also like its La Joya property in Durango as a pipeline; it has nearly 200 Moz silver equivalent (Ag eq).

Second quarter production of 412,000 oz Ag eq was down versus a year ago and versus Q1/14, leading to a dip in the share price. This is because Santa Elena began an early transition in Q2/14 from an open-pit, heap-leach operation to a 3 Kt per day underground and mill operation. I think this provides an excellent opportunity for investors to buy on the dip because Santa Elena has huge potential, and I believe SilverCrest will be one of the top-performing silver miners for the next couple of years.

TGR: You mentioned several stocks with huge increases in 2014. Where are we in the cycle? Is the much anticipated bull market finally here?

JH: We’re seeing signs that this current advance is different than the breakout attempts that have failed in the past year. Again, I look for mining stocks to outperform the metals. That’s usually a sign of strength behind the advance. We’ve seen about 3.5 times leverage on the Market Vectors Gold Miners ETF (GDX) versus gold itself. I also like to see silver outperforming gold, and we have seen this, by roughly 50% in 2014.

When prices have been beaten down this year, investors have stepped in to buy the dips, so they have rebounded pretty rapidly. I think there are stronger hands holding gold this time around. The current prolonged correction and consolidation over the last two to three years has shaken out a lot of speculators. Those that are left tend to be committed investors that believe in the fundamentals and have long-term horizons. Short-term price drops don’t discourage them and don’t lead to panic selling, which would occur with a higher percentage of bandwagon speculators.

All of this is very encouraging, and when you also consider rising geopolitical tensions, the U.S. dollar losing ground as world reserve currency and the other fundamental factors we’ve mentioned, this tells me that the advance has legs and will likely continue throughout the rest of 2014 and into 2015.

TGR: Presumably, many investors sold in May and went away. What happens in September when they return?

JH: Precious metals are entering their strongest seasonal period of the year, and this is another factor that should lend support in the coming months. As investors return, I expect them to seek value within sectors that haven’t reached historically high valuations. I expect a rush into precious metals and precious metals equities, particularly from new investors. And given the relatively small size of the precious metal sector, this could have a huge impact on prices in a relatively short time.

Hamlinchart2

TGR: Jason, thank you for your time and your insights.

Jason Hamlin is the founder of Gold Stock Bull, the highly rated investment newsletter focused on strategies for profiting on bull markets in gold, silver, energy, rare earth metals and agriculture. Well versed in fundamental and technical analysis, he has consulted to Fortune 500 companies globally and speaks regularly at North American investment conferences.

Want to read more Gold Report interviews like this? Sign up for our free e-newsletter, and you’ll learn when new articles have been published. To see recent interviews with industry analysts and commentators, visit our Streetwise Interviews page.

Related Articles


DISCLOSURE: 
1) Kevin Michael Grace conducted this interview for Streetwise Reports LLC, publisher of The Gold Report, The Energy Report, The Life Sciences Report and The Mining Report, and provides services to Streetwise Reports as an independent contractor. He owns, or his family owns, shares of the following companies mentioned in this interview: None. 
2) The following companies mentioned in the interview are sponsors of Streetwise Reports: SilverCrest Mines Inc. Franco-Nevada Corp. and Goldcorp Inc. are not affiliated with Streetwise Reports. Streetwise Reports does not accept stock in exchange for its services.
3) Jason Hamlin: I own, or my family owns, shares of the following companies mentioned in this interview: Franco-Nevada Corp., Lake Shore Gold Corp., Royal Gold Inc., Sandstorm Gold Ltd. and SilverCrest Mines Inc. I personally am, or my family is, paid by the following companies mentioned in this interview: None. My company has a financial relationship with the following companies mentioned in this interview: None. I was not paid by Streetwise Reports for participating in this interview. Comments and opinions expressed are my own comments and opinions. I had the opportunity to review the interview for accuracy as of the date of the interview and am responsible for the content of the interview. 
4) Interviews are edited for clarity. Streetwise Reports does not make editorial comments or change experts’ statements without their consent. 
5) The interview does not constitute investment advice. Each reader is encouraged to consult with his or her individual financial professional and any action a reader takes as a result of information presented here is his or her own responsibility. By opening this page, each reader accepts and agrees to Streetwise Reports’ terms of use and full legal disclaimer.
6) From time to time, Streetwise Reports LLC and its directors, officers, employees or members of their families, as well as persons interviewed for articles and interviews on the site, may have a long or short position in securities mentioned. Directors, officers, employees or members of their families are prohibited from making purchases and/or sales of those securities in the open market or otherwise during the up-to-four-week interval from the time of the interview until after it publishes.


Silver’s Significant Underperformance and Its Implications

Gold & Silver Trading Alert, plus USD & Mining Stocks Commentaries

Briefly: In our opinion no speculative positions in gold, silver and mining stocks are now justified from the risk/reward perspective.

Yesterday’s price action in the precious metals market was very specific. Gold declined very little, silver declined much more, and mining stocks moved a bit higher. When we see a mirror image of such action (gold pauses, silver rallies and miners decline a bit), it’s usually a sign of a top. Have we just seen a local bottom? Let’s take a look at the charts (charts courtesy of http://stockcharts.com), starting with silver.

34747 a

In short, the self-similar pattern remains in place. At this time the pattern is proportionately bigger, but remains similar in terms of shape. Big declines in the precious metals sector have been very often preceded by silver’s short-term outperformance, even if this outperformance was preceded by a visible downswing in the price of the white metal. What we saw in February and March serves as a perfect example.

Why has silver underperformed recently? As always, there is no clear explanation behind any price move (other than because someone pushed the “sell” button), but it seems to us that it can be in a large part attributed to the sharp decline in the general stock market.

If we are just seeing the beginning of another huge decline, then we are still quite likely to see a sharp rally in silver, just before the big drop. In other words, what we have written about the silver market previously remains up-to-date:

The current situation is similar to what we saw in March. Silver declined after a local top was formed close to the turning point, then bounced a bit and then it moved a bit below the previous low. Back in March it rallied for a few days only to disappoint and plunge shortly thereafter. This scenario seems quite probable at this time, not only because of the similarity on the above SLV ETF chart but also because of the situation in the currency markets.

Click Chart for larger version

34747 b large

Turning to the yellow metal, we see no new low. Gold has basically remained where it closed on Monday, which is a sign of strength, given that the USD Index moved a bit above its previous high. Overall, what we wrote yesterday remains up-to-date:

The trend is down for both the short and medium term, but since gold has not declined as much as it “should” based on the dollar’s rally, it still seems likely that a correction is just around the corner.

34747 d

Mining stocks remain above the declining support line, which means that the situation in this part of the precious metals sector hasn’t changed much. Actually, the situation improved a little, because miners could have declined based on Friday’s big intra-day reversal – and they didn’t. With this negative factor out of the way, we are left with the support line as a bullish factor.

All in all, the situation is unclear for mining stocks – but with a bullish bias.

34747 c

As mentioned previously, the USD Index moved higher once again, but it seems that the index will at least take a breather soon. The dollar is right after its cyclical turning point, which makes a pullback likely even without the overbought status, and the USD Index is definitely overbought in the short term (note the reading on the RSI indicator in the upper part of the chart).

Moreover, individual USD-related currency pairs are reaching their respective support and resistance levels, thus suggesting that a turnaround or a pause is becoming more and more likely, even if it is not seen in a day or two.

Taking all the above into account, we can summarize the current outlook in the same way as we did yesterday.

Summing up, it seems that even though the next big move in the precious metals sector is still likely to be to the downside (we have not yet seen actions that are usually seen at important bottoms, like huge underperformance of silver [what we saw this week was not huge enough], and gold is not actively hated in the mass media), the odds for a corrective rally are relatively high. We plan to re-enter short positions when we see either a small rally an some kind of confirmation that the next local top is in (more likely scenario in our view) or a confirmation that there will be no visible correction (for example a continuation of the dollar’s rally despite the current turning point). At this time, we prefer to say out of the market.

To summarize:

Trading capital (our opinion): No positions
Long-term capital (our opinion): No positions
Insurance capital (our opinion): Full position

Thank you.


You will find details on our thoughts on gold portfolio structuring in the Key Insights section on our website.

As always, we’ll keep our subscribers updated should our views on the market change. We will continue to send them our Gold & Silver Trading Alerts on each trading day and we will send additional ones whenever appropriate. If you’d like to receive them, please subscribe today.


“The New Gold Era: Sublime Confidence”

gsimagesAfter today’s sudden drop in Silver to $19.78 be sure to take a look at the second chart of “Sweet Spot for Silver” too  – Money Talks Editor

  1. As the month of August gets underway, the gold market has a solid feel to it.
  2. In 2014, analysts who have held extremist price targets (both bullish and bearish), have found themselves looking like fish out of water.
  3. Gold has not skyrocketed on the supposed “massive physical shortages” envisioned by the super-bulls. Nor has it crashed and burned, as the super-bears promised it would, on US rate hike fears or QE tapering.
  4. Western gold community investors are probably now in an era where the extreme emotions of fear and greed should be replaced by what I call sublime confidence.
  5. New OTC derivatives are traded on clearing houses, rather than at mega-banks behind closed doors. This has added tremendous stability to the financial system.
  6. The likelihood of a “Lehman 2.0” situation has greatly diminished, although it has not disappeared completely.
  7. The solid ongoing transition of China in 2014, from an exports-oriented economy to a domestic consumer economy, adds depth and stability to gold jewellery demand there.
  8. In India, economic growth had slumped to under 5%, and the economy was overrun by the mafia. The May elections appear to be a game changer for growth and the reduction of government debt/corruption.
  9. ‘”Our government is pursuing pro-development policies. I am sure these policies being pursued by the government will take up India’s GDP growth to 8.5 per cent in the next couple of years,” the Union Minister for Shipping, Road Transport and Highways, told reporters here.’ –The Economic Times, Mumbai, India, August 3, 2014.
  10. Whether it’s a particularly overbought oscillator on the daily gold chart, or a rise in commercial trader short positions on the COMEX, I think there’s little for Western gold community investors to fear.
  11. For example, click here now. That’s a snapshot of the most recent COT report for gold. Nervous gold stock investors will note the large net short position currently held by commercial traders.
  12. While they did cover off some of these positions in the latest reporting period, they are still net short at least 160,000 contracts.
  13. Please click here now.   That’s a snapshot of the COT report from late July in 2009. The commercial traders were net short many more contracts than their current position.
  14. Please click here now. Look closely at the two green circles that I’ve highlighted on this chart. There is great symmetry between the actions of the commercial traders in July-August 2009 and their actions today.
  15. In the summer of 2009, traders built a huge net short gold position of more than 200,000 contracts, as price surged up from the right shoulder low, of what I call one of the greatest inverse head and shoulders bull confirmation patterns, in the history of markets.
  16. I would argue that there’s a strong chance that gold is poised to create a much bigger pattern of the same type now, driven by a relentless rise in global demand for gold jewellery. The commercial trader selling here is really very modest, and it’s certainly nothing to be afraid of.
  17. What about rate hikes? Isn’t gold’s price “all in the dollar”? Well, gold’s price is all in the dollar, but it’s becoming more driven by the action of the dollar against the rupee and the yuan, rather than just the euro.
  18. On that note, please click here now. Today’s report, courtesy of Econoday, shows that India’s central bank left rates unchanged at this morning’s key policy meeting. Most Indian economists feel that central banker Raghuram Rajan will slowly lower rates, in a multi-year process that begins in 2015, while his counterpart (Janet Yellen) in American begins to raise US rates.
  19. This process, could create huge institutional money flows into Indian stock markets and private equity, increasing the likelihood of the government hitting its 8.5% growth target.
  20. At the same time as Indian growth surges (and hence citizen wealth to buy more gold surges), I’m predicting that US inflation begins to tick noticeably higher, while the US business cycle peaks.
  21. Do the charts support these fundamental arguments that gold is “solid as a rock”, at this point in time? For the probable answer, please click here now. That’s the eight hour bars chart for gold. I suggested that gold could easily trade in the $1280 – $1290 area, as Friday’s US jobs report approached. It traded there, and that decline added aesthetic symmetry to the inverse head and shoulders bottom pattern in play.
  22. The right shoulder itself takes the form of a green bullish wedge, which I’ve highlighted on the chart. My suggestion has been for investors to place light buys in the $1285 – $1270 area, using my “PGEN” (pyramid generator) to systematically allocate capital. For details on the PGEN and systematic capital allocation, investors can send an Email tostewart@gracelandupdates.com. Thanks.
  23. Please click here now. That’s the CRB index monthly chart. It flashed an impressive 5,15 moving average crossover buy signal in early 2014, and rallied to the 313 area. This moving average series has very few false signals. There’s also a clear upside breakout from a key down trend line. The CRB index has retraced about half of the rally. There’s no point in wasting time trying to decide exactly where it might turn higher. What’s important is to understand the possibility that deflation likely ended in 2013, and reflation is now beginning. The overall picture on this chart adds another layer of technical concrete to the concept of a solid floor for gold being in place now. A floor is not a “bottom that occurs just before blastoff!” event. It’s a general price zone of enormous support, where downside price volatility should not be feared.
  24. Please click here now. This key weekly chart shows the price action of gold versus GDX (gold stocks). The large head and shoulders top pattern suggests that gold stocks are on the cusp of a significant period of outperformance against gold. A rally that does not exceed the right shoulder highs of 57.55 could be used by investors to buy gold stock, in anticipation of that period of outperformance!

Special Offer For Website Readers: Please send me an Email tofreereports4@gracelandupdates.com and I’ll send you my free “Platinum Demand Rocket Time?” report. Key platinum markets may be set to show increases in demand of 15% – 40% in 2015. That could turn this mighty metal into “gold on steroids”. I’ll show you in detail what the fundamentals are, how I’m managing risk, and seeking reward, in this great asset!

       Thanks!  

       Cheers

       St    

Stewart Thomson

Graceland Updates

Note: We are privacy oriented. We accept cheques. And credit cards thru PayPal only on our website. For your protection. We don’t see your credit card information. Only PayPal does. They pay us. Minus their fee. PayPal is a highly reputable company. Owned by Ebay. With about 160 million accounts worldwide.

Written between 4am-7am. 5-6 issues per week. Emailed at aprox 9am daily.

www.gracelandupdates.com  

www.gracelandjuniors.com

www.gutrader.com  

Email: stewart@gracelandupdates.com

Or: stewart@gutrader.com

Rate Sheet (us funds):

Lifetime: $799

2yr: $269 (over 500 issues)

1yr: $169   (over 250 issues)

6 mths: $99 (over 125 issues)

To pay by cheque, make cheque payable to “Stewart Thomson”

Mail to:

Stewart Thomson / 1276 Lakeview Drive / Oakville, Ontario L6H 2M8 Canada

Stewart Thomson is a retired Merrill Lynch broker. Stewart writes the Graceland Updates daily between 4am-7am. They are sent out around 8am-9am. The newsletter is attractively priced and the format is a unique numbered point form. Giving clarity of each point and saving valuable reading time.

Risks, Disclaimers, Legal

Stewart Thomson is no longer an investment advisor. The information provided by Stewart and Graceland Updates is for general information purposes only. Before taking any action on any investment, it is imperative that you consult with multiple properly licensed, experienced and qualifed investment advisors and get numerous opinions before taking any action. Your minimum risk on any investment in the world is: 100% loss of all your money. You may be taking or preparing to take leveraged positions in investments and not know it, exposing yourself to unlimited risks. This is highly concerning if you are an investor in any derivatives products. There is an approx $700 trillion OTC Derivatives Iceberg with a tiny portion written off officially. The bottom line:  

Are You Prepared?

“Three countries to emerge from Iraq as we know it now!”

In the last few weeks the story of Iraq has faded from the headlines to be replaced by the story on the Ukraine, Gaza and on the business front the tumble of the Dow on the New York Stock Exchange.

(This article is a re-issue of an article produced for the Gold Forecaster newsletter recently.)

But right now in the world we are watching many structural changes taking place quietly but completely. One is the shift of wealth and power to the east, the rise of the Yuan and its use in a growing number of global transactions in the place of the U.S. dollar. At the moment Russia is turning its economic head towards China and the developed world doing its best to do so too. And still the east is gaining ground and its share of global cash flow has doubled from 20% to 40% since the beginning of the century. This is set to continue strongly.

These developments are sending warning signals to us not just that the developed world’s share is waning, but the grip on the world’s currencies by the U.S. dollar has to weaken over time. Not only is the threat to the dollar’s hegemony growing from the Yuan, but key to that role, its dominance over the oil price, is in danger.

Of comfort to the U.S. is its rapid rise to oil self-sufficiency, shrinking the threat from the future oil market to the dollar oil price. But this is extremely critical to the U.S. because it has to retain dollar hegemony primarily because it runs a constant Trade deficit. If it is required to pay for goods in currencies other than the dollar it is in trouble. The dollar’s role as the sole global reserve currency will happen, but of more importance will be the loss of its power over global financial markets. As it is the U.S. dollar has lost its power over China. With $4 trillion in its reserves and its growing ability to trade in the Yuan and not the dollar it seems secure from any U.S. action to curb its financial power in the world. The only recourse the U.S. has over China will be over that $4 trillion and we wonder if its actions to prevent BNP Parisbas using the U.S. dollar could possibly be considered by the U.S. under some circumstances?

Apart from that, the U.S. considers the Middle East oil supplies as part of its ‘vital interests’ in terms of its global power and the power of the dollar. Ask yourself, if most nations were able to pay O.P.E.C. in any currency, what importance would the U.S. dollar hold. Its critical use would be limited to trade with the U.S. The liquidity of the U.S. dollar market does prevent the easy use of ‘softer’ currencies but the liquidity of the euro, sterling, the Swiss Franc and then Yen, together with the arrival of the Yuan on the global scene would provide sufficient liquidity in place of the dollar. Then where would all those excess dollars go and what would be their value?

So it is in this context that the importance of the situation in Iraq now becomes of disproportionate importance to the monetary world.

In trying to extrapolate what will happen there we have to look at the Middle East with eyes that are neither geographical nor political. We have to look at the religious battles going on there and see where they are going to see what will happen to the oil price and in what currency it will be traded.

As a glimpse of the importance of these issues, the seizure of an oil tanker sent to the U.S. for the sale of oil by the Kurds of Iraq, by the U.S. last week has caught our attention.

The changing Iraq

With the declaration of a new country straddling the borders of Syria in the west and Iraq in the east, the scene is set for the full disintegration of Iraq into three countries along sectarian lines. We now look at what countries lie ahead in the region;

Each of the borders to these countries will be embroiled in war against each other. The sectarian issues have overwhelmed any political issues, which are being swamped in the process.

Even the U.S. has lost its influence with the exception of supplying arms to the government it instituted before it left. This government’s history of corruption and prejudice against Sunnis is where the war will become centered.

Kurdistan

We see the most northerly ‘country’ being Kurdistan [in cream on the, map], unlikely to want to give up its autonomy rapidly becoming sovereignty and so consolidating its hold on the oilfields of Kirkuk

8-4gf

The Islamic State

The second ‘country’ is the new ‘caliphate’ under the Sunnis [in light brown on the map], again, because of bitter experience of its treatment under an integrated government in Bagdad, unlikely to want to merge into a future integrated government even if moderate

Sunnis win out over ISIS [most unlikely].

The Shia State of Iraq

The third ‘country’ will be in the south [in the darker green] under the Shi’ites, in command of the bulk of the nation’s oil [3m barrels per day] and export terminal at Basra.

While we see this as the outcome, the cost to the country is likely to be extraordinarily high as the polarization of the two sides of Islam, which will, no doubt, come, will leave the rest of Iraq facing religious ‘cleansing’ because of the many remaining mixed areas of the country, including Baghdad [in light green on the map], where blood baths have and will surely ensue as different groups tried to establish their dominance in these ‘undefined’ areas, as you can see on the map here and chase those not of their religion out of those areas.

Iranian involvement

With Iran, their historic enemy, now lining up drones and other military supplies to help the government of Prime Minister Nuri Kamal al-Maliki retake the north and protect the south, many Sunnis are becoming become further alienated from the state. But we do not see the current ‘support’ of the American instituted government in Bagdad, by Iran, as being committed to that government, but certainly committed to the Shi’ites in the country. This is not about secular government, or simple geography, it is about religion and oil.

The rapid invasion of Iraq by the Islamic State in Iraq and Syria, which supplied the shock troops of the assault on Mosul, has made vigorous efforts to inculcate a new identity for those living within its growing transnational sphere, setting up Shariah courts and publicizing videos in which its fighters burn their passports. Recently, the group issued an eight-page report denouncing the Middle Eastern border system as a colonialist imposition, and included photographs of its fighters destroying what it called “crusader partitions” between Iraq and Syria.

Across the border in Syria, a Kurdish region in the country’s north is also effectively independent of Damascus, with its own military and provisional government. And Turkey, which in the past strongly opposed an independent Kurdish state on its border, now sees the Kurds as a stable buffer between itself and the extremists of ISIS.

In Iraq, it has long been assumed that the Shi’ite heartland of southern Iraq, where the major oil fields are, would give the Shi’ites a tremendous advantage, leaving the Sunnis with only the vast landlocked deserts to the north and west. But northern Iraq also controls both of the country’s major rivers, the Tigris and Euphrates, which flow southward toward Basra.

The prospect of a more formal partition in Iraq or Syria would also lead to mass migrations and further turmoil, judging by some recent examples of state partition, like the division of Sudan in 2011, or that of India and Pakistan in 1947. Those breakups were the result of long struggles and led to terrible violence.

Prospects for gold and oil

While exports from the terminal at Basra are trying hard to make up for lost exports in the north and the oil price has only hit $115, should the conflict see ISIS try to attack the south-west of Iraq and Bagdad, we do see speculators pushing oil prices up to $140.

We also see Iran taking far more aggressive actions by sending in troops overtly or covertly [which they are doing now] to secure the Shia ‘country’. If the current government collapses [looking very likely right now], we see Iran’s moves to protect the Shi’ites as certainly including controlling Basra.

They would, we feel try to pacify the U.S. and the oil world by maintaining the current production levels. A failure to work with Iran, no matter the political compromise involved, would see oil prices move up over $140 to the detriment of every economy on this globe!

But would Iran be paid in dollars? Or as we see Iran, currently under the control of the U.S. vis-a-vis its oil exports [until the nuclear issue is resolved], having these controls lifted.

Already it supplies China and will have the option of doing so with Iraqi oil too. With the punishment of BNP Parisbas in mind, we would expect Iran to be happy to receive Yuan [Renimbi] in payment of its oil. This would weaken dollar hegemony and blaze a trail for other nations to move away from the dollar [as it is now more overtly political]. This will directly impact the global monetary system and dollar hegemony.

As to gold, three factors emerge:

1)    The forecasts of the WGC OMFIF report come onto center stage.

2)    The actions of the Iraqi government in buying 90 tonnes of gold can now be seen in context as its currency begins to lose all credibility, as ISIS robs the banks it invades taking the management of that currency to untenable levels.

3)    With the Middle East responsible for 20% of the world’s physical gold demand last year, we expect their demand to jump not simply at retail levels but at central bank levels. Whenever war comes into the picture, one of the first casualties is the local currency. The Ukraine is a recent example of this. Even though the country is not at full scale war levels, their currency has fallen 45% this year already.


Hold your gold in such a way that governments and banks can’t seize it!

Silver: Bounce Likely, Intermediate Term Top, Long Term Explosive Upside

Silver Market Update 

by Clive Maund

We called the exact top in silver to the day in the last update 3 weeks ago, as it has since reacted back. Although a brief relief rally now looks likely, the still extreme COT readings suggest that silver has just put in an intermediate top. On its 6-month chart we can see how it has reacted back from the peak to arrive at an area of support at its principal moving averages, with its earlier overbought condition having completely unwound. This set of circumstances makes a bounce likely. However the COT structure has barely eased in recent weeks, which means that any rally here is likely to be short-lived and followed by renewed decline. (Originally published August 3rd, 2014)


34723 a

The 1-year chart for gold is shown below for the purposes of comparing it to the COT chart immediately below it…

34723 b

Commercial short and Large Spec long positions are still at a very high level, having only eased marginally last week. This is not good news for silver bulls, and suggests that, near-term rally or not, silver is likely to drop back to the $18 area at the supporting trendline of its major uptrend channel shown on its long-term 15-year chart lower down the page, and possibly lower. Bulls will want to see the COTs ease considerably on such a drop.

34723 c

The 4-year chart for silver doesn’t exactly look to hot, although this should be viewed in conjunction with the 15-year lower down the page.

34723 d

Other than the admittedly scary COT chart, the long-term 15-year chart for silver still looks good, as it is now in a zone of strong support above the support of its long-term uptrend line.

34723 e

Related: Gold Market Update