
Gold & Precious Metals
No pain, no gain. That is one comment regarding this seemingly terminal bottoming process in the precious metals complex. Multiple times as soon as conditions have strengthened enough for us to anticipate a breakout, the miners have put in a bearish reversal. At the same time, the metals and especially Gold have failed to gain any real traction. Throughout the past year we’ve been looking for that final low in Gold but it has eluded us multiple times. The recent reversal in the gold and silver miners coupled with a continued technical downtrend in Gold suggests that more pain is coming before sustained gain.
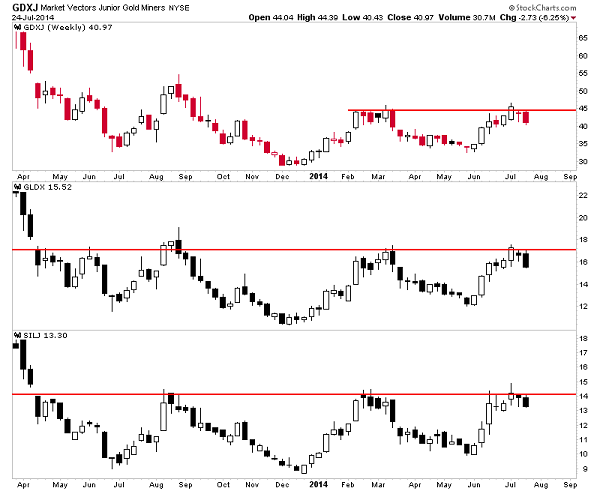
Gold and Silver miners have made some progress over the last year. As evidenced by our top 40 index, the best companies have bottomed with little question. The various indices put in a higher low at the end of May and rebounded with gusto. Daily momentum hit levels not seen since 2012. Meanwhile, the miners have outperformed the metals and closed the recent quarter at the highs. That did not happen in past quarters. However, the miners failed to break resistance and are now reversing their course yet again. We plot GDXJ (large juniors), GLDX (explorers) and SILJ (silver juniors). Note how they’ve reversed a near breakout two weeks ago.
The message of the miners, as we posited last week is that Gold’s final bottom is ahead rather than behind. Had the miners blasted through resistance then it would have indicated a final bottom for Gold was in place. This view is also confirmed by the action in Gold itself. Gold peaked at $1346 and thus failed to come close to its March high at $1392. Last week Gold formed a bearish reversal and engulfed the previous three weeks of trading. A lower high and strong weekly reversal in Gold is a warning that more downside potential lies ahead.
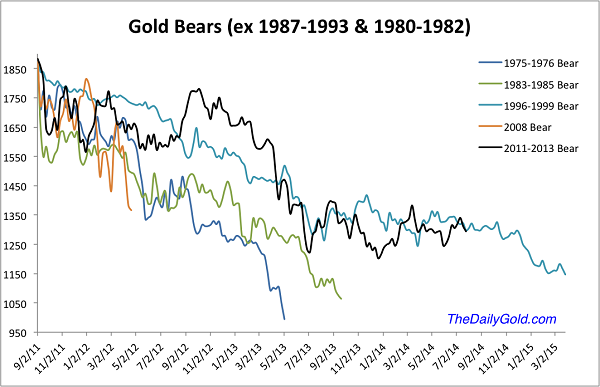
The Gold bears analog chart below (which excludes the most extreme bears in price (1980-1982) and time (1987-1993) shows that the trajectory of the current bear is similar to that of the 1996-1999 bear. In other words, this current bear is in line with history. The most severe bears in price tend to be the shortest while the most severe bears in time tend to be the smallest in price. The current bear is somewhat more severe in time than price.
The key support levels to watch in Gold on a weekly basis are $1250 and $1200. A close below $1250 would bring about a test of $1200 while a break below $1200 could usher in that final capitulation that has eluded us.
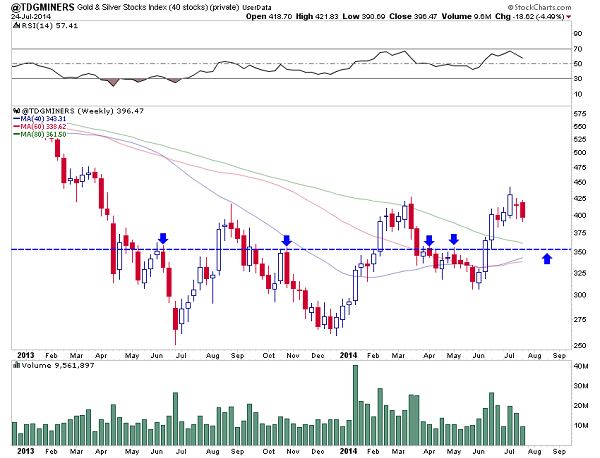
With regard to the miners (GDX, GDXJ, etc), keep an eye on the 200-day moving averages as well as the May lows. GDXJ would have to decline 10% to test its 200-day moving average and 20% to fall below its May low. Last week we noted 370 as support for our top 40 index seen below. The weekly chart shows long-term moving averages coalescing near a key pivot point of 353. That is about 11% downside.
This has been a difficult and confusing last year due to the disparity between the leading gold and silver stocks and the metals themselves. More hints of a bottom have come with each successive advance yet Gold in particular has not obliged. Our top 40 index shows that the worst was over for most quality companies a year ago. The index is up roughly 60% from that point and has endured two big corrections while making higher highs and higher lows. Select companies have vastly outperformed the metals.
However, we must give the Gold bears credit. They’ve been on the right track with respect to the metal. The risk has flipped again as Gold has likely started its final decline. This figures to pull the mining stocks down one last time before their fledgling bull market begins in earnest. The stocks that hold up the best during the selloff could be primed for leadership in the fall. We invite you to learn more about our premium service in which we highlight the best junior companies and trade and invest a real portfolio for subscribers benefit.
Good Luck!
Jordan Roy-Byrne, CMT

Gold’s strong season is just getting underway, with this metal’s summer-doldrums seasonal low in place. The past couple months’ stiff headwinds are starting to shift to fierce tailwinds, thanks to Asian demand ramping up heading into autumn. Gold’s pronounced seasonality is very important for all investors and speculators to understand, as today’s inflection point is a very bullish omen for this still-unloved asset.
Gold seasonality is somewhat counterintuitive, with its mined supply essentially constant year-round. Once a company spends over a decade and many hundreds of millions of dollars to develop a gold deposit into an operating mine, its future production profile is essentially fixed. The gold supply is not like that of the soft commodities, where harvest floods the markets with a massive onslaught of new supplies.
But supply is only half the price equation, demand is equally important. And rather fascinatingly, global gold demand varies dramatically as each calendar year marches forward. There are specific times of the year where demand explodes and other times where it withers. Gold’s ironclad demand-driven seasonality is the product of well-understood income-cycle and cultural phenomena from all around the world.
And today we happen to be right at the great ebb of this perpetual seasonal cycle, the end of July. The summer is gold’s weakest season of the year, because there are no major recurring demand surges. But starting now, that changes dramatically. In the coming weeks Asians will once again start flooding into gold in droves, forcing its price higher. So buying today ahead of that near gold’s seasonal lows is very prudent.
Soon gold will start powering higher in its initial strong-season rally straddling late summer and early autumn. As gold rises, so will the entire precious-metals complex. The gold tracking ETFs, led by the mighty American GLD gold ETF, will mirror gold’s advance. And silver and the stocks of the precious-metals miners will leverage and amplify it. The dawn of gold’s strong season is always an exciting time.
So this week I decided to celebrate 2014’s major seasonal low by furthering my long-running studies on gold’s seasonality. This critical knowledge will greatly help if you invest in or speculate in anything precious-metals related. The methodology is simple and easy to understand. Every calendar year of gold’s secular bull since 2001 is individually indexed, and then each year’s indexes are averaged.
The results charted reveal gold’s seasonal tendencies over any calendar year. Limiting this study to gold’s secular bull is important because prices behave very differently in secular bulls and bears. And it is essential to index each year individually before averaging them to ensure percentage comparability. With gold averaging $311 in 2002 and $1409 in 2013, its raw unindexed prices just aren’t equivalent.
Every calendar year’s gold prices are indexed off the final trading day’s closeof the previous year, which is set to 100. If gold is up 10% at any time during a year, its index will read 110. These indexed percentage moves are always perfectly comparable regardless of gold’s absolute price level. Every year’s since 2001 individual index is then averaged together, yielding this unique and indispensable gold-bull seasonality chart.

Gold has enjoyed a very strong seasonal uptrend since its secular bull was born in 2001. On average over that span, gold ended each year an amazing 13.4% higher! It’s just flabbergasting that gold is still so unloved by investors with such an awesome track record. That trounces the universally-adored S&P 500 stock index, which has gained a pitiful 1.9% annually at bestover essentially the same secular timeframe.
The problem is traders’ short-term memories dangerously cloud their long-term perspectives. All anyone remembers is 2013, the most anomalous market year seen in our lifetimes after 2008’s stock panic. The Fed’s reckless jawboning and massive bond monetizations catapulted the S&P 500 29.6% higher. And that sucked vast amounts of capital out of alternative investments including gold, which plummeted by 27.9%.
But investing is about riding long-term trends, not betting crazy anomalies will magically last forever. And gold’s secular-bull seasonals reinforce how incredibly profitable it has been. Thanks to recurring gold demand surges that flare up around the world at various times of the calendar year, gold has enjoyed four major annual seasonal rallies on average. And since we’re in late summer today, that’s a great place to start.
Gold’s weak season runs from late May to late July, the time of the year devoid of regular surges in gold demand. I’ve long called these the summer doldrums. Gold tends to drift sideways to lower on balance in June and July, spawning a dark sentiment wasteland where everyone either forgets about gold entirely or starts to loathe it. Sound familiar? While gold bottoms seasonally in early July, it still languishes until late July.
And then like Rip Van Winkle, gold awakens from its nightmarish slumber. The initial catalyst is actually agricultural harvest season! All of Asia is in the northern hemisphere, sharing the same growing season we do. After an entire year of hard work and heavy capital investment, Asian farmers start to harvest the fruits of their long labors. They sell their crops and finally learn how much surplus income they earned.
Some of this is deployed into physical gold, driving up demand consistently in August and September. This is particularly true in rural India, where there isn’t much of a banking system and a deep centuries-old cultural affinity for gold abides. This post-harvest gold buying may sound quaint, but actually we do something very similar in America. Our income-cycle investing happens in late December and January.
Like Asian farmers, we don’t know how much surplus income our entire year of work generated until the end of the year. Finally after bonuses are awarded and tax burdens are figured, we can invest any surplus we earned. Thus the American stock markets tend to see major capital inflows in early January. Investing can only come from surplus income beyond living expenses, no matter where in the world one lives.
This Asian post-harvest buying pushes gold higher in August and early September. And as it starts petering out, Indian’s famous wedding seasonramps up. If you know any Indians, ask them about this fascinating cultural phenomenon. Indian weddings are huge and elaborate productions that collectively demand a staggering amount of gold to pull off. This buying accelerates gold’s strongest seasonal rally of the year.
Marriage is so important in India that most are arranged by families. The timing of these weddings is critical, as Indians fervently believe that getting married during the autumn festival season increases couples’ odds for success, longevity, happiness, and good luck together. Who wouldn’t want such great blessings in their marriage? The autumn festivals including Diwali are the most auspicious times to tie the knot.
Indian families pay fortunes to outfit their brides with extensive gold dowries, most in the form of intricate and beautiful 22-karat jewelry. Not only can the bride wear this gold on the most important day of her life, its value secures her financial independence within her husband’s family. Like American parents, Indian parents spare no expense when marrying off their precious children. They buy vast amounts of gold.
Something like 40% of India’s entire massive annual gold demand occurs during this autumn wedding season! This helps drive gold’s biggest seasonal rally of the year, which averages 6.9% gains between early July and early October. With such an important and one-off event as a child’s wedding, Indian parents buy gold aggressively regardless of price or artificial barriers like the current crazy-high import duties.
Gold takes a seasonal breather in early October, but then its price shoots higher again in November. Why? We start our own festival season here in the West, the holidays of Thanksgiving and Christmas. That period is dominated by a crazy spending frenzy. Many Americans do the great majority of their entire year’s discretionary spending leading into Christmas, and that includes heavy gold jewelry buying.
Jewelry demand explodes as holiday dollars deluge into golden gifts for wives, girlfriends, daughters, and mothers. Apparently many American jewelers do well over half their entire year’s sales between just before Thanksgiving and Christmas! This Western festival season makes us happy too, just like Indians during their own festival season. And happy people are far more likely to freely spend money on discretionary wants.
This Western holiday buying leads to another 5.0% gold surge on average between late October and early December. That drives gold’s decisive seasonal breakout above its seasonal uptrend. Much like July, that October seasonal ebb is a great time to buy gold, silver, and the stocks of their miners. Gold tends to slump a bit in December, but soon awakens for another major 5.2% surge into late February.
The strong early-year gold buying starts in the West, and is income-cycle driven just like the Asian farmers’ buying. That’s when we figure out how much surplus income we’ve earned and invest some of it in the financial markets. Even with gold still out of favor, there were still enough smart contrarian investors over the course of its secular bull to propel this metal sharply higher on average in January.
And just as these big Western demand surges subside, the major Chinese festival season arrives. The Chinese calendar is based on the moon as well, and its new year usually arrives in the first couple weeks of February. The Chinese people celebrate this Lunar New Year by buying gold for gifts. While these gifts are small, there are a lot of Chinese which means a lot of aggregate gold demand. Income cycles play a part too.
Like American investors in late December and January, Chinese investors figure out how much surplus income their entire year of work generated in late January and February. So the popular festival buying is augmented with serious investment buying. Once this surge in Chinese gold demand peaks later in February, gold usually starts slumping into late March. But note the chart above shows a mid-April low.
Why? April 2013’s extremely anomalous gold panic was such a wildly-outlying event that it dragged down the entire secular bull’s averages a bit compared to my last seasonal read in late 2011. And the subsequent extreme selling in 2013 significantly reduced gold’s average spring rally to merely a 3.0% gain. I certainly suspect this will mean revert higher as normal gold-buying patterns resume in the coming years.
Unlike the rest of the strong season between late July and late May, gold’s spring rally has no clear income-cycle or cultural driver. I suspect it is the result of the same psychology that leads to general-stock buying in the spring. After a dark, cold winter, the longer daylight hours and warmer temperatures of spring leave people happier. And traders who feel better are much more likely to deploy capital.
Gold’s strong season is powerful and well worth riding for any investor or speculator. All-in between early July and late May, gold has averaged a stellar annual seasonal gain of 15.4% in its entire secular bull between 2001 and today! That is one monster of a seasonal rally. If gold merely enjoys an average one between its recent mid-July low of $1294 and May, we are looking at $1493 gold by next spring!
And since last year was such an extremely anomalous down year that largely short-circuited gold’s usual seasonal tendencies, probabilities greatly favorthe opposite this year. We are likely to see far more upside than usual as gold continues to mean revert out of 2013’s extreme lows. And once again the ETFs like GLD will mirror gold’s gains, but silver and the precious-metals miners’ stocks will amplify them.
This next chart uses the same indexing and averaging methodology but carves up gold’s secular-bull price action into calendar months instead of years. Each calendar month is individually indexed off the final close of the preceding month set at 100, and then they are averaged. This perspective gives a clearer view on how gold tends to perform in any given calendar month. And the best of the year are approaching.

August, which is almost upon us, is actually gold’s second strongest month of the year on average with a 2.7% gain. Then September is the third strongest, with a slightly lower (before rounding) 2.7% gain too. And then after October’s seasonal slump, November is actually gold’s strongest month of the calendar year at +3.3% on average. Now is a great time to buy precious metals with gold’s best months of the year nearing!
July is the best time of the year bar none to add new precious-metals long positions, with the whole string of major seasonal rallies still ahead. Late October, late December, and mid-April are secondary buying points to add positions, but with much less seasonal rallying left after these points they aren’t as optimal as late summer. Right now is the year’s most favorable time to deploy serious capital in precious metals.
As always, it’s very important to remember that seasonals are tendenciesbased on long-term averages. They are secondary drivers, affecting prices like headwinds and tailwinds affect airplanes. Gold can certainly still move counter to seasonal tendencies for a spell if that’s the way its primary drivers happen to be pushing. Sentiment, technicals, and fundamentals can all easily offset and outweigh seasonals.
So don’t get discouraged or scoff at seasonals if gold moves the wrong way for a week or two during a seasonally-strong time. That happens, as even strong tailwinds can be bucked with sufficient power. But over time, these seasonal tendencies are very strong and will normalize. Recurring major gold buying worldwide is the underlying source of seasonals, which is the mostfundamental force possible.
In addition to the usual income-cycle and cultural gold buying, the coming months are likely to see additional very bullish big fundamental buying come into play. 2013’s extreme gold anomaly was driven by just two groups of traders dumping gold at epic record rates, American stock traders and American futures speculators. And so far this year even before gold’s strong season they’ve actually been buying gold instead.
GLD’s gold-bullion holdings are actually rock-solid this year after plummeting last year. As of this week, they were up 0.9% year-to-date. That may not sound like much, but it is a vast improvement from the extreme 31.2% year-to-date plunge as of the same day in 2013! As the overvalued andoverextended US stock markets inevitably roll over, stock traders are going to remember the wisdom of portfolio diversification.
They will flood back into GLD shares faster than gold is rallying, forcing this ETF’s custodian to shunt that deluge of excess capital directly into gold-bullion buying. This will combine with the Asian buying to force gold up faster. And that will accelerate the massive buying in gold futures that has been underway this year. American futures speculators still have lots of buying left to do to mean revert to normal years’ levels.
So when the fundamentally-driven tailwinds of the strong autumn seasonals combine with heavy buying of the GLD gold ETF by American stock traders and gold futures by American futures speculators, we are likely looking at one exceptional autumn gold rally! It won’t be smooth, it won’t climb in a nice straight line, and there will be sharp setbacks. But on balance gold is perfectly poised for a major new upleg.
We’re ready at Zeal. We started adding new precious-metals-stock trades this week for the first time since April, on top of our existing ones that have unrealized gains as high as +119% this week. We expect to continue this new deployment over the coming weeks as we position for this year’s gold strong season. The best of the smaller gold and silver miners’ stocks could easily double or triple from here by next spring.
The stocks we’re buying come off our popular comprehensive reports detailing the ones our research has shown have the best fundamental prospects. Buy your reports today and get deployed while this sector remains out of favor! We have also long published acclaimed weekly and monthly contrarian newsletters. In them I draw on our decades of hard-won experience, knowledge, wisdom, and ongoing research to explain what’s going on in the markets, why, and how to trade them. Since 2001, all 686 newsletter stock trades have averaged stellar annualized realized gains of +22.6%! Subscribe today!
The bottom line is gold’s strong season is just getting underway. While gold’s mined supply is constant, its global demand fluctuates dramatically throughout the calendar year. Major income-cycle and cultural drivers from around the world lead to outsized gold demand surges. And gold’s best months of the year are nearing as Asian harvest buying ramps up followed by the fabled Indian wedding season’s arrival.
The usual autumn gold seasonal strength this year coincides with extremely toppy global stock markets due to roll over any day. And when they do, investors will flock back into neglected gold for prudent portfolio diversification. This Western mean-reversion buying after last year’s extreme gold anomaly stacked on top of Asian seasonal buying ought to spawn one monster gold upleg. Get deployed ahead of it.
Adam Hamilton, CPA
July 25, 2014
So how can you profit from this information? We publish an acclaimed monthly newsletter, Zeal Intelligence, that details exactly what we are doing in terms of actual stock and options trading based on all the lessons we have learned in our market research. Please consider joining us each month for tactical trading details and more in our premium Zeal Intelligence service at …www.zealllc.com/subscribe.htm
Questions for Adam? I would be more than happy to address them through my private consulting business. Please visit www.zealllc.com/adam.htm for more information.
Thoughts, comments, or flames? Fire away at zelotes@zealllc.com. Due to my staggering and perpetually increasing e-mail load, I regret that I am not able to respond to comments personally. I will read all messages though and really appreciate your feedback!
Copyright 2000 – 2014 Zeal LLC (www.ZealLLC.com)

This infographic, the finale of our five part 2014 Gold Series, covers gold trends that investors should be watching through the rest of the year and beyond.
With input from some of the most important names in gold such as Brent Cook, Doug Casey, Frank Holmes, Bob Moriarty, and James Fraser, we aim to cover the broadest and most important signals for investors to watch. Those include Chinese wealth, Indian demographics, money printing, debt, and a lack of significant gold discoveries.
The 2014 Gold Series is now over – thank you for reading! Don’t forget to connect with Visual Capitalist to receive daily infographics through e-mail or social media. – A great visual that answers a lot of questions – Editor Money Talks

The gold and silver miners have cooled off in recent days after a red-hot start to the summer. Could this cool off be the start of another move lower or a pause before another leg higher? We continue to be bullish and a new reason is the sudden strength in the monthly and even quarterly charts. For larger or developing trends, monthly charts supersede weekly charts, which supersede daily charts. With only two days left, the gold and silver miners are poised to end the month and quarter with their strength intact.
If GDXJ, (shown below) can close June above $41.34 then it will achieve its highest monthly close in 10 months. At the least, GDXJ is set to close at a four month high in monthly terms while engulfing nearly the last three months of trading. Compare that to the monthly advances in July and August of last year and January and February of this year. Those gains were weaker in comparison. Moreover, the strong gains in June are confirmed by the explosion in the volume.

The monthly chart for GDXJ clearly shows long-term support and resistance. The May and June lows (~$33) are support while the next major resistance figures to be $50. In our last missive we mentioned that GDXJ’s next weekly resistance was $44. GDXJ’s June high is $43.52. Recent weakness and consolidation could continue in the short-term. I see support for GDXJ at $39 (and GDX at $24.75). Nevertheless, GDXJ has material upside from here to its next resistance at $50.
GDXJ is a proxy for the junior gold mining sector but I am not a fan for several reasons. It contains too many silver stocks, too many Australian based companies and some companies I would never consider buying. Stockcharts.com now allows subscribers to upload their own data and essentially create their own charts. Below is a daily chart of my top 15 index, which hit a 16-month high last week. Note how the 200-day moving average was resistance in 2013 and is now support. The index could be forming the handle on a small cup and handle pattern that has potentially 27% upside from here. (That upside coincides with GDXJ’s upside to resistance at $50)

There are two takeaways from this article. First, the strength in the monthly (and quarterly charts) should confirm or at least strengthen the argument that the miners are in a new bull market. We have not seen this kind of strength (with volume confirming) to close a month or a quarter since this bottoming process began a year ago. It’s a signal that buyers are more comfortable holding their positions indefinitely.
Second, there continues to be strong upside potential for the sector in the months ahead.
Our top 15 index shows the strongest companies are leading the way for the rest of the sector. Other than monthly resistance at $50, GDXJ has no major resistance until $70. Most of the upside potential remains ahead of us. With the big declines likely behind us, we think it’s wise to take advantage of dips in the short-term as we see potential for roughly 25% upside to Labor Day. We invite you to learn more about our premium service in which we highlight the best junior companies and trade and invest a real portfolio for subscribers benefit.
Good Luck!
Jordan Roy-Byrne, CMT

-
I know Mike is a very solid investor and respect his opinions very much. So if he says pay attention to this or that - I will.
~ Dale G.
-
I've started managing my own investments so view Michael's site as a one-stop shop from which to get information and perspectives.
~ Dave E.
-
Michael offers easy reading, honest, common sense information that anyone can use in a practical manner.
~ der_al.
-
A sane voice in a scrambled investment world.
~ Ed R.
Inside Edge Pro Contributors

Greg Weldon

Josef Schachter

Tyler Bollhorn

Ryan Irvine

Paul Beattie

Martin Straith

Patrick Ceresna

Mark Leibovit

James Thorne

Victor Adair