With gold prices down over $130 from its most recent high in March 2014 and only a little over $60 above the lows of June and December 2013 one has to wonder if there is another major bear drop to come. Gold remains down over $600 from its all-time (nominal) high of $1,911 seen in September 2011. This has played out against the backdrop of the US stock markets making ongoing moves to new all-time (nominal) highs. Gold as a result has become a “bad word” with some predicting that gold has much further to fall even as those committed to the “yellow metal” continue to believe holding gold is the right strategy.
So who is right? Despite the fall in gold’s price since September 2011, the fundamentals have not changed.
(Click on images to enlarge)

Despite the fall in gold’s price since September 2011, the fundamentals have not changed. Despite what many say, gold is not a hedge against inflation or deflation. It could perform well under either scenario. If gold is a hedge it is a hedge against bad government and currency depreciation.
Gold is an alternate currency and is currently the only alternate currency to fiat currencies. It is traded either beside or on the currency desks of major financial institutions. Gold has acted as a safe haven during times of financial stress. In countries that have experienced currency collapses, those who held gold were able to maintain their wealth and purchasing power. They could also have maintained their wealth through the holding of US$ as well. The US$ as the world’s reserve currency is still viewed as safe haven despite being a fiat currency.
Fiat currencies have no value other than what a government says they are worth. At one time, the world’s monetary system was backed by gold. That was scraped in August 1971 under former US President Richard Nixon. Since then money and debt have exploded. Today the world’s leading industrial countries are burdened with debt. Since the financial crisis of 2008, the debt burden has increased sharply for all countries particularly for the G7. The table below outlines various forms of debt to GDP ratio of the G7 countries that represent 63% of the world’s GDP.
-
Public Debt is the total amount of debt owed by government to creditors whether domestic or external.
-
External debt is the total of public debt plus private debt owed to non-residents repayable in internationally acceptable currencies, goods or services. External debt can be lower than total public debt. External debt is considered more important than public debt.
-
All debt is the total of government public debt plus household debt, financial institutions debt and non-financial institutions debt.
-
NA – Not available or not applicable
-
Gold to GDP Ratio is the value of all of the available gold in the world at US$1,260 as percentage of total world GDP. Gold is estimated to make up less that 3% of all financial assets (stocks, bonds).
A public debt to GDP ratio of 100% or higher is a cause for concern. It is estimated that a public debt to GDP ratio above 100% could shave upwards of 1% off GDP. Since the financial crisis of 2008, debt is growing faster than GDP ensuring that the debt to GDP ratio should continue to move higher.
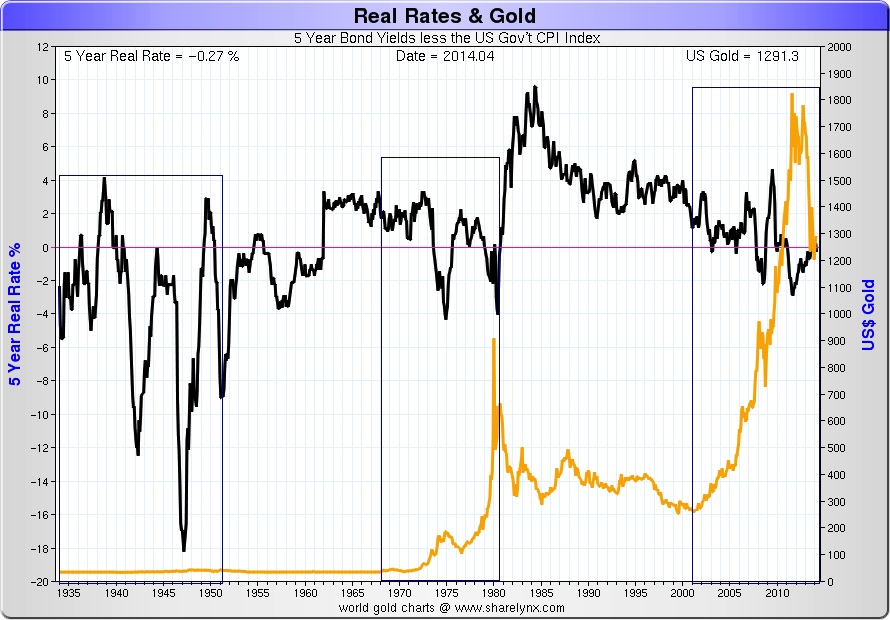
More debt usually means higher interest rates. However, the G7 countries have been using interest rate suppression in order to keep interest rates down. Interest rates in the G7 countries are for the most part below the rate of inflation. Negative interest rates are considered to be positive for gold. The ECB announced that they would be imposing negative interest rates on deposits in order to cajole banks into lending. The Euro fell in response to the move by the ECB. Negative interest rates could lead banks to also impose negative interest rates on their deposits.
World trade has been shrinking or at least slowing. According to the WTO world trade grew at a rate of 5.5% in 2011 but slipped to only 2.5% growth in 2012. World trade has been slowing further since then. This has been causing trade tensions between countries. Trade tensions can lead to competitive currency devaluations as each country seeks to gain an advantage for their exports. Trade wars in the 1930’s exacerbated the Great Depression. There was no WTO back in the 1930’s so it is hoped that with the WTO today it can lead to trade solutions before they become a problem. Global trade tensions are positive for gold because of the risk of currency devaluations.
Because of the cost of the global financial crisis of 2008 to taxpayers, governments are moving from bailouts to bail-ins as a means of bailing out banks in future financial crisis. What this means is that instead of taxpayer funds being at risk instead it will be depositors funds that are at risk. It is not expected to impact depositors who are covered by government deposit insurance. This is another factor that should be positive for gold. However, in order to avoid potential confiscation by governments as was seen in the US in 1933 gold should be held “off the grid” outside the banking system.
There has also been talk of seizing pension funds. No, they do not actually seize the funds. Instead, what happens is that pension funds particularly social security funds are obligated to invest only in government debt. This is currently occurring in Greece where pension funds will accept only Greek government bonds as an investment.
Global geopolitical tensions are rising. There is growing geopolitical tension between the West and Russia over Ukraine and growing geopolitical tension between the West and China over China’s actions in the South China and East China Sea. Numerous countries are facing social unrest and in Europe and even in North America there has been a significant rise in more extremist right wing parties and some left wing parties. It is the most significant rise of extremist parties since the 1930’s. Anti-European Union parties gained a number of seats in recent Euro zone elections. Growing global geopolitical tensions should be positive for gold as a safe haven.
Despite the positive fundamentals for gold, fundamentals that have grown stronger since the financial crisis of 2008, gold has not responded in a positive manner. Gold is down 35% from its 2011 top while the US stock markets are up 66% as measured by the S&P 500 in the same period. During this same period the US government debt has expanded by about 16%, the US monetary base is up 47% while GDP has grown only about 8%. US credit market debt for all participants has expanded roughly 8% while consumer liability debt has expanded 12%.
The stock markets have been driven higher on monetary expansion and low interest rates, which led to outflow of funds from bonds into the stock market. As well numerous companies rather than invest their excess cash reserves in plants and equipment that could result in job growth they have instead embarked on stock buyback programs contributing further to the rise in the stock market. But the rise in the stock market is not reflecting the reality of the economy. Economic growth in the G7 countries has at best been sluggish and at worst in an ongoing recession. The US reported that Q1 GDP contracted 1%. While many quickly blamed it on the weather, the reality is that after five years of quantitative easing (QE) the US economy is contracting not growing. The stock market appears to have started to churn a sign that institutional money is fleeing the stock market and moving back into bonds. While the S&P 500 has moved higher, broader stock market indices such as the Russell 2000 are down on the year.
In April 2013, a number of banks including Goldman Sachs, JP Morgan Chase and Morgan Stanley forecasted that gold was going to fall to $1,000. Over April 12 and 15, 2013 someone offered upwards of 500 tonnes of gold in the futures markets at the open resulting in a panic in the gold market as it fell $200. Gold has not recovered since. The perpetrators of the sell-off have never been identified. While there have been many theories about who it might have been there has been no definitive identification. Because of the size (estimated to be $23 billion at the time), there are few market participants that could carry out an operation of that size.
There have been numerous arguments presented as to who may have been behind the sell-off. Many have claimed that the sell-off was manipulation. The most identified players who may have been behind the sell-off are the Federal Reserve, China, or the large financial institutions that have been active in the gold market and may have been spooked by requests from central banks for the return of their leased gold.
For the longest time it was denied that manipulation occurred in the gold market. This denial persisted despite a number of large financial institutions being investigated and ultimately paying billions of dollars in fines for manipulation of LIBOR, currency fixing, energy price fixing and some commodity price fixing. Ultimately, price fixing was under investigation in the gold market particularly surrounding the daily London fix of gold and silver. The result of the investigation determined that there was price fixing occurring on the London gold and silver fix and fines have been imposed.
Not only have fines been imposed against at least one large financial institution, the 100 year old London silver fix is coming to an end in August and one bank, Deutsche Bank of Germany dropped out of the London fix process and closed its commodity trading desk and was in the process of selling its seat on the LME. In some of the financial institutions, traders were let go. This has ended speculation as to whether there is price fixing and manipulation in the gold market. As with the LIBOR market, the currency market and the energy market the large financial institutions have paid fines. The fines were paid with no admission as to guilt. Manipulation in markets is temporary phenomenon that while it works for a period the markets eventually revert to the mean.
During the 1990’s central banks leased their gold out to financial institutions. The financial institutions subsequently most likely sold the gold in the market thus creating what became known as the gold carry trade. It is estimated that this may have created a short position in gold of at least 14 thousand tonnes and possibly higher. This position would need to be covered if the central banks were to ask for their leased gold back. In August 2011, Venezuela asked for their gold back and in January 2013, Germany asked for its gold that was stored with the NY Fed back. Germany was told it could take upwards of five years to get its gold back.
More recently, the same financial institutions that were predicting a collapse in gold prices prior to April 12 and 15, 2013 have been once again predicting gold could fall to $900. Is that possible? The simple answer is yes. The weekly chart of gold shown at the outset shows both the consolidation following the September 2011 high and the current consolidation. Note the six-point reversal pattern. On the seventh wave, gold broke support at $1,525 resulting in the crash of April 12 and 15, 2013. The pattern has appeared as a possible descending triangle. A descending triangle usually has a generally flat bottom with a series of declining highs. The pattern was more prevalent on silver that did not break out to what appeared at the time new highs in September 2012. The breakout to new highs in September 2012 for gold turned out to be a false breakout but at the time, it was viewed as quite bullish.
Since the breakdown in April 2013, gold has formed what appears to be another descending triangle. The relatively flat bottom is seen with the lows of June and December 2013 near $1,180. So far using the same wave count as the earlier pattern gold appears to have completed four waves and the current decline may be the fifth wave. If the pattern holds, gold should not breakdown on this move. If it falls to the bottom of the range, a low near $1,190 may be seen. This zone is also where some other trendlines come in as well as the 400-week exponential moving average (currently at $1,205).
Assuming $1,190 holds on any pullback the key is how high will the sixth wave go? Resistance is currently near $1,350. A breakout over $1,380 and the 200-week exponential moving average would be positive and possibly break the pattern. If the market were to fail under $1,350 and return to the lows, the risk rises for a breakdown and close under $1,180/$1,190. If that were the case, the potential objective for the possible descending triangle is down to about $875.
On an encouraging note, the rally that took place following the December 2013 low was a strong one. The stochastic indicator during that rally went higher than it did during the July/August 2013 rally even though the price of gold did not go as high. That is a potentially positive divergence.
Two other charts are shown below that also offer some encouragement. The first chart is the Dow Gold Ratio. The Dow Gold Ratio has been rallying since bottoming in September 2011. Currently the Dow Gold Ratio is under its recent high of 13.7 but just. The pullback in the ratio seen in January/February saw the stochastic indicator go lower than it did in August 2013 even though the Dow Gold Ratio did not make new lows. This is a potential positive divergence in favour of gold. The Dow Gold Ratio may also be forming an ascending wedge triangle, which is normally bullish once it breaks under 12.25 (and back under the 400 week exponential moving average currently at 12.39).

Charts created using Omega TradeStation 2000i. Chart data supplied by Dial Data
The second chart is the Market Vectors Gold Miners (GDX-NYSE). Here too the GDX made higher highs on the stochastic indicator during the January/February rally than it did during the July/August 2013 rally even though the GDX did not make new price highs. Again, this is a potentially positive divergence. The significance of these divergences on gold, the Dow Gold Ratio and the GDX suggests the next low for gold could prove to be important.
harts created using Omega TradeStation 2000i. Chart data supplied by Dial Data
The fundamentals for gold remain positive. The positive fundamentals are being offset, however, by potentially bearish technicals. This is a condition that appears to have existed prior to the April 2013 meltdown. There are some positive signs but gold needs to take out key areas to the upside. The important points to take out are at $1,350, $1,380 and especially above $1,430 the high of August 2013. The danger is that Goldman, JP Morgan and Morgan Stanley’s bearish forecasts prove correct and gold does breakdown and close below $1,190 on a weekly or monthly basis. If that were to happen it would most likely set up gold’s final low. The next few months could prove to be important for gold’s future direction.
###
David Chapman
email: david@davidchapman.com
website: www.davidchapman.com
David Chapman: Disclosure
Copyright 2014 All rights reserved David Chapman

 “As we near the anniversary of the historic bottom of the gold market from late June of 2013, today King World News is publishing comments from a 60-year market veteran. At nearly 90 years old, the Godfather of newsletter writers, Richard Russell, made one of his greatest calls as the massive collapse in gold came to a historic end.”


 Ecuador hands Goldman Sachs 466,000 ounces of gold worth roughly $580 million at today’s ruling price. Ecuador under its socialist President Rafael Correa is seeking sources of cash after they borrowed over $11 billion from China because they defaulted on $3.2 billion of foreign debt five years ago. This is the consequence of debt and in the hands of socialists-communists, the bonds ultimately are always defaulted upon.


