Gold & Precious Metals

  1. Liquidity flows into or out of the “love trade” (gold jewellery) and the “fear trade” (inflation and financial system risk), are the two main drivers of the price of gold.
  2. The strongest gold jewellery buyers are in India, and the election of Narendra Modi has already unleashed a huge wave of confidence amongst jewellers there. ‘Retailers added that the latest steps by the apex bank of allowing banks to offer gold loans and permitting more entities to import the precious metal were signs of encouragement. This could drive up overall demand by 5% to 7% in 2014 from last year’s level of 975 tonnes, said Manish Kedia, bullion retailer. Manoj Thakkar of bullion retailer Amrapali Industries said, “The premium on gold has gone down from $110 per ounce to $35 per ounce. The prices too have come down after the Reserve Bank of India provided conditional relief in gold imports restrictions by allowing Star trading houses to import gold. We are in for better times now.”’ –Mineweb News, Mumbai, June 2, 2014.
  3. While El Nino could delay the arrival of India’s monsoon season by one or two weeks, an end to the import restrictions could unleash a tremendous amount of pent-up demand, more than offsetting the lost crop revenues. 
  4. In the big picture, foreign investment is pouring into India. Last night, India’s central bank announced policy guidance, suggesting inflation will moderate and GDP growth will improve. As the economy strengthens, spirits are high, and this bodes well for the gold jewellery business during the second half of 2014.
  5. In America, home of the world’s largest gold fear trade, signs of inflation are beginning to appear. The Fed uses an eight year business cycle, and the last few years of that cycle tend to be when inflation appears. 
  6. The US economy is entering the tail end of the business cycle now.
  7. On that note, please click here now . Seattle’s enormous increase in the minimum wage could set off a nation-wide surge in wages, which ishighly inflationary.
  8. For a closer look at the Seattle plan, please click here now 
  9. Currently, most major money managers have a relatively similar outlook on major markets, including gold. If inflation begins to rise significantly over the next six months, significant disagreement about what that inflation means would almost certainly arise.
  10. In turn, that disagreement would create a fair amount of bond market volatility. Substantial institutional liquidity flows into gold stocks is very likely in that situation.
  11. Looking out over the next 7 months, both the love trade and the fear trade appear to favour the gold market bulls.
  12. Please click here now . That’s the GDX weekly chart, and it’s clear that significant summer rallies are the norm for gold stocks, not the exception.
  13. Look at the position of the 14,3,3 Stochastics oscillator. It’s very bullish. 
  14. I would suggest that aggressive gold stock investors should be postured in a 70% -90% net long position. Personally, I’m 90% net long and in very buoyant spirits.
  15. Please click here now . That’s the daily GDX chart. Note how little price erosion in gold stocks has occurred on a year over year basis. 
  16. Compared to past years, the erosion is minor, and there’s an enormous (albeit somewhat rough) inverse head and shoulders bottom pattern in play.
  17. Please click here now . This daily GDXJ chart looks good. There’s a nice bullish wedge forming, and my stokeillator (14,7,7 Stochastics series) has just flashed a crossover buy signal. 
  18. The technical posture of gold stocks meshes well, with the Western world’s transition from deflation to inflation, and with the mindboggling changes taking place in India. 
  19. The exactly launch point of a summer rally is likely impossible to predict, so I find it desirable to maintain a modest number of short positions. 
  20. Also, the monthly US Employment Situation report will be released on Friday, and gold has a rough tendency to decline or trade listlessly in the week leading up to the release of the report. 
  21. Is it possible that a substantial 2014 summer rally begins after the release of this key jobs report? I think so.
  22. Please click here now . I’ve outlined a rough scenario for summer rally enthusiasts on this daily silver chart. I’ve suggested silver could move up to about $22. 
  23. Much higher prices are possible if Western world inflation and Indian buying increase significantly, and I think that’s exactly what’s going to occur.
  24. Please click here now . That’s the daily gold chart. Note the bullish position of my stokeillator at the bottom of the chart. A crossover buy signal appears to be imminent, and such signals tend to be followed by $50 – $150 rallies in the price of gold!

Jun 3, 2014
Stewart Thomson
Graceland Updates
website: www.gracelandupdates.com
email for questions: stewart@gracelandupdates.com 
email to request the free reports: freereports@gracelandupdates.com


Stewart Thomson is a retired Merrill Lynch broker. Stewart writes the Graceland Updates daily between 4am-7am. They are sent out around 8am. The newsletter is attractively priced and the format is a unique numbered point form; giving clarity to each point and saving valuable reading time.

Risks, Disclaimers, Legal
Stewart Thomson is no longer an investment advisor. The information provided by Stewart and Graceland Updates is for general information purposes only. Before taking any action on any investment, it is imperative that you consult with multiple properly licensed, experienced and qualifed investment advisors and get numerous opinions before taking any action. Your minimum risk on any investment in the world is 100% loss of all your money. You may be taking or preparing to take leveraged positions in investments and not know it, exposing yourself to unlimited risks. This is highly concerning if you are an invetor in any derivatives products. There is an approx $700 trillion OTC Derivatives Iceberg with a tiny portion written off officially. The bottom line:

Digging Deep to Find the Right Mining Stock

I hope you’re enjoying your holiday! It’s always nice to have a long weekend to spend with family and friends, to honor those who defended our country, and to get some distance from the things that are most pressing on our minds.

Which brings me to my topic for this week, none other than one of the most profitable investments one can make going forward, mining shares!

As I’ve mentioned in the past, mining shares will soon be a major buy, but importantly, not all mining shares.

The reasons are simple but far too often overlooked by investors.

First, there are dozens of mining shares that have been beaten up by the three-year bear market in precious metals.

They took on mountains of debt when gold was trading at the $1,800 to $1,900 level three years ago, thinking gold was headed to the moon. And now they are paying the price.

For instance, Barrick Gold Corp. (ABX), the world’s largest gold mining company, has $1.5 billion of debt maturing next year. It’s issuing new equity to investors to help pay off that debt, thus diluting shareholder equity.

In addition, it’s looking to merge with giant Newmont Mining (NEM) to also help out its debt malaise by reaching economies of scale via merging with another giant.

image130Newmont is a top-notch miner, but if it merges with Barrick, which I expect it will, then Newmont will lose its independence and get saddled down with Barrick’s problems.

In years past, I wouldn’t hesitate to recommend Newmont. Now, I’m not so sure.

Or take Oz Minerals, a beloved miner during gold’s first phase of its bull market, a stock that catapulted from $0.53 a share in August 2004 to a high of $15.59 in July 2011 …

Yet the company is now facing no less than three shareholder lawsuits due to $340 million of debt the company took on starting in 2008.

Its share price today: In the mid-$3 range, having lost 77 percent of its value since its 2011 high.

Will it thrive again? Hard to say. The company has taken the right steps recently, writing off non-performing assets and working hard to relieve its debt load and to increase operating efficiencies.

I may or may not recommend it going forward. It will all depend not upon the company’s properties and reserves and resources, but how management handles the various issues it now finds itself struggling with.                                                                                    All the gold ever mined could fit into a 60-foot cube.                                                                                         

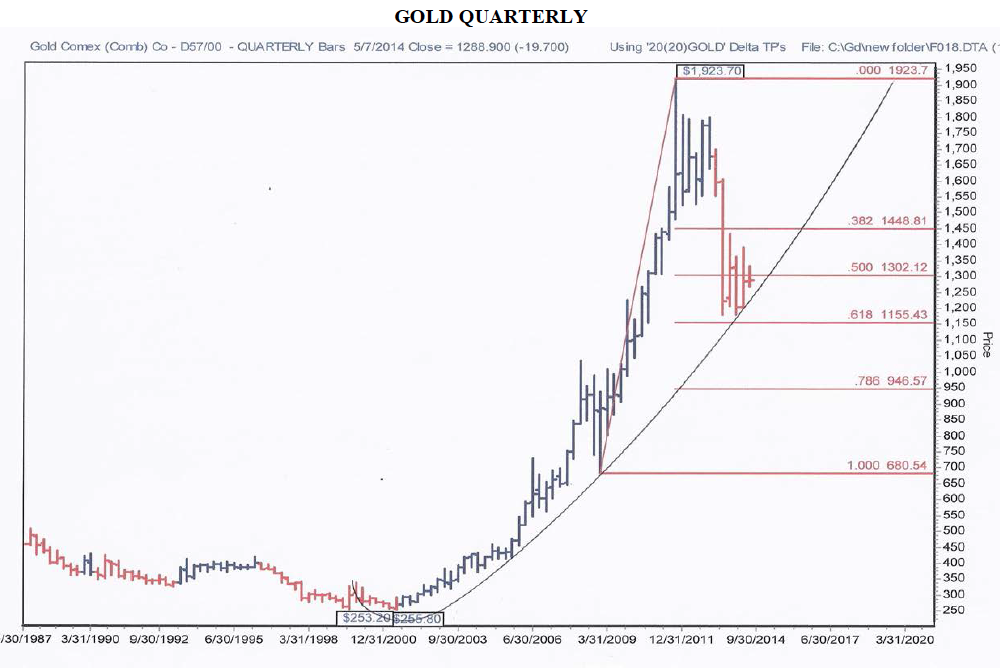
My point is this: In 2000, when gold bottomed at $255 an ounce, buying mining companies was like shooting fish in barrel.

Today, it’s entirely different. You must do your homework before buying any mining shares. Period.

Second, many mining companies are now hedging, or considering hedging, their precious metals reserves.

London-listed Hochschild Mining Plc and Canadian miner Detour Gold, for example, announced this year they would open new hedges, mostly to help finance new projects and pay off debt.

Russia’s biggest gold miner, Polyus Gold, is also looking at hedging. As is Barrick Gold and many others.

That would be fine if gold or silver were to stay in bear markets. But they are not. And I want my followers to be rewarded as the price of gold and silver rise again. Hedging robs them of that.

Third is the quality of the properties and the ore the miner has. All over the world, gold is reaching peak production. In 1995, for instance, 22 gold deposits were found that contained more than 2 million ounces each.

In 2010, there were only six such discoveries. In 2011, only one. And since then, for 2012, 2013 and thus far for 2014, not one single 2-million ounce deposit has been found.

Consider Nevada, home to almost three-quarters of U.S. gold production. Gold production in Nevada has plunged fully one-third since 1998.

There’s simply a lot less gold to mine. All the gold ever mined could fit into a 60-foot cube.

In the earth’s crust, gold today is found in roughly 0.005 parts per million, minuscule when compared with copper at 50 parts per million, or iron at 50,000 parts per million.

Overall, ore grades have plunged more than 35 percent since 2001 …

Meanwhile, production costs per ounce of gold have soared from $200 an ounce in 2000 to over $1,100 today.

Shooting fish in a barrel this time around, as gold and silver begin new bull markets higher? Hardly!

This time around, you will have to be very selective, constantly monitoring company developments, management decisions, and more.

Is there money to be made? You bet. Tons of it. So much so, that I see a select handful of miners that I am now monitoring soaring as much as 3,000 percent over the next few years. Enough to turn a $10,000 investment into as much as $320,000.

And then there are the large swings that will inevitably occur. Catch a few of those, grabbing gains on rallies and buying back in on pullbacks, and you could do even better.

So stay tuned, the time to start buying and trading mining shares will soon be here.

Best wishes,

Larry

P.S. Use my 4-part Freedom Plan to reclaim your privacy, protect your money, GROW your wealth and build American Revolution 2.0.

Posted by Larry Edelson


ABOUT LARRY EDELSON

This investment news is brought to you by Money and Markets. Money and Markets is a free daily investment newsletter from Martin D. Weiss and Weiss Research analysts offering the latest investing news and financial insights for the stock market, including tips and advice on investing in gold, energy and oil. Dr. Weiss is a leader in the fields of investing, interest rates, financial safety and economic forecasting. To view archives or subscribe, visit http://www.moneyandmarkets.com/.


Precious Metals Plunge & 2 Silver Charts for You

Saturday we published TDG #363, a 30-page update. This update included among other things brief reports on three companies we’d consider potential non-core positions. These are three stocks which could rebound substantially from lower prices. We also discussed downside targets for GDX, GDXJ, Gold, Silver, etc and buy targets for various companies.   

I have two charts from the update here. The first is the gross short positions in Silver, which in nominal terms reached nearly 60K contracts, an all-time high. Relative to open interest the gross shorts are not yet at an all-time high.  

may31silvergs

We carefully constructed this next chart with 23 years of data. We only took data from years Silver was in a secular bull market. We excluded 1980 as Silver peaked in January and the parabolic rise and crash could skew the results. 

Look how strong the seasonality is. Even though Silver is in a secular bull market it essentially makes no progress for half the year (March through August). The time to buy is obviously the start of July.  

may6silverseasonals

We are very keen on Silver bottoming before Gold. When could it bottom? At what price? We discussed our thoughts in the premium update.  

Last week we wrote: We’ve been prepared for downside with hedges and cash and now we are thinking that the miners could break towards their December lows. Of course we’ve thought so for the last few weeks so time will tell. In any event we are waiting for that buying opportunity. Patience is now the key over the coming weeks.

The model portfolio has held up very well during this selloff. It closed the week up nearly 1% and was up about 2% after Wednesday. You live and you learn from your mistakes….or you blame manipulation and you don’t. We’ve endured two nasty bears in the last six years. It’s because of that experience that we’ve hedged ourselves well in recent months.   


—-

As we’ve noted in recent weeks, we’ve made some changes to our premium service that I’m very excited about. I think the quality of our premium service is higher and with subscribers able to follow our trades (knowing our plans in advance) in the new portfolio, I expect our and their performance to be better. Click below to learn more about our service and watch the new video for details.

Thanks for reading. I wish you all great health and prosperity in 2014. 

-Jordan

Disclaimer: Sponsor Companies are paid sponsor companies of TheDailyGold.com website and this free newsletter. Do not construe sponsorship with a recommendation. The author of this newsletter is not a registered investment advisor. This newsletter is intended for informational and educational purposes only and should not be considered personalized and individualized investment advice. Investment in the precious metals sector contains significant risks. You should consult with an investment advisor and due your own due diligence before making any investment decisions. This email may contain certain forward looking statements which are subject to risks, uncertainties and a multitude of factors that can cause results and outcomes to differ materially from those discussed herein. 

Argonaut Gold Corvus Gold
Balmoral Resources Bear Creek Mining

#1 Most Viewed Article: THIS IS HOW A BULL MARKET IN GOLD BEGINS AND ENDS

If ever a picture told us the bottom is in this is it. This chart is perfection personified.

*For a larger view, more commentary & charts click on the chart or go HERE

Screen Shot 2014-05-27 at 8.57.14 AM

*For a larger view, more commentary & charts click on the chart or go HERE

There is a bizarre dichotomy between financial markets and the economy. According to Gillian Tett of the Financial Times, this stage of a global economic recovery would normally be associated with much more volatile stock markets as interest rates rise and there breeds a divergence of investor opinions on growth expectations. Instead lackluster economic growth reported for the first quarter in both Canada and the US are paired with muted market reactions and record low measures of both volatility and forecasted volatility in the days ahead.

This really is the first time investors have had to grapple with the question surrounding what role policy makers play in the financial markets. The shift between public to the private has many questioning whether the underlying economy on its own can assume this role. And naturally, this should be a point where the economy is reaching escape velocity (to borrow the words of superstar Bank of England, and former Bank of Canada Governor Mark Carney). Instead though, we are at a crossroads.

The sovereign bond market is telling a much different story than what is going on in the equity arena. While the S&P500 continued to make record highs through the final trading week in May, the US 10 year Treasury bond is sitting on its lowest yield in a year. Some analysts attribute this to the potential for credit easing in Europe pending future actions from the ECB Thursday of next week. Potentially, forward looking yield hungry investors are shifting across the Atlantic. But an additional scenario, again from the Financial Times this past week suggests China’s appetite for US debt is once again growing, having just recently peaked in November of last year. And with gold being the natural hedge to the US dollar, growing demand for Treasuries should be accompanied by stronger demand for the yellow metal from China.

Demand from Asia will always create a natural support for the price of gold. But given that growth in demand from China has been almost exponential, it’s hard to envision this will be the catalyst that sees the price of gold surge in the months and years ahead, accounting for the negative price action beginning in September of 2011. The price of gold, however, has two strong natural drivers, and they are inflation expectations and economic uncertainty. Economic uncertainty is almost an ex post or after the fact type of idea; it ads momentum to the market. Despite every doom and gloom analyst repeatedly trying to predict the next great recession since 2008, these past six years have illustrated their lack of skill in forecasting. Black Swans are a lot more apparent in hindsight.

It is inflation expectations, preceding actual future inflation that will sustain a rally in the price of gold. This did not occur immediately following the US Federal Reserve expanding their balance sheet. Inflation expectations were high; inflation did not ensue. One reason was the velocity of the money supply remains at record lows as money is not changing hands. With an uptick in the economy, which by expectations could come in the second quarter, and the velocity of money increasing, this could lead to inflation and will begin the renewal of the bull market in gold.


***


We will be at the Canadian Investor Conference this Sunday and Monday (June 1-2, 2014). We encourage you to come out and see us, and enjoy the event. Details can be found at