
Gold & Precious Metals

I want to make you aware of a possible major breakdown in the US dollar index and provide you with my gold forecast. If this scenario plays out then we will see the Euro explode to the upside and also see commodity based currencies like the Canadian dollar, and Aussie dollar rally. This would also be bullish for commodities in general like gold, silver, precious metals mining stocks etc…
The US dollar index chart below clearly shows a three year topping pattern with multiple price levels which when broken will trigger farther selling. These red horizontal lines on the chart show these price levels.
Critical support is around the 79.50 area which if breached should start a major wave of selling in the next few months. The initial wave of selling should take price all the way down to the 78.00 level before taking its first breather/pause.
*Trade Tip*
Most technical analysis books and traders think that the more times a support trend line has been touched the strong it becomes. That actually could not be any further from the truth.
Let me tell you how to trade trendlines.
1. You must have at least two pivot points (highs or lows) to be able to draw a trendline.
2. The 3rd and 4th touch of this line can be traded for a bounce.
3. Any touch of the trendline after the 4th is actually doing damage as it eats up the support volume.
4. A rising trendline like the one below clearly shows multiple pivot lows that when breached will trigger stops and flood the market with supply/sellers. It’s the perfect storm for a downward move.

Gold Forecast
My gold forecast has not changed in nearly a year as we wait for the gold market to bottom, then prove it’s self by breaking out of its basing pattern.
The bullish gold forecast is of the bigger picture. Most gold market traders and investors are caught up with the day to day price action and are growing tired of the range bound trading which gold has been doing for some time now.
In 2011 I pointed out the possible major topping pattern in gold, and that if price broke to new lows, then it would be lights out for at least a year if not two before the chart would build a new bullish base. And that leads us to my current gold forecast.
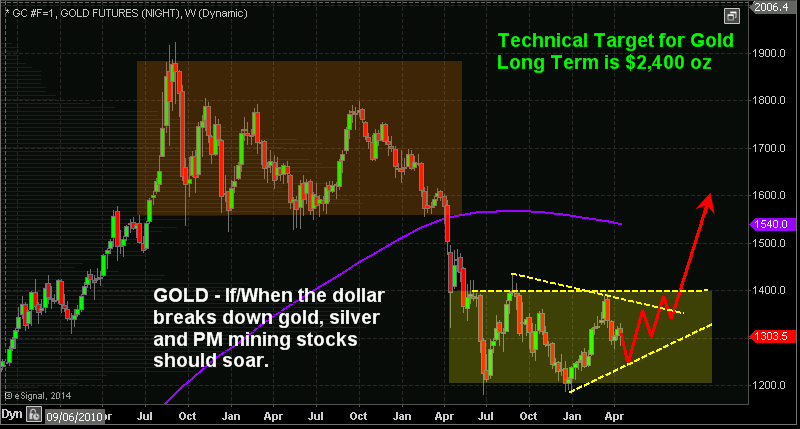
Gold Forecast & Gold Market Traders Conclusion:
In short, my gold forecast should be looked at from the big picture perspective. Getting involved in any gold stock, commodity or investment that is stuck in a range does carry more risk. It is easy to get shaken out of these positions a few times before the new bull market emerges.
The lowest risk position is to wait for the breakout of the basing pattern (yellow rectangle), only then can gold market traders get heavily involved to the long side.
Get My Weekly Gold Forecast FREE – www.GoldAndOilGuy.com
Chris Vermeulen
*******

Strengths
- Gold rose to a two-week high following the release of the Federal Reserve minutes, which showed that projections for an interest-rate increase may be overstated. According to the Fed, several participants expressed concerns that the rate forecast could be misconstrued, indicating a move to a less-accommodative function. On a related note, Ted Dixon, INK Research founder, commented during an interview on current insider buying trends in the gold space, stating that insider buying in U.S. stocks has been languishing for a long time. But the indicator for the TSX Gold Sector shows a ratio of insider buying to insider selling of 2.5:1. This is one of the most bullish readings ever.
- On Thursday, Goldcorp responded to Yamana Gold’s friendly offer for Osisko, raising its hostile bid to an implied value of $3.3 billion, roughly $1 billion more than Goldcorp’s original offer. According to Nick Pocrnic of Raymond James, it is not unreasonable to imagine Osisko’s CEO Sean Roosen, and Peter Marrone, Yamana’s CEO, appealing to the Quebec government to sweeten the Yamana offer and prevent Goldcorp from acquiring the company. This transaction highlights the recent pick up in merger and acquisition (M&A) activity in the gold sector. Total transaction volume for the first quarter of 2014 nearly equaled that for all of 2013, as the large cap producers got involved. What could be next? Detour Gold, Aurico Gold and Probe Mines could all add quality ounces in a safe jurisdiction.
- NGEx Resources announced drilling results at its Filo Del Sol project in Argentina. The results included intercepts of 5.80 percent copper over 22 meters, and a 6-meter interval of 12.41 gram per tonne gold. The company rose 15 percent following the announcement. Lucara Diamond Corp., which produces high-value precious gems from its flagship Boteti Karowe diamond mine in Botswana, on Thursday held its first exceptional stone tender of the year, which garnered gross proceeds of $50 million, an impressive average price per carat of $42,347. Mariana Resources’ shares rose after it received a $0.6 million VAT refund from the Argentinean tax authorities. The funds will be utilized to advance its gold and silver exploration properties in the highly prospective Santa Cruz province, southern Argentina.
Weaknesses
- In a highly-commented Mineweb article, author Lawrence Williams details that Former Assistant Treasury Secretary Paul Craig Roberts stated categorically that the gold price is indeed manipulated by the U.S. Fed. The Fed has had to resort to this practice in order to protect the value of the U.S. dollar and its reserve currency status from its effective reduction in value through its quantitative easing (QE) policy. According to Roberts, intervention in the gold market has been occurring for a long time, but has become more and more blatant and desperate recently. Roberts says that the Fed accomplishes it through a series of gold price flash crashes by short selling huge amounts of gold futures into the COMEX market, usually at times when trading is thin.
- Centamin reported that for the first quarter of 2014, total gold production from its Sukari mine in Egypt fell 19 percent quarter-on-quarter to 74,241 ounces. The result is certainly disappointing given that the company has been implementing a major plant expansion and was thought to be in a position where higher-grade, underground sections were being accessed, thus providing more ore to the mill. The production shortfall is attributed to poor mining fleet availability, with the company stating that underground mining equipment issues have been rectified by the end of the quarter.
- Primero Mining provided disappointing 2014 guidance for its recently-acquired Black Fox asset. According to the miner, 2014 production will reach 70,000 to 80,000 ounces with operating costs of $850 to $900 per ounce, with a total capital expenditure bill of $48 million. The forecast compares very poorly with much more optimistic analysts’ estimates based on operating metrics observed during Brigus’ operation of Black Fox. According to BMO analyst Brian Quast, Primero’s cost assumptions appear ultra-conservative, and he expects the asset to show an improving trend going forward.
Opportunities
- Mining-focused, private equity firm Waterton Global Resource Management has raised $1.016 billion for its latest flagship precious metals fund. The Waterton Precious Metals Fund II will focus on late-stage development projects in politically stable jurisdictions, primarily North America. Acquisitions will likely be in the range of $25 million to $200 million, and will speed up or slow down capital deployment depending on the opportunities.
- On Monday night, Philippe Couillard’s Liberals won a formidable majority in the province of Quebec. The implication for the resources sector is the imminent acceleration of the Plan Nord, a massive mining development plan that when first introduced, called for $80 billion in investment over 25 years. This included $47 billion towards renewable energy and $33 billion towards mining and infrastructure. The following day Stornoway Diamond Corp. announced its entry into a $944 million binding financing agreement with a syndicate of Quebec funds and lenders for the construction of the Renard Project in north central Quebec. The opportunity for Quebec-domiciled names and operators such as Virginia Mines is tremendous.
- Barry Bannister, Chief Equity Strategist at Stifel, published a report highlighting that U.S. real interest rates are set to decline, which bodes well for gold in 2014 and may bring the yellow metal to $1,600 per ounce. His analysis partly reflects the opinion of Jefferies Strategist David Zervos, who argues the Fed will continue to punish cash hoarders, mainly by allowing real interest rates to go negative. Negative real interest rates force investors to deploy their cash as cash-hoarding comes with a cost in the form of inflation exceeding the nominal return on cash.

Threats
- Gold is set to drop as the U.S. economic recovery picks up, according to UBS analysts. The Swiss bank’s analysts believe gold will trade between $1,300 and $1,350 per ounce at the end of the year, arguing that any price rally will prove short lived. Analyst Tom Price stated that the outlook is modestly bearish as the U.S. comes out of the winter period, and economic activity continues to lift and deliver good macroeconomic support.
- Gold is Morgan Stanley’s least-preferred commodity among the metals on the outlook for rising U.S. interest rates and low inflation expectations. Analyst Joel Crane states that the factors that boosted bullion in the first quarter, including Ukraine tensions, are set to weaken. As a result, Crane expects prices to drop for the next four quarters.
- On May 13, the SEC’s Dodd-Frank-mandated conflict minerals reports are due, and a significant number of public companies risk falling behind, according to PwC. According to Mineweb, the conflict minerals rule requires companies registered with the SEC to determine or disclose if any of their minerals, including gold, may have originated in the Democratic Republic of the Congo. If so, the companies must determine whether these minerals in the products are conflict-free.
By Frank Holmes
CEO and Chief Investment Officer
U.S. Global Investors
The relationship between the Dow and silver has been very consistent during the last 100 years. After each of the major Dow peaks (real, not necessarily nominal peaks), we eventually had a major bottom in silver. Below, is a 100-year inflation-adjusted Dow chart:
Click image for larger view

In September 1929, the Dow peaked in terms of US dollars as well as in terms of gold ounces (real terms). After about 1 year and 4 months, silver made a significant bottom. While the Dow continued to fall for most of the time, silver rallied until it peaked in January of 1935. At silver’s peak, the Dow was about 30% lower in real terms than what it was at silver’s bottom.
Again, in January 1966, the Dow peaked in real terms. After about 5 years and 10 months, silver made a significant bottom. While the Dow continued to fall for most of the time, silver rallied until it peaked in January of 1980. At silver’s peak, the Dow was about 55% lower than it was at silver’s bottom.
In 1999, the Dow once more peaked in real terms, and about after 2 years and 3 months, silver again made a significant bottom. However, over the period from the silver bottom to the peak in April 2011, The Dow actually went sideways (actually slightly higher). See on the following chart:
Click image for larger view

This is just one of the reasons why I know that the April 2011 high in silver is not the peak for this bull market. Why? Silver stands in direct opposition to paper assets like stocks that are part of the Dow. Therefore, when silver has a “real deal” rally, then paper assets like the Dow will lose significant value over the same time.
This is because the debt-based monetary system does what I call a “mirror-effect”, whereby, silver (and gold) is pushed down in value, to a similar extent as to which paper assets such as general stocks are pushed up in value. When the rally of the paper assets eventually runs out of steam, then there is a big push for silver and gold.
Silver’s real deal rally will happen when people run to silver for its monetary benefits. That is not really happening yet, in a big way, but it is about to – very soon. Money is what silver is, and it is this that will drive the coming spectacular silver rally.
So, if we look at the Dow chart again (below), one can see that the silver peaks of the 70s and 30s occurred when the Dow was trading closer to the lower levels of its range. Currently, the Dow is trading at all-time high levels. If the Dow is currently having a “real deal” rally, then it means we are going to have to wait a long time before silver has its real rally.
Click image for larger view

However, if the Dow is just having a fake rally, then silver will spike as soon as the Dow’s fall gathers steam, and possibly peaks when the Dow hits a level indicated on the chart, as a minimum. One, therefore, has to decide whether this Dow rally is real or fake.
For more of this kind of analysis on silver and gold, and why I think that the Dow’s current rally is fake, you are welcome to subscribe to my premium service. I have also recently completed a Long-term Silver Fractal Analysis Report.
Hubert
“And it shall come to pass, that whosoever shall call on the name of the Lord shall be saved”

-
I know Mike is a very solid investor and respect his opinions very much. So if he says pay attention to this or that - I will.
~ Dale G.
-
I've started managing my own investments so view Michael's site as a one-stop shop from which to get information and perspectives.
~ Dave E.
-
Michael offers easy reading, honest, common sense information that anyone can use in a practical manner.
~ der_al.
-
A sane voice in a scrambled investment world.
~ Ed R.
Inside Edge Pro Contributors

Greg Weldon

Josef Schachter

Tyler Bollhorn

Ryan Irvine

Paul Beattie

Martin Straith

Patrick Ceresna

Mark Leibovit

James Thorne

Victor Adair