
Gold & Precious Metals
So far, 2014 has been a paradoxical year for gold. Many investors aren’t even aware that it has rallied almost 8%. On the rare occasion that the financial media mentions the yellow metal, it is only in the context of comparing the recent rise to last year’s decline.
In spite of this overwhelming negative sentiment, gold is experiencing a stealth rally as one of the best performing assets of the year. Let’s look at some important metrics of the most under-valued sector in this market.
Speculations Reversed
So many investors want to believe that last year was the death knell for the yellow metal that they’ve stop paying attention to the technical metrics responsible for driving the price down. These metrics have already started to reverse.
Last year, technical speculators – and everyday investors trading behind them – influenced gold’s price more than anything else. Notably, 2013 was the first year since their creation in 2003 that gold exchange-traded funds (ETFs) experienced a net outflow of their gold holdings. This played a pivotal role in driving down both the gold price and investor expectations for the yellow metal.
Gold ETFs sold off their holdings by a whopping 881 metric tons last year. GLD, the largest fund, sold 550 of those tonnes on its own. This was influenced by, and then compounded, the effects of extremely bearish gold futures speculators, whose large net-short positions were responsible for some landmark drops in the gold price throughout the year. As is typical with markets, negative sentiment became a self-fulfilling prophecy.
For the previous decade up until last year, physical gold demand had driven the gold bull market. However, ETFs have over this time accumulated a greater and greater share of the market. Thus, last year’s sudden ETF sell-off was enough to drive total global gold demand down 15% year-over-year. Even 28% growth in bar and coin demand – resulting in record-breaking total demand – couldn’t counter the market’s bearish turn. But ETFs are getting back in the game. GLD started adding to its holdings again in February, the first increase since December 2012. And by mid-March, COMEX gold futures contracts had the most net-long positions since November 2012.
Gold Versus Equities
Why are ETF and futures traders reversing their previously bearish positions?
Prices are up in every area of the gold sector. GLD and COMEX futures are both up more than 6% this year. GDX, one of the broadest gold-mining ETFs, is up more than 12%. Even with a sell-off in the last week of March, physical gold was up almost 8% in the first quarter.
Meanwhile, the general stock market is barely performing at all. The S&P 500 and the NASDAQ are up barely 2% YTD, while the Dow is down.
Most importantly, when measured in terms of gold, the Dow has actually started to drop significantly. At the end of March, the Dow was about 12.5 times the gold price. This is already a 9% decline since December. For the majority of the last 100 years, the Dow has traded far below this level.

To get back to its historical average, either the Dow is going to have to drop significantly or gold will have to skyrocket. I believe it will be a combination of both.
Overpriced and Under-Earning
Anyone who really buys the story of economic recovery is likely riding a wave of irrational exuberance after a year in which the major indices hit record high after record high. They don’t express the slightest concern that the stock market is already in dangerous bubble territory.
However, one of the most important metrics of stock market valuation completely contradicts this.
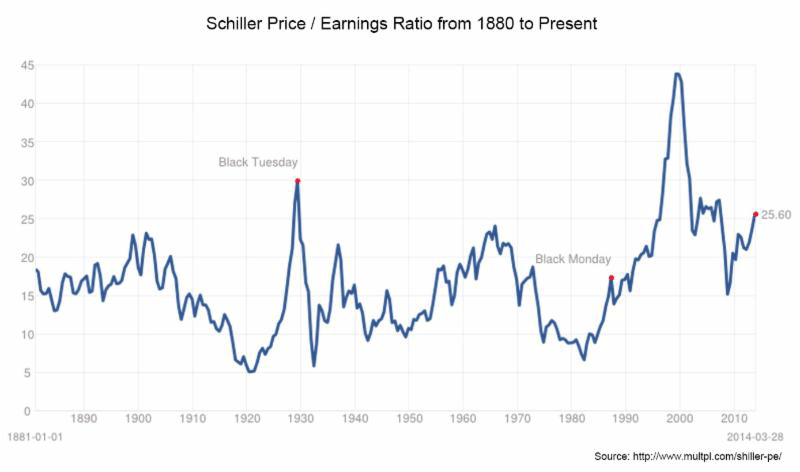
The Shiller Price/Earnings Ratio (Shiller P/E) is well-respected for helping analysts like me identify one of the most over-valued markets in history – the dot-com bubble. This metric gauges the return on investment for someone buying into the broader stock market. A higher ratio indicates investors are paying more for shares of companies that are earning less; therefore, they are receiving less value.
At the end of March, the Shiller P/E stood at 25.60 – almost 55% higher than the historical average of 16.5. As you can see in the chart below, the only previous times the ratio has breached 25 were during the 1929 stock craze, the dot-com bubble, and just before the ’08 financial crash.
I would not want to be anywhere near an investment with such poor yield.
Don’t Look Back
Investors often make the mistake of investing in the last trade, the same way that governments always fight the last war. After a year in which stocks brought in about a 30% return while gold was pummeled, nobody wants to be the first one to jump back into hard assets.
But fortunes are often made by ignoring the popular trend and buying underpriced assets when nobody else sees their value. Sometimes this is a risky maneuver, but in the case of today’s gold market, it’s as close as we can get to a sure thing.
It’s hard to predict what will trigger the next collapse of stocks, but gold is already on the road to new highs. Janet Yellen is gearing up to unleash a new torrent of freshly printed dollars onto global markets. I’d recommend building your ark well in advance.
###
Apr 2, 2014
Peter Schiff
C.E.O. of Euro Pacific Precious Metals
email: info@europacmetals.com
website: www.europacmetals.com
Peter Schiff is CEO of Euro Pacific Precious Metals, a gold and silver dealer selling reputable, well-known bullion coins and bars at competitive prices.
For the latest gold market news and analysis, sign up for Peter Schiff’s Gold Report, a monthly newsletter featuring contributions from Peter Schiff, Doug Casey, and other leading experts. Click here for your free subscription.

Briefly: In our opinion short speculative positions in gold (half), silver (half) and mining stocks (full) are justified from the risk/reward perspective. (this is for agressive traders – Editor Money Talks)
Generally, everything that we wrote in our previous alerts remains up-to-date – precious metals are likely to move lower in the coming weeks – and the thing that we would like to emphasize today is that even if we see an upward correction, it will likely not be anything more than just that – a correction. Let’s take a look at the mining stocks chart (charts courtesy of http://stockcharts.com).
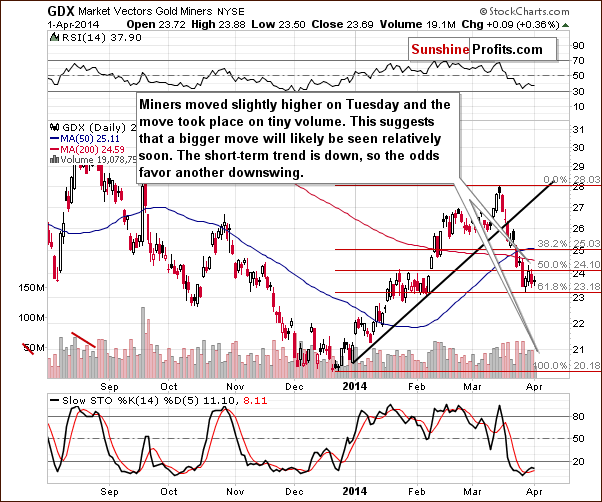
Miners bounced after moving to the 61.8% Fibonacci retracement level and no wonder – the preceding decline had been quite sharp. We could have written that they paused, as the move higher was rather small. Tuesday’s small upswing took place on very low volume, which suggests that we are right before a more significant move – the question is what direction miners will take.
The preceding short-term move was down, so based on the above chart it’s more likely that the next move will be to the downside as well. However, even if we see a move to $25 or so in the coming days, it will still look like a correction.
Why could we see a temporary move higher here?
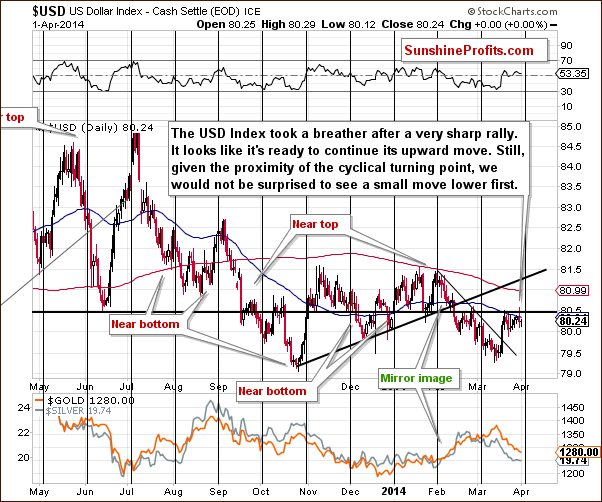
The USD Index is about to reach its cyclical turning point. It’s a tough call to determine the short-term action based on it, as the most recent move was horizontal – the USD Index has been consolidating in the second half of March.
The move that preceded the consolidation had been up, so the next move is also likely to be up, especially that we are after a long-term, medium-term, and short-term breakouts. However, on a very short-term basis, we can’t rule out a dip based on the turning point alone.
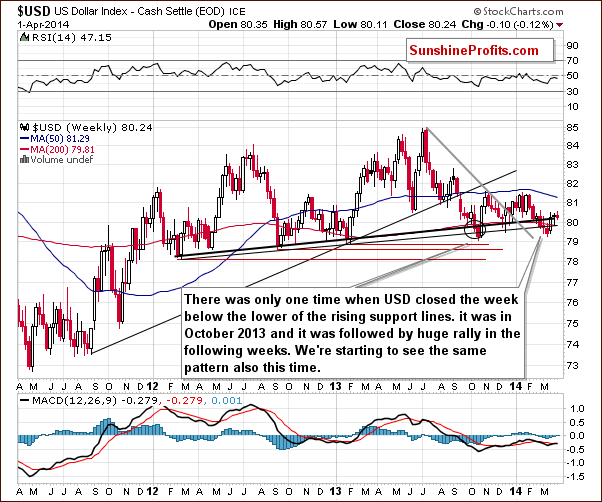
As mentioned previously, the situation in the precious metals market and in the USD Index is just as it was in the previous days. The USD index is likely to move higher (even if it declines a bit in the first part of April) as it already paused after a short-term breakout and when it does rally, we will be likely to see another slide in the precious metals sector.
To summarize:
Trading capital (our opinion): Short positions: gold (half), silver (half) and (full) mining stocks.
Stop-loss details:
– Gold: $1,342
– Silver: $20.85
– GDX ETF: $25.6
Long-term capital (our opinion): No positions
Insurance capital (our opinion): Full position
You will find details on our thoughts on gold portfolio structuring in the Key Insights section on our website.
As always, we’ll keep our subscribers updated should our views on the market change. We will continue to send them our Gold & Silver Trading Alerts on each trading day and we will send additional ones whenever appropriate. If you’d like to receive them, please subscribe today.
Thank you.
Przemyslaw Radomski, CFA
Founder, Editor-in-chief
Tools for Effective Gold & Silver Investments – SunshineProfits.com
Tools für Effektives Gold- und Silber-Investment – SunshineProfits.DE
* * * * *
Disclaimer
All essays, research and information found above represent analyses and opinions of Przemyslaw Radomski, CFA and Sunshine Profits’ associates only. As such, it may prove wrong and be a subject to change without notice. Opinions and analyses were based on data available to authors of respective essays at the time of writing. Although the information provided above is based on careful research and sources that are believed to be accurate, Przemyslaw Radomski, CFA and his associates do not guarantee the accuracy or thoroughness of the data or information reported. The opinions published above are neither an offer nor a recommendation to purchase or sell any securities. Mr. Radomski is not a Registered Securities Advisor. By reading Przemyslaw Radomski’s, CFA reports you fully agree that he will not be held responsible or liable for any decisions you make regarding any information provided in these reports. Investing, trading and speculation in any financial markets may involve high risk of loss. Przemyslaw Radomski, CFA, Sunshine Profits’ employees and affiliates as well as members of their families may have a short or long position in any securities, including those mentioned in any of the reports or essays, and may make additional purchases and/or sales of those securities without notice.
 As global markets continue to see some wild trading as we head into April, today James Turk sent King World News a shocking chart which shows that the price of gold needs to rise by more than a staggering 100% in just 12 short months. Turk also spoke about why this historic move will take place in his powerful interview below.
“If you look at Turk’s astonishing chart below, it reveals that gold and the S&P 500 have essentially tracked the increase in the Fed’s balance sheet over a period of many years. This remained the case until Western central planners made the decision to intervene in and manipulate the gold market in a much more aggressive manner. As the chart above clearly illustrates, what they have done to the price of gold is totally unsustainable, but it is breathtaking to look at the distortion in the very short-run.”
….highly recommend viewing this chart by reading more HERE – Editor Money Talks
 “So, what gives, Larry? For years, you have been right as rain on gold and silver, and now, it seems like you’re striking out left and right?”
“You told us the metals would bottom in January. Instead, they rallied and you missed the rally.”
“You told us the metals would then bottom again in May, and now I hear you think the bottom might be in.”
“You got the latest decline right, but have gold and silver bottomed or are they heading still lower?
“Have you lost your bearings, Larry? Or worse, your mind?”
That summarizes a lot of the emails I’ve been getting lately. So let me respond now.
I appreciate everyone’s comments. And yes, I have missed the mark lately.
But let’s put everything in perspective:
First, the short-term swings are always extremely difficult to pin down — and even far more difficult when entering a period where a major trend turn is expected.
Second, I am 100 percent confident that the metals are bottoming this year and that gold and silver are headed substantially higher in the years ahead.
Third, the extremely high level of investor emotions in the gold and silver markets right now is very typical at major turns. So try to stay objective. Getting emotional will only cause you to make mistakes.
Fourth, all the underlying fundamental, cyclical and technical conditions for a new bull market in gold and silver are in place. The most important one: The rising tide of the war cycles and geo-political stress.
Fifth, I will get you as close to the bottom as humanly possible, not just in terms of price — but more importantly — to the point in time and price when the potential downside risk versus the upside rewards offers the best profile.
I can say that, confidently, because I don’t know anyone in the business that has as accurate a long-term track record forecasting the major turns in the precious metals as I do.
From the 1980 high to the low in 2000, to buying the pullback in the middle of the financial crisis in 2008/09.
To declaring the top was in mere days after gold hit its record $1,921 high in September 2011.
To the three-year bear market since then.
I remain 100 percent confident that my successful long-term track record will continue well into the future.
Now, let me give you a more detailed explanation of what’s happening in gold and silver.
As I recently told my Real Wealth Report subscribers, it is simply too soon to determine whether or not the precious metals have bottomed.
There are, no doubt, a lot of reasons to be bullish now, including Ukraine and the fact that gold has rallied a smart $200 since its $1,180 low on the last day of December, taking out my system resistance levels at $1,320 and chart resistance at the $1,360 level.
Yet since then, gold and silver have both — as expected — pulled back sharply. And let me remind you, many investors who jumped on the recent rally, ignoring my advice, are already suffering losses.
That said, due to their recent price declines,
very importantly, there is now
only one scenario left for gold and silver.
If gold and silver have indeed already bottomed, then …
1. Gold must hold the $1,278 level (basis spot, or cash) on a closing basis and start to rally anew. And …
2. Silver must hold its June 2013 low at $18.18 on a closing basis, and start to rally anew.
Anything short of the above, and gold and silver will be headed to new lows later this year.
Given we are so close now to the final tipping point for gold and silver, the next two logical questions are:
“First, if gold and silver are so close to confirming a bottom, price-wise, why not just start buying now?
Second, what about mining shares?”
My answers:
A. I am conservative. I’m the kind of guy who likes proof, concrete proof, before making any final decisions.
So if gold and silver’s recent declines hold the above levels … and they start to rally anew and execute minor buy signals on my systems, then I will not hesitate to tell you the bottom is in.
B. The same applies to mining shares. Each mining share of course has its own set of conditions and circumstances, ditto for mining share ETFs.
But when push comes to shove, before I start recommending mining shares, I want to be extremely confident that gold and silver have indeed confirmed a bottom.
So until then, the jury on mining shares is still out.
For now, watch the above numbers for gold and silver. They are indeed CRITICAL.
While I cannot tell you precisely what to do if those levels hold – Specific recommendations are naturally reserved for members of Real Wealth Report and my trading services – I will give you updates in my Monday columns.
Best wishes,
Larry
– See more at: http://www.swingtradingdaily.com/2014/03/31/so-what-gives-larry-plus-a-very-important-update/#sthash.AVJXNl91.dpuf


-
I know Mike is a very solid investor and respect his opinions very much. So if he says pay attention to this or that - I will.
~ Dale G.
-
I've started managing my own investments so view Michael's site as a one-stop shop from which to get information and perspectives.
~ Dave E.
-
Michael offers easy reading, honest, common sense information that anyone can use in a practical manner.
~ der_al.
-
A sane voice in a scrambled investment world.
~ Ed R.
Inside Edge Pro Contributors

Greg Weldon

Josef Schachter

Tyler Bollhorn

Ryan Irvine

Paul Beattie

Martin Straith

Patrick Ceresna

Mark Leibovit

James Thorne

Victor Adair