
Gold & Precious Metals
Reasonable places to buy a correcting Gold Market, the author makes the case for Predicting Major Turning points for Gold – Editor Money Talks
Gold Projection by the Golden Ratio
This article shows how Gold has been following the Golden Ratio which predicted all the major turning points with a high degree of accuracy for the past thirty years, and reveals the next possible major turning points. The Golden Ratio 1.618034… (also called the Golden Number, the Golden Section or the Golden Mean) can be found everywhere around us from mathematics to architecture, from nature to our own anatomy. But as you can see in the following analysis, it can also be found in the Gold Metal Charts.
The first chart presents the Secular Bear Market from 1980 to 1999 and the Cyclical Bull Market from 1999 to 2011 and shows how they are connected to the Golden Ratio 1.618. Firstly, you can see that the three most important turning points (1980 top – 1999 low – 2011 top) had a time duration which is accurately connected to the Golden Ratio. It is also interesting to note that the Golden Ratio has an inverse correlation with the previous turning point (high-low-high).
Secondly, the first leg up of the Cyclical Bull Market from the low on August 25, 1999 to the top of March 17, 2008 predicted exactly the low on June 28, 2013. Here again, the Golden Ratio has an inverse correlation with the previous turning point (low-high-low).
Thirdly, the second leg up of the Cyclical Bull Market – from the low on October 24, 2008, to the top on September 6, 2011 – pinpointed also the low on June 28, 2013 and once again, the correlation is inverted (low-high-low). (click image for larger view)

The next chart shows the Cyclical Bear Market from the 2011 top to the 2013 low. A look at the time duration of the tops and lows of this bear market reveals that it has an inverse correlation with the Golden Ratio. Contrary to the bull market, the bear market follows the 0.62 ratio which is the inverse of the Golden Ratio (1/1.618=0.62). We can also notice that the alternate relation between highs and lows is broken (high-low-low). (click image for larger view)

As we can see, every turning point has been predicted by the Golden Ratio for the last thirty years. The charts are showing that these turning points did not happen by coincidence but followed a precise Golden Ratio road map. This ratio can therefore also be used to project the next important market turning points.
On the following charts you can see a projection upon studying the tops and lows of the previous bull and bear markets. The entire leg up of the Cyclical Bull Market from the low on August 25, 1999 to the top on September 6, 2011, is pinpointing an important market turn date during the last week of January 2019.
(click image for larger view)

As for the Cyclical Bear Market from the 2011 high to the 2013 low, it is forecasting two possible turning points, as I also take into account the Inverse Golden Ratio which pinpointed the highs and lows of the previous bear market. We can see that the first turning point could happen during the first week of August 2014 (Golden Ratio) and the second one during the third week of May 2016 (Inverse Golden Ratio).
(click image for larger view)

If the Golden Ratio has an important role for the time period, my analyses on Gold prices also reveals that prices of both legs up of the Cyclical Bull Market and of both legs down of the Cyclical Bear Market are connected to the Golden Ratio 1.618.
The Correlation of Price is a little less accurate than the one for Time Duration but it is still very relevant. A measure move with round numbers of the first leg up and the second leg up of the Cyclical Bull Market presents that both legs up have a price ratio of 1.59 which is very close to 1.618. The two legs down of the bear market are also very close to the Golden Ratio (7 points less than 1.62).
(click image for larger view)

As all the major turning points were predicted by the Golden Ratio both in terms of Price and Time, we can also note that Gold Time Duration is well balanced. The second leg up of the bull market lasted three times less that the first leg up, whereas the second correction lasted three times longer than the first one. The dynamic symmetry is therefore completed. The geometry of Time Dimension has an important role in the market structure, as the market likes geometry both in Price and Time.
(click image for larger view)

The Golden Ratio has accurately predicted all the Gold major turning points these last thirty years and it seems reliable for making future projections. It is one of the techniques that can be used but the most important is to understand the structure and the rhythm of the market to forecast future developments not only in terms of the dimension of Price but also of the dimension of Time. Studying the history of the market is essential to bring superior returns.
LEGAL DISCLAIMER:

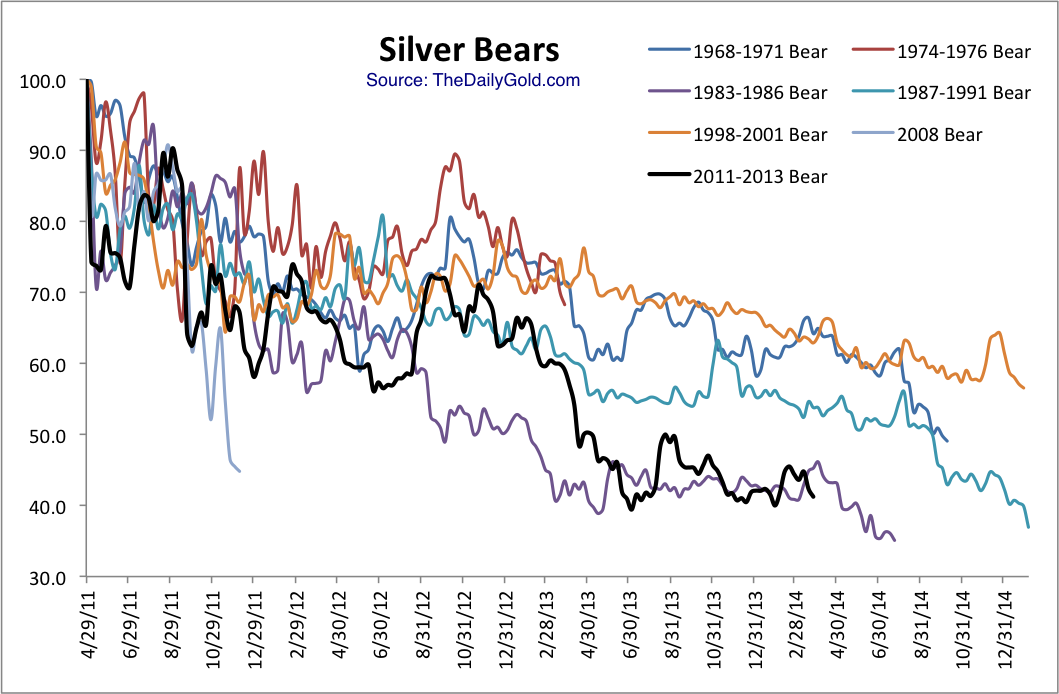
Silver has been in a bear market for almost three years and the recent lack of strength suggests the metal could be headed for new lows. New lows are always bearish until the last one. Our technical work suggests that we should watch for a final low and end to the bear market in the coming months.
This chart plots every major bear market in Silver dating back 45 years (excluding the 1980-1982 bubble bust). It plots them on the same time scale as the current bear market. Excluding the 1980-1982 bear market, we find that the current bear market is inline for being the worst bear market. It is already the fourth longest in time and close to the second worst in price. The current bear is very close to the 1983-1986 bear. This chart and the 1983-1986 bear suggest that if the current bear breaks to a new low then its final bottom could occur about one month later.
Silver has very strong trendline support on the daily chart around $17. If Silver breaks to a new low then it will run into this trendline support which dates back 11 years.
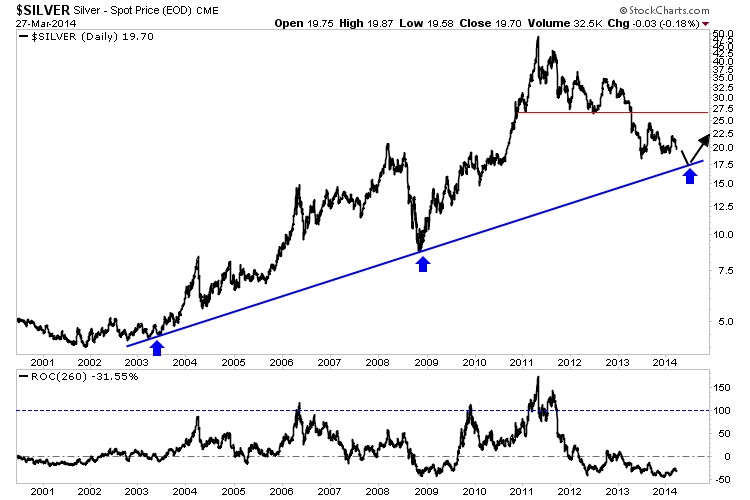
In the lower column we plot a 12-month rate of change for Silver. Note how it often reaches or comes close to 100%. After lows in 2003, 2005, 2008 and 2010 Silver gained 100% in a 12 month period. Moreover, following the 1983-1986 bear market which closely resembles the current bear, Silver rebounded 89% in 10 months. Following the 2008 low, Silver rebounded 84% in 11 months. Let’s say Silver bottoms at $17.50 and rebounds 70% in 12 months. That would take it to $30. That would create huge upside in most silver stocks.
Below is a chart of our proprietary silver producers index which contains 14 stocks and is partially weighted by market cap. It contains all of the large, important silver companies as well as junior producers. We didn’t just pick the 14 best. This index recently peaked at neckline resistance and just below the 80-week moving average. Note how the 80-week moving average marked resistance in early 2012 and late 2012. A new bull market will only be confirmed when this index is able to surpass that confluence of resistance.
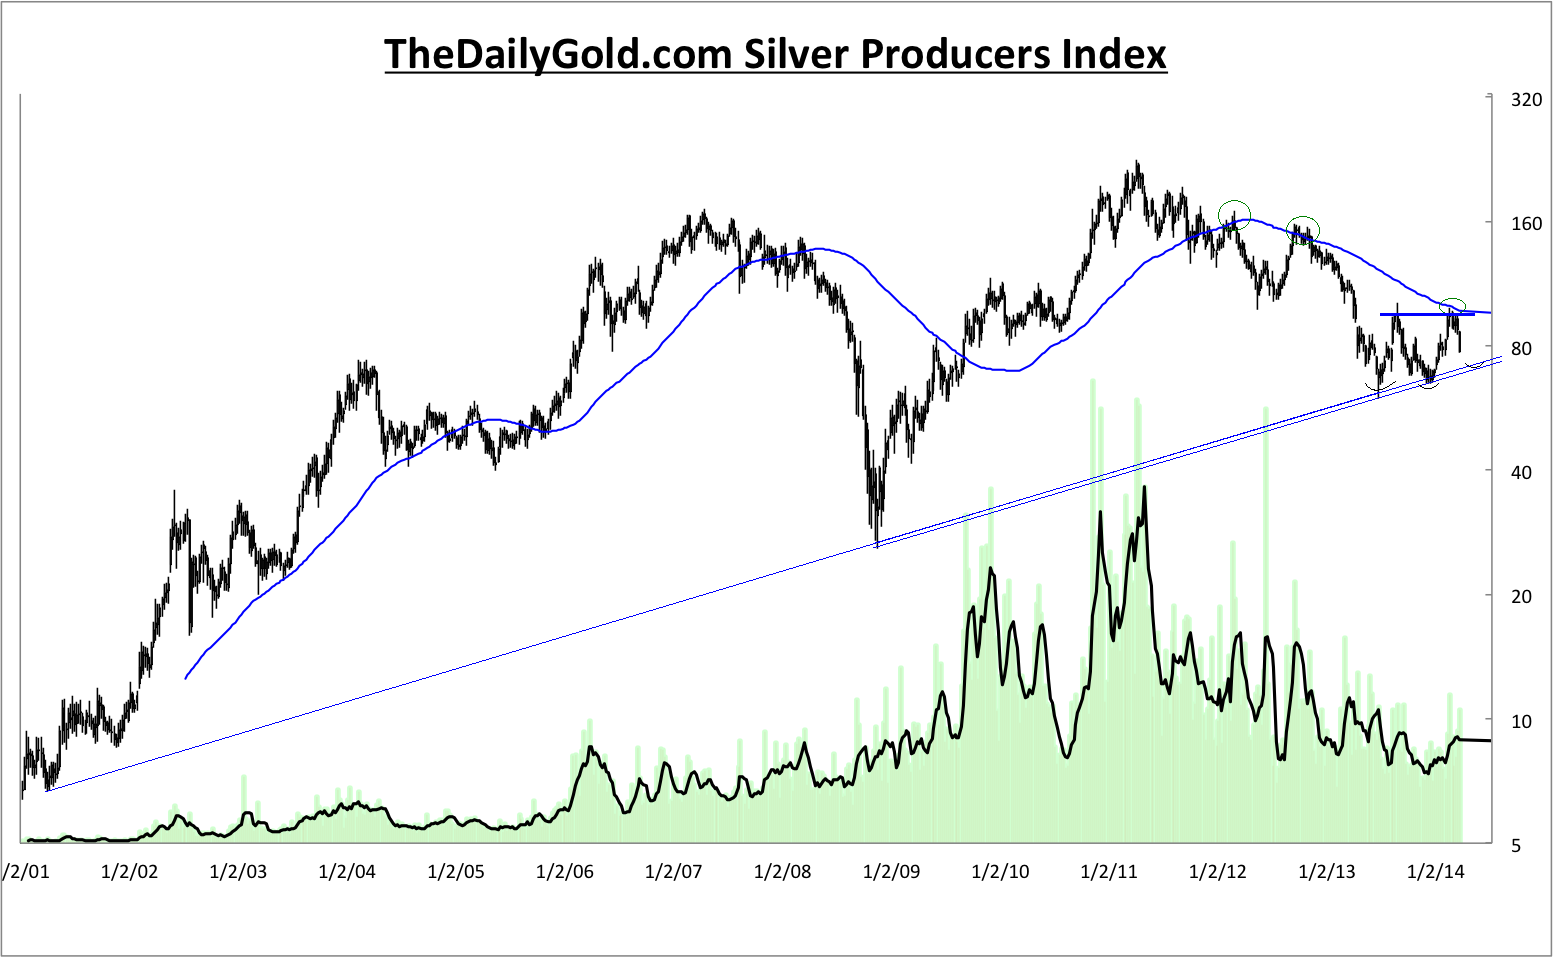
From a bird’s eye view, the bear market in Silver is just about over while the bear market in silver stocks probably is over as we don’t expect them to make a new low. However, the silver stocks won’t break resistance and confirm a new bull market until Silver has bottomed. Our analysis shows that Silver’s bear has a bit more to go in terms of price and time. We’ve laid out what we are looking for in Silver which is a new low and a bounce from 11-year trendline support. If that occurs at a time of extreme bearish sentiment then it is a buy signal. This prognosis, if correct means we have some time to research and patiently accumulate the best silver stocks which are positioned to benefit from a resumption of the secular bull market. If you’d be interested in learning about the companies poised to outperform, then we invite you to learn more about our service.
Good Luck!
Jordan Roy-Byrne, CMT

Briefly: In our opinion short speculative positions in gold (half), silver (half) and mining stocks (full) are justified from the risk/reward perspective.
The decline in the precious metals sector continues, as indicated in the previous alerts. Gold, silver and mining stocks have declined once again and appear to be headed lower also today. Did yesterday’s price action change anything? Let’s take a look (charts courtesy of http://stockcharts.com). Today we will start with silver and mining stocks.
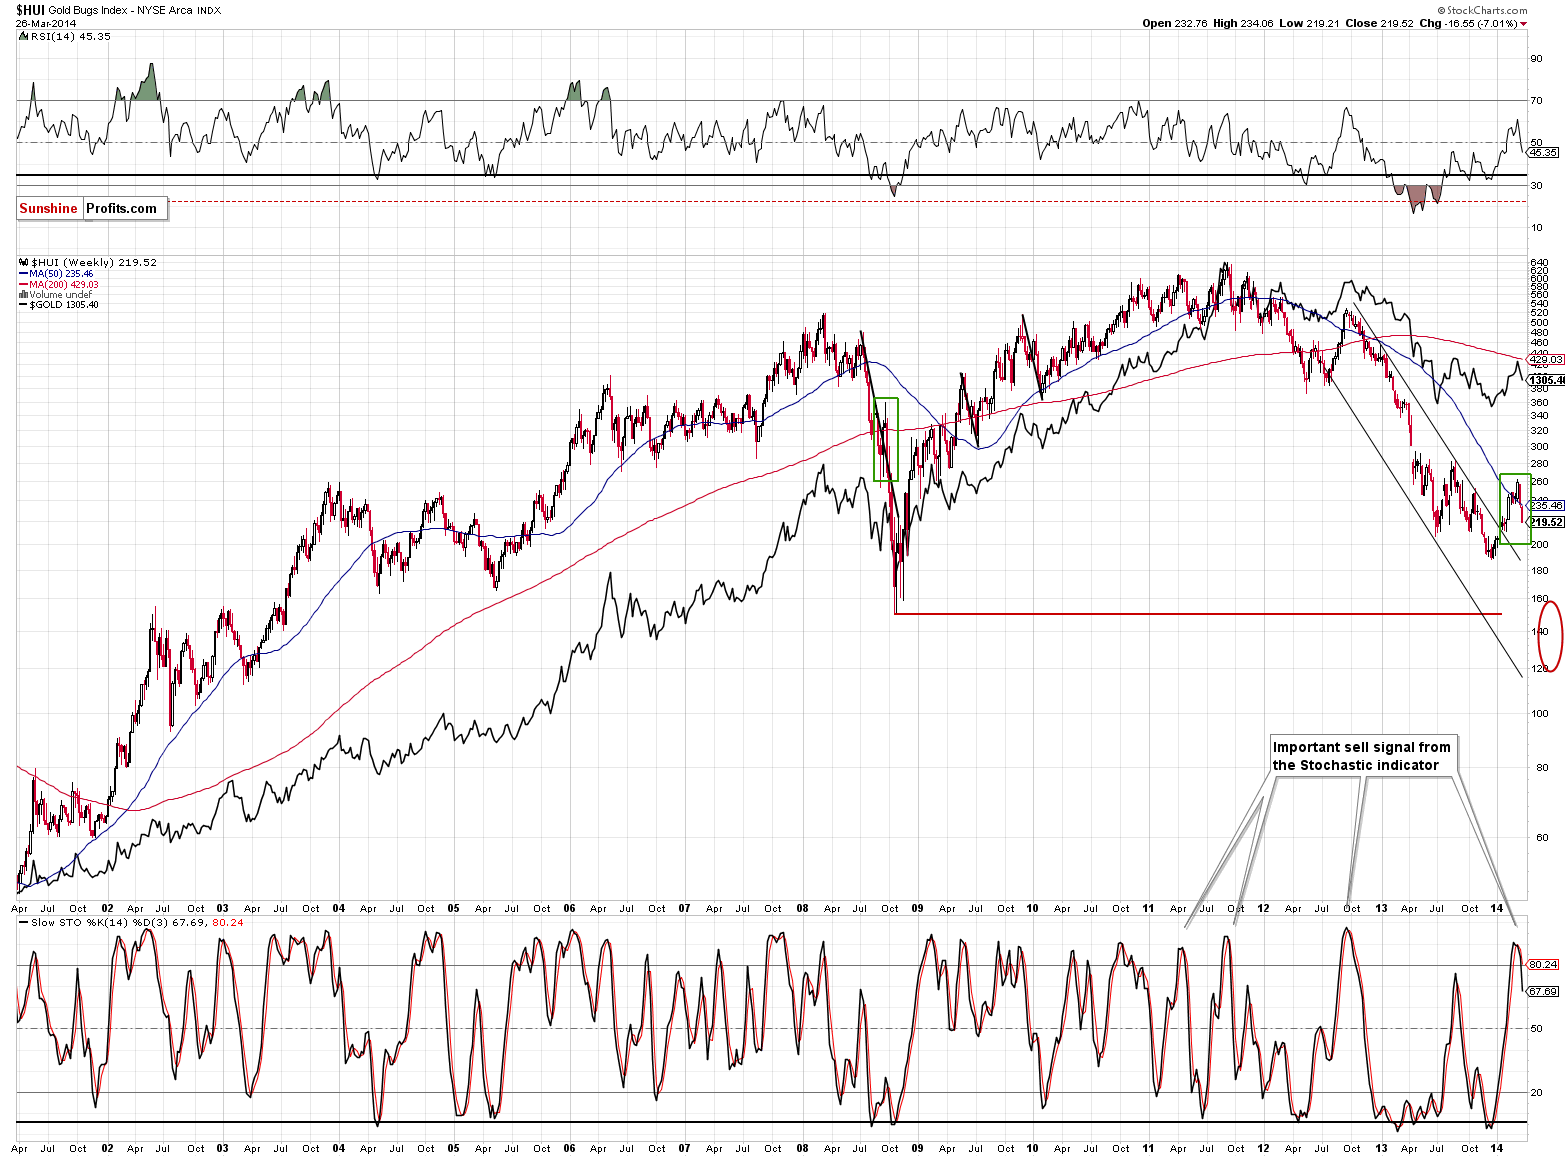
The reason that we’re starting with mining stocks is that definitely nothing changed in this picture. The situation was particularly bearish and still is. We saw another volatile drop yesterday. Actually, it might have been a little too volatile and a pause here would not surprise us.
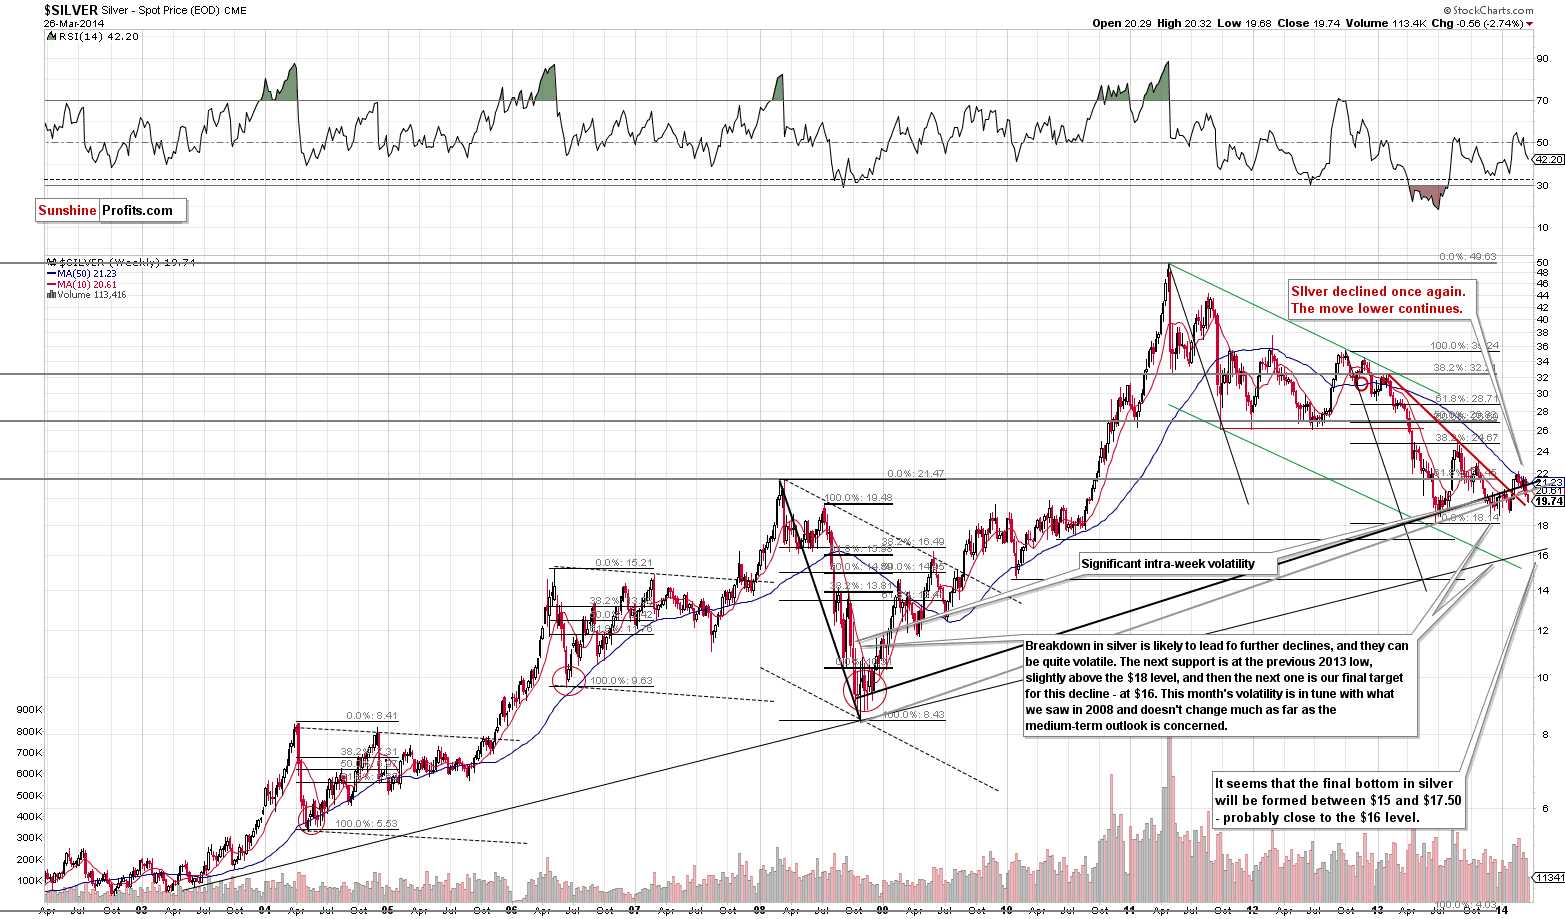
Silver is now well below the $20 level and appears to be ready to decline some more. After all, the breakdown below the rising long-term support lines has already been confirmed.
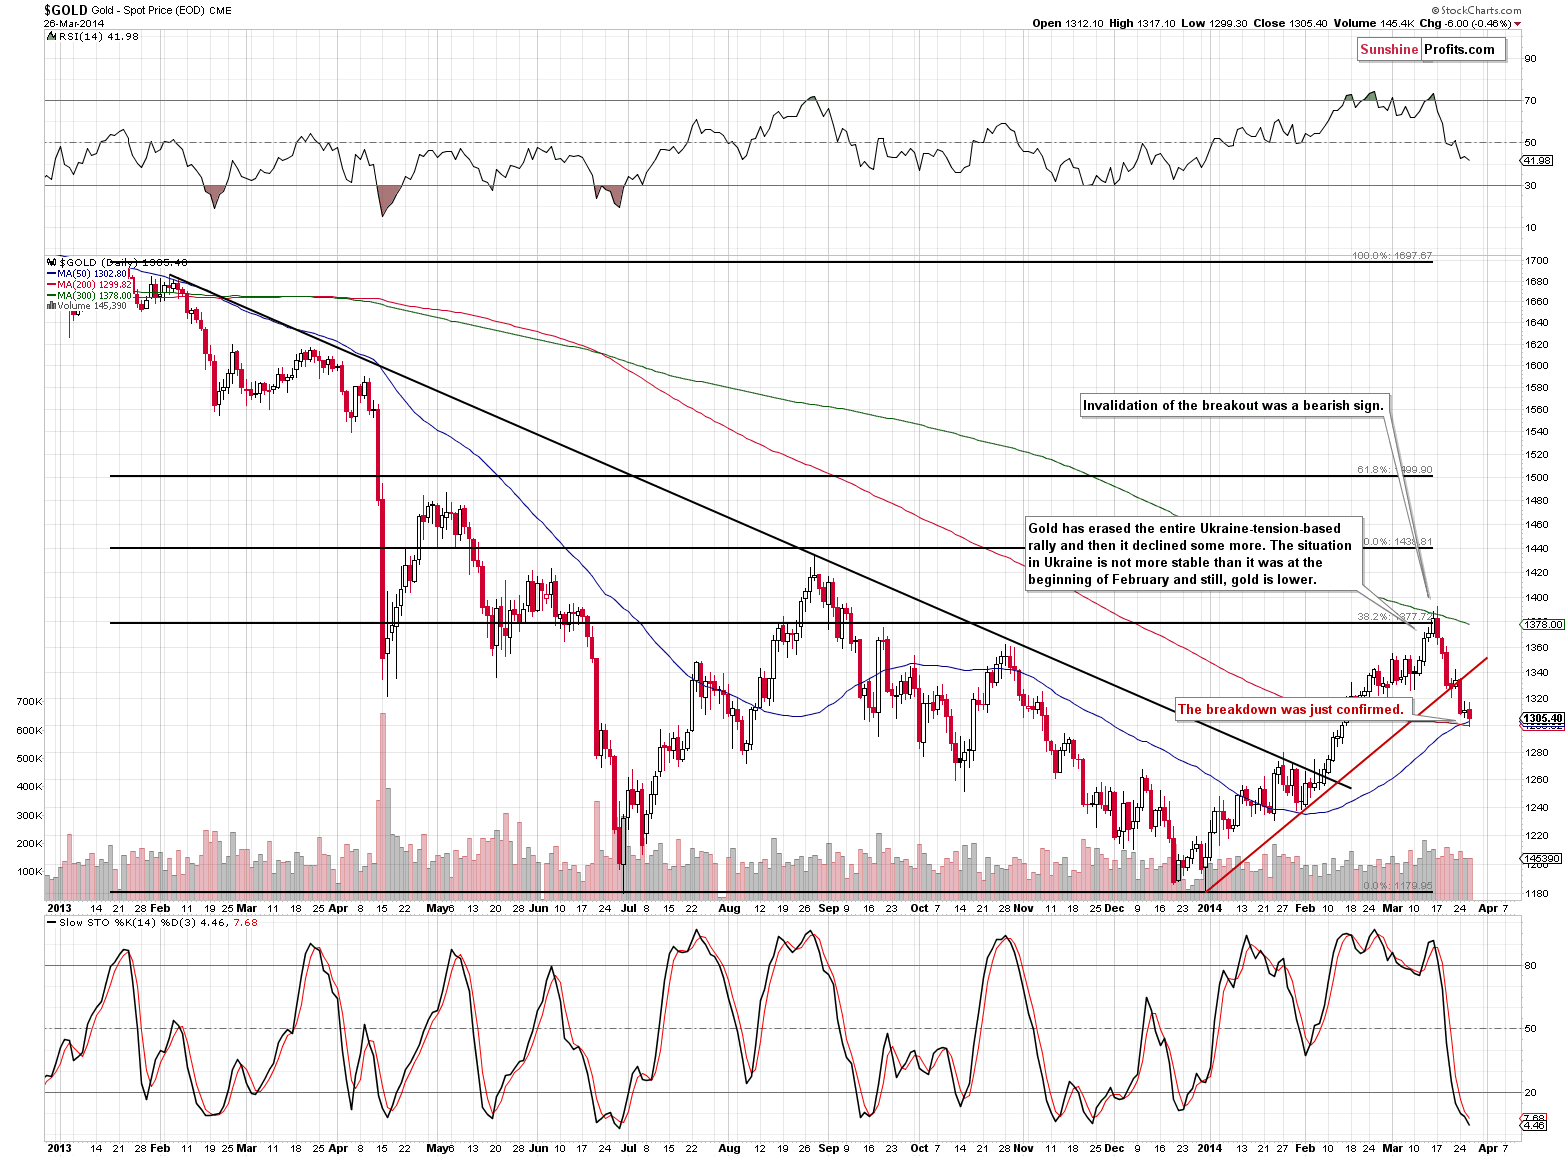
We previously commented on the gold market in the following way:

The situation in the USD Index supports the bearish case. The U.S. currency is after a short-term breakout, after a false breakdown below the rising medium-term support line and after a small consolidation. The USD Index simply looks ready to rally further. Since there has been negative correlation between precious metals and the USD Index recently, and now gold is even declining without the dollar’s help, we have a very bearish combination.
The precious metals sector appears to be likely to decline even without the U.S. dollar’s „help“, but it seems that it will receive this „help“ anyway.
Consequently, in our opinion the remaining half of the long-term investments in gold can be temporarily closed. Moreover, in our opinion a speculative short position in gold is also justified from the risk/reward perspective. We are also moving stop-loss orders lower as silver and miners are much lower than when we first outlined these positions.
To summarize:
Trading capital (our opinion): Short positions: gold (half), silver (half) and (full) mining stocks.
Stop-loss details:
– Gold: $1,342
– Silver: $20.85
– GDX ETF: $25.6
Long-term capital (our opinion): No positions
Insurance capital (our opinion): Full position
You will find details on our thoughts on gold portfolio structuring in the Key Insights section on our website.
Thank you.
Przemyslaw Radomski, CFA
Founder, Editor-in-chief
Tools for Effective Gold & Silver Investments – SunshineProfits.com
Tools für Effektives Gold- und Silber-Investment – SunshineProfits.DE
* * * * *
Disclaimer
All essays, research and information found above represent analyses and opinions of Przemyslaw Radomski, CFA and Sunshine Profits’ associates only. As such, it may prove wrong and be a subject to change without notice. Opinions and analyses were based on data available to authors of respective essays at the time of writing. Although the information provided above is based on careful research and sources that are believed to be accurate, Przemyslaw Radomski, CFA and his associates do not guarantee the accuracy or thoroughness of the data or information reported. The opinions published above are neither an offer nor a recommendation to purchase or sell any securities. Mr. Radomski is not a Registered Securities Advisor. By reading Przemyslaw Radomski’s, CFA reports you fully agree that he will not be held responsible or liable for any decisions you make regarding any information provided in these reports. Investing, trading and speculation in any financial markets may involve high risk of loss. Przemyslaw Radomski, CFA, Sunshine Profits’ employees and affiliates as well as members of their families may have a short or long position in any securities, including those mentioned in any of the reports or essays, and may make additional purchases and/or sales of those securities without notice.
We spent all of yesterday bumping along dirt roads on our way from the ranch to a small seminar organized by our old friend Doug Casey.
One of the major topics: What’s ahead for the gold price?
Here, in advance, we give our view.
Gold took off like a rocket at the start of the year. But despite rising global political tensions, and the Fed’s continuing economic pretensions, this week, gold started to look more like a discarded booster engine falling back to Earth.
We don’t know why gold rose so rapidly, but we have a good idea of why it fell…
Liquidity Moves Markets
First, investors discounted the political tensions.
Who really cares if Crimea is a part of Russia? Nobody.
Second, what has changed at the Fed? It continued to taper QE at its recent policy meeting. But by moving away from a fixed unemployment target to more “qualitative” measures, it reserves the right to take the taper off the table any time it wants.
As author of A New Depression: Breakdown of the Paper Money Economy, Richard Duncan, puts it, “Forward guidance is very nice, but it is liquidity that moves the markets.”
The Fed is providing plenty of liquidity. But this liquidity is going into risk assets, not into “anti-risk” assets. Stocks are a risk asset. Gold is not.
Most investors are confident the Yellen Fed has matters under control. They see US stocks going up and ask themselves: What’s to worry?
With nothing to worry about, and the memory of a 180% gain in S&P 500 fresh in their minds, why would they want to buy gold?
Third, the worry that usually moves gold most is inflation. It was that worry that sent it up 20 times in the 1970s… when consumer price inflation rose over 10%.
Consumer price inflation is not something that people are worried about now. And for good reason.
It’s the Money Supply, Stupid
As any economics professor will tell you, the CPI goes up when the quantity and velocity of money increases faster than the output of goods and services.
QE increases the monetary base (the sum of hard currency in circulation and banks’ reserve balances with the Fed). But it’s money supply (which also includes bank deposits and retail money market mutual fund shares) that matters when it comes to inflation.
But increases in the money supply depend on the creation of new bank deposits through new bank lending. And although money supply is growing, banks aren’t lending enough to make for a worrying increase in the quantity of money.
Meanwhile, the average household income is lower than it was when the recession ended in 2009. So, the average American has less money to spend. And under pressure, he is more careful about spending it, too. This decreases the speed with which cash changes hands in the economy – the velocity of money – putting more downward pressure on consumer price inflation.
What Next?
Gold investors see all this. They know consumer price inflation is not a problem right now (at least as it’s officially measured). They must wake up in the morning… check the CPI reading (just over 1% right now)… and go back to sleep.
The time will come, of course, when the CPI gets up and does the boogaloo. But not now. Here is what we see ahead for gold prices:
- The economy stays sluggish, but doesn’t go into reverse, and the Fed continues to taper.
- US stocks fall, as the Fed removes its support, causing the Fed to end the taper.
- US stocks recover, as the Fed wades in with more intervention, then fall more.
- The Fed panics and introduces more aggressive (money from helicopters?) moves.
- Gold soars.
More to come next week…
Regards,
Bill
Editor’s note: It may take a few years for the Fed to adopt more desperate monetary tactics… or it may happen much sooner than that. Fact is, “Economic Armageddon” is coming as a result of central bank meddling. The time to prepare is now. Follow this link to see how you can protect your savings.
A Bearish Move for Gold
From the desk of Chris Hunter, Editor-in-Chief, Bonner & Partners

As you can see from the area I’ve highlighted, gold has bearishly broken beneath its 50-day and 200-day moving averages.
In the space of just a week, the gold price fell 7%, to a six-week low… right after hitting a new high for 2014.
There are a number of possible reasons for the sudden fall in the gold price. But Janet Yellen’s comment last Friday that the Fed would consider raising the short-term interest rate six-months after it winds down QE… and the Fed’s removal of another $10 billion in stimulus… hasn’t helped.
Nor has weakness in the Chinese currency. China is the world’s No. 1 gold buyer. And with the renminbi down 2.5% against the US dollar this year, gold is more expensive to import for Chinese buyers.
Also, the lack of a serious escalation of tensions between Russia and Ukraine has stemmed investors’ desire for safe havens (although this could change at any time).
At Bonner & Partners, we don’t advise you trade in and out of gold. As Bill puts it, “Gold is real wealth.” It’s also “disaster insurance” against the collapse of the fiat money system.
We recommend you buy on the dips… and hold for the long term.
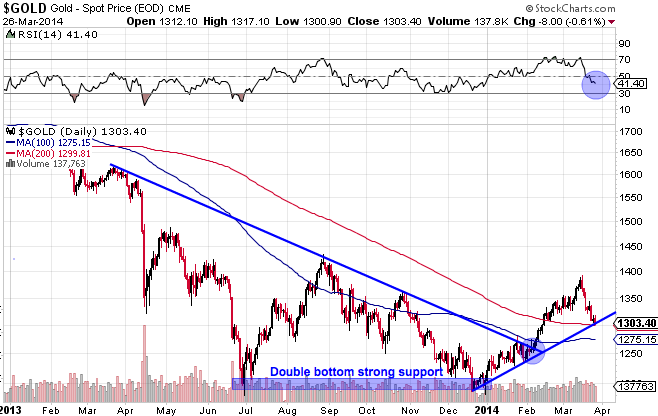
Gold and silver are testing key technical support levels this week. Some analysts have already flipped their outlook to bearish over the past few days, but I believe the uptrend remains intact as long as current support levels are not breached.
Goldman Sachs has predicted new lows for gold in 2014, but physical buying remains strong and precious metals represent a good safe haven during increasing political tensions worldwide. I also believe that precious metals are one of the only asset classes that remain undervalued at current levels. Stocks, real estate and just about everything else has climbed to unreasonable valuations by any number of measurements.
During late January, gold broke through resistance at the downward sloping trend line that had been in place for over year. This key breakout is circled in the chart below. A new uptrend support line was established starting in December and gold is now testing this support line at $1,300, also the 200-day moving average, for the second time.

-
I know Mike is a very solid investor and respect his opinions very much. So if he says pay attention to this or that - I will.
~ Dale G.
-
I've started managing my own investments so view Michael's site as a one-stop shop from which to get information and perspectives.
~ Dave E.
-
Michael offers easy reading, honest, common sense information that anyone can use in a practical manner.
~ der_al.
-
A sane voice in a scrambled investment world.
~ Ed R.
Inside Edge Pro Contributors

Greg Weldon

Josef Schachter

Tyler Bollhorn

Ryan Irvine

Paul Beattie

Martin Straith

Patrick Ceresna

Mark Leibovit

James Thorne

Victor Adair