
Gold & Precious Metals
There’s another bullish setup happening in the gold sector.
Yes… it pains me to write that as much as it does for you to read it. We’ve seen several bullish gold-stock setups fizzle out over the past year – including one from last November.
But that doesn’t mean we should ignore today’s setup. It just means we should be a little more patient and wait for the proper price action before making the trade.
Take a look at this chart of the Market Vectors Gold Miners Fund (GDX) plotted along with its 50-day moving average (DMA)…

The 50-DMA was a solid resistance level for GDX for nearly all of 2013. The only time GDX managed to get above its 50-DMA was in mid-August, after the Federal Open Market Committee surprised everyone by not tapering its quantitative easing program. Even then, the rally was short-lived. GDX dropped back down below its 50-DMA and has hardly attempted to challenge resistance since then.
Until now.
GDX has been in a low-level consolidation pattern for the past five weeks – bouncing back and forth between support at about $20.50 per share and resistance at about $22.30. That action has given the 50-DMA time to decline toward the resistance line of the consolidating pattern.
If GDX manages to pop above $22.50 per share, it will take out both the resistance line of the pattern and the longer-term resistance of the 50-DMA. This should be enough to kick off at least a short-term rally in the gold sector.
Traders can buy GDX on a move above the 50-DMA and then look to take profits as GDX approaches the next resistance line near $26.50.
Best regards and good trading,
Jeff Clark

While many analysts on Wall Street forecast gold to head lower in 2014, they fail to realize that its historic ratio to oil points to a much higher price. It seems like everything today is based on financial wizardry rather than fundamentals of a physical economy.
The economy has moved so far away from the fundamentals that it no longer has any idea how to function without total market rigging. The Fed and central banks believe they can continue to control the markets, however the weight of all that paper crap will overwhelm them at some point in time.
I recently wrote the article, Silver To Hit New Highs As The Quality Of Analysis Sinks To New Lows. In the article I provided information on how the historic Oil-Silver Ratio would relate to a much higher price of silver today.
For example, the price of silver would be $92.67 today based on the average Oil-Silver ratio during 1961-1970. For quick reference here is the table from the article:
Present Silver Value At Prior Silver-Oil Ratios (based on $111.30 Brent crude oil)
1981-2000 (3.8 ratio) = $29.30
1971-1980 (2.1 ratio) = $52.95
1961-1970 (1.2 ratio) = $92.67
Some of my readers asked me how the historic Gold-Oil ratio would impact the price of gold today. So I decided to look at the data and put this article together.
From 1961-1970 the price of gold behaved similar to silver — basically flat compared to price of oil. Of course this was due to the fact that the Fed & Central Banks had to manipulate the gold market through the London Gold Pool to keep the price fixed at $35 an ounce.
However, the London Gold Pool fiasco started to get into trouble by the end of the decade as the price of gold increased to $41.39 in 1969… shown in the chart below:

If we consider the average Gold-Oil ratio for 1960’s decade it was 20 to 1. Which means one ounce of gold could buy 20 barrels of oil when gold was still functioning as a monetary metal.
After Nixon dropped the Dollar-Gold peg in 1971, all hell started to break loose in the gold market as the price of the yellow metal shot up to $97.32 by 1973. You will notice that the Gold-Oil ratio increased substantially in 1973 compared to 1971.
The reason for this was due to the fact that the price of gold (1971-$40.80, 1973-$97.32) increased to a much larger degree than oil (1971-$2.24, 1973-$3.29). This is shown in the next below:

As the price of oil nearly quadrupled in 1974 to $11.58 from the impact of the Arab Oil Embargo, the Gold-Oil ratio fell to 13.8. Even though the price of gold declined a bit in 1976, it moved higher in tandem with the price of oil by the end of the decade.
After the Dollar was no longer pegged to gold, the average Gold-Oil ratio during 1971-1980 declined to 15.9 compared to 20 in the previous decade.
When I crunched the numbers for the Gold-Oil ratio for the years 1981-2000, I was quite surprised that the average was higher than the previous time period.

You will notice that from 1986 to 1999, the gold price trend line was above the oil price line. Thus, we had very high Gold-Oil ratios during this time period.
The reason for the lower price of oil is that several new large fields came online. We had the North Sea Oil Field come into production, Alaska Prudhoe Bay and a ramp up of the Gulf of Mexico.
Interestingly, gold was valued higher to oil than I assumed… even higher than the 1971-1980 time period when it reached a record of $850 an ounce.
The lower price of oil is what pushed the average Gold-Oil ratio higher to 18.6 in 1981-2000 compared to 15.9 in the prior time period.
Now… let’s look at what took place since 2000. Here we can see a few noticeable trends. First, during the majority of this time period, the oil price line was higher than gold. Second, the average Gold-Oil ratio is much lower than in any of the previous time periods.

If we disregard the 2009 Gold-Oil ratio as it was a huge anomaly and focus on 2010 and 2012, the price of gold valued in oil terms was at its highest. Furthermore, even though the price of gold hit a record in 2011, the average price of gold was 2012 was higher.
Average Gold Price
2010 = $1,225
2011 = $1,572
2012 = $1,669
2013 = $1,411
So, when the price of gold was attempting to break-out above $1,800 in September of 2012 and surpass its 15 to 1 Gold-Oil ratio, the Fed & member banks came into the markets and decided enough was enough (shown by the nice Red Arrow).
This was also true with Silver:

(NOTE: the chart should read Oil-Silver ratio)
An interesting factor as it pertains to energy and gold can be seen in the table below. I have been compiling data for diesel consumption in the top gold miners. Not only is the amount of diesel consumption per ounce of gold produced increasing… so is the price of diesel.

The majority of the diesel used by these mining companies is in the extraction of the gold ore. A small percentage of overall diesel consumption is used in construction of mine sites as well as a source of electric generation in remote locations when electricity is not available.
In 2010, the top 5 gold miners produced 24.7 million oz of gold consuming 18.7 gallons of diesel per ounce to do so. If we go by the U.S. price of a gallon of diesel in 2010 ($2.99), these top gold miners spent $1.38 billion for this fuel cost. Thus, it took approximately $55.91 in diesel-fuel costs per ounce of gold to extract the ore.
If we make some conservative assumptions based on past trends, the estimated cost of diesel to extract gold in 2013 will more than double to $113.68 an ounce. This is quite interesting once we consider that the current price of gold is $1,227 compared to the average of $1,224 in 2010.
The figures in the table are used as a form of reference. Diesel prices throughout the world are higher or lower than the average shown in the U.S., but, at least it gives us a basic idea of just how much fuel costs are rising in the production of gold.
The gold miners are consuming more energy than ever to produce gold today, however Wall Street believes the price of gold needs to fall below $1,000 in 2014. So it goes… as Wall Street becomes more insane, so do the markets.
Getting back to the Gold-Oil ratios, let’s look at what the gold price would be today based on the past ratios:
Present Gold Value At Prior Gold-Oil Ratios (based on $111.70 Brent crude oil)
1981-2000 (18.6 ratio) = $2078
1971-1980 (15.9 ratio) = $1,776
1961-1970 (20.0 ratio) = $2,234
If we go by the 1961-1970 historic Gold-Oil ratio when gold was a monetary metal, than the price of gold would be worth $2,234 today. Of course this does not consider all the other factors such as the upcoming collapse of the global fiat currency system, U.S. Treasury Market and the majority of paper assets.
With the current price of Brent crude at $110 and gold at $1227, the Gold-Oil ratio is 11.1, lower than the 12.6 average for 2013 and 11.6 average for the decade.
As the Fed & Wall Street continue to delude the public that the proper value for the price of gold is to head lower, the energy fundamentals are pointing to a much higher figure. Financialization and Bull Excrement rule the day in the economy.
Fortunately, those few who still adhere to the fundamentals will benefit tremendously when the $100’s of trillions of paper claims falls under the weight of Newton’s Law of Gravity.
At the SRSrocco Report, we will be releasing some Reports in the future on various subjects. However, one Report will focus on the coming Economic Collapse including what I believe is a Bomb Shell to precious metal community.

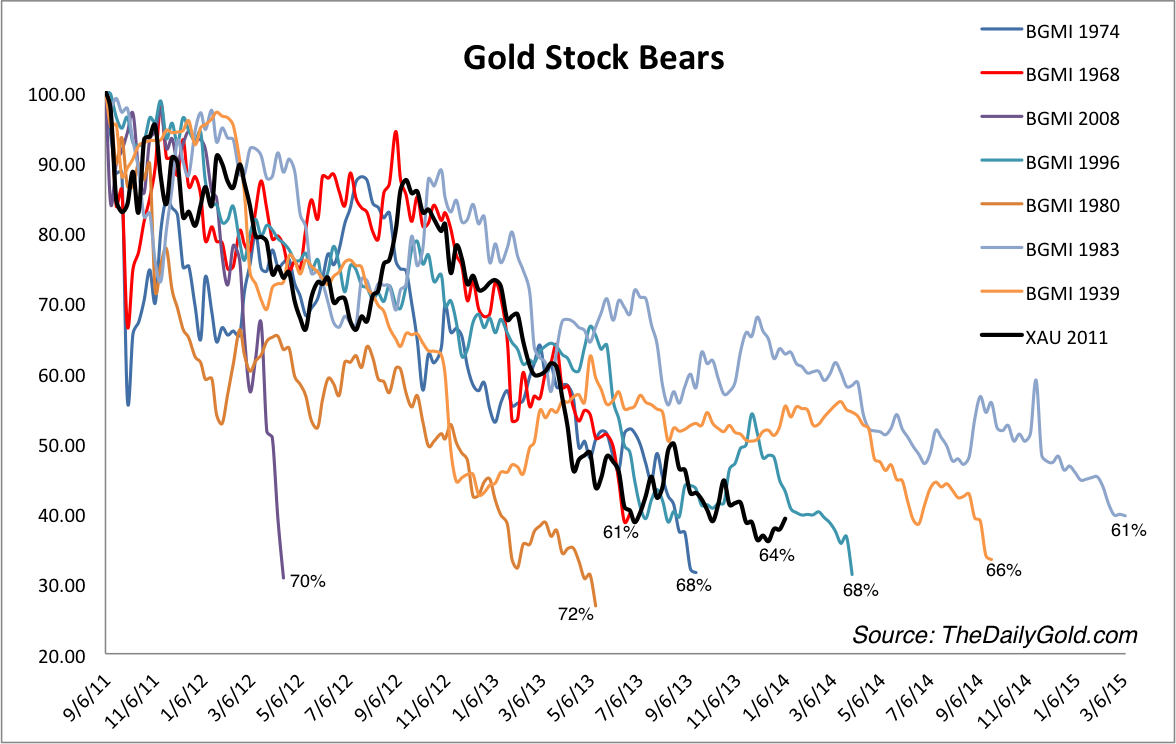
In early November we turned bearish on the precious metals with the expectation that the sector was about to begin a final plunge that would lead to a V shaped bottom. In our last editorial, we asserted that the bear market was in its final throes. Interestingly, the plunge in precious metals stocks may have ended in early December. Over the past several weeks the gold and silver stocks failed to break lower despite the negative sentiment and the prevalence of tax loss selling. While we aren’t sure if Gold has bottomed, we think odds are strong that the stocks have bottomed.
Our strongest argument is our bread and butter chart which displays all of the worst bear market in gold stocks. The current bear market is already the fourth longest and deep enough (64%) to be over. As we’ve previously noted, the three bears that lasted longer were only mildly oversold at this point in time.
Click HERE or on Chart for larger image:
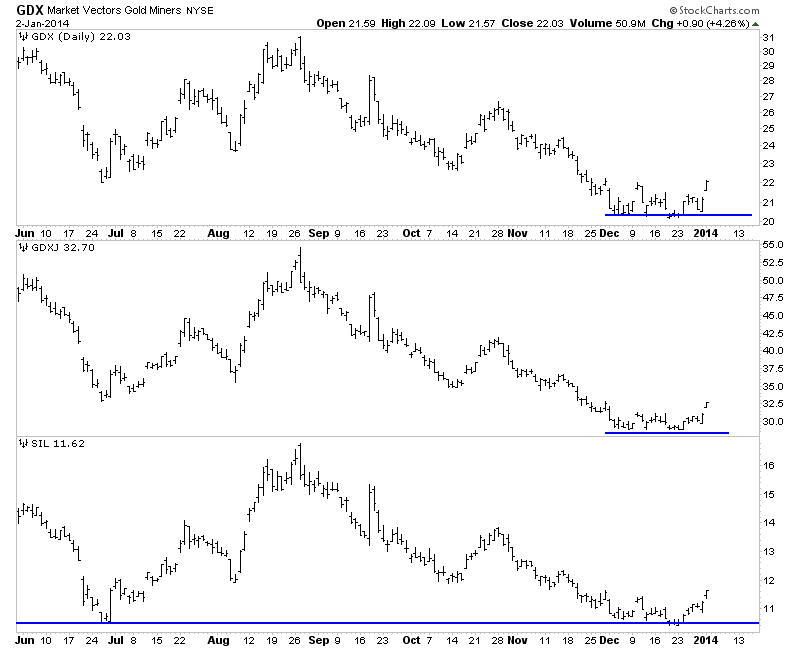
Next we show a plot of GDX, GDXJ and SIL. GDX and GDXJ made new lows at the start of December, tried to break lower several times and failed. Note that the silver stocks did not break below their June low despite three tests of that support in December.
Click HERE or on Chart for larger image:
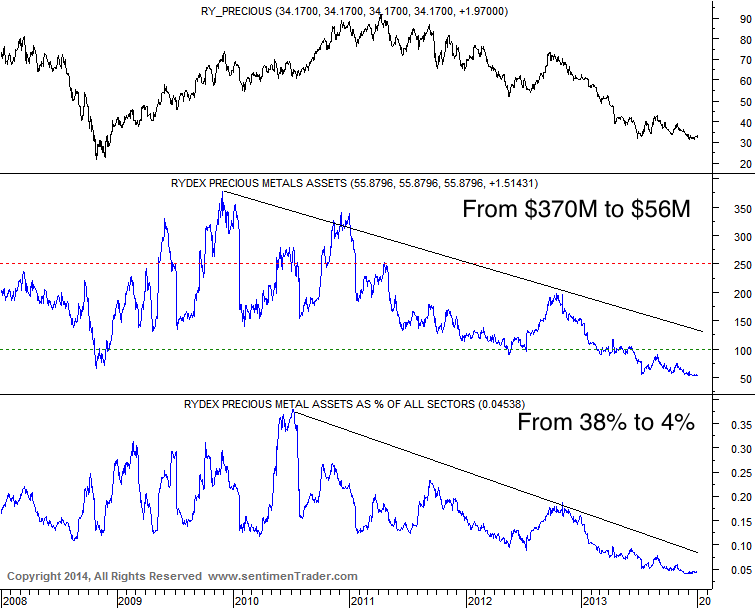
We know that sentiment towards this sector is off the charts negative. The chart below of the Rydex Precious Metals fund is from SentimenTrader.com Assets in the fund have dwindled by 85%. As a percentage of all Rydex fund assets, assets in the fund declined from 38% to now 4%.
Click HERE or on image for larger view:
Heading into December the gold and silver stocks, which were already extremely oversold and hated, were in position for a final plunge. The HUI had major support at 170-175 yet repeatedly failed to close below 190 throughout December, which was ripe for tax loss selling. When an extremely oversold and hated market fails to sustain a new low, we should take notice.
With regards to the metals, Silver has yet to make a new low while Gold made a new closing low before Christmas but reversed back above $1200. I wouldn’t rule out a new low in Gold. During the 2000-2001 major bottom gold shares bottomed in November while Gold bottomed a few months later in 2001. Gold shares led Gold down and Silver in 2011 peaked four months before Gold. Silver also bottomed before Gold during the 1976 bottom. It wouldn’t be a surprise for Gold to bottom last. The bottom line is the action in the stocks is very encouraging with respect to a recovery in the entire sector. In fact, most quality producers and juniors bottomed in June and have not made new lows. If you’d be interested in learning about the companies poised to rocket out of this bottom then we invite you to learn more about our service.
Good Luck!
Jordan Roy-Byrne, CMT
About Jordan Roy-Byrne, CMT
Jordan Roy-Byrne, CMT is the editor and publisher of The Daily Gold.
When asked of the investment philosophy which resulted in him becoming a billionaire, Eric explained that:
“You have to be a buyer when people are non-believers. You have to believe in something based on data that says you’re right when the world will tell you you’re wrong, because when the world says you’re wrong and you’re right, you know that the return will be outsized because no one is there. It’s like buying gold stocks in 2000 which I did to a very large extent. The HUI index was at 35 and it went to over 600. It went up 1700% in eight years. And that’s because everyone was against it. It was like a killing field for an investor to go in and I really believe it’s kind of [a similar] opportunity again today.”

Ed Note: This quotation came via Mark Leibovit and his LEIBOVIT VR GOLD LETTER – JANUARY 2, 2014
Gold’s been frustrating, to say the least. Plus, its characteristics changed in September.
WEAK SIGNS
Gold failed to rise during its best seasonal time, and when the dollar was declining. These factors alone were bearish signs.
In addition, gold jewelry demand was the highest since 2010 in the third quarter, when buyers in Hong Kong and China pushed demand up 40% and 35%.
It’s also reported that American Eagle silver coin sales are up at the U.S. Mint, while gold sales are up at the Perth Mint.
You’d think the prices would be up on this robust demand for physical gold and silver, but they’re not.
FIRST BAD YEAR SINCE 2000
Investors are loving to hate gold. Hedge funds are the least bullish since 2007. Some investors missed the whole bull market and are now happy to see gold tossed aside.
With each passing month, the bearish barometer continues to rise. But amazingly, gold is not breaking below the June lows easily.
It’s been six months now since gold hit $1180 intraday in June. And it’s recently been testing these lows.
Will it hold? …. That’s the million dollar question.
AT CRITICAL JUNCTURE
First of all, if the $1180 low is broken, then the intermediate phases will have clearly turned bearish on Chart 1, which shows one of our favorite indicators.

We call the June 2013 low, a D low. This is when gold falls the worst during a bull or bear market. An A rise and B decline then follow.
The latest A rise was fine when gold rose to its late August high near $1420, gaining about 18%. This was normal.
The B decline has been underway since then. This 16% decline has lasted over three months and it’s a bigger B decline than normal, but it’s still okay.
But, if gold now stays below $1330 and falls below $1180, this B decline is off, and the bear will clearly take over. We could then see $1000 gold, eventually.
So we are very close to the time of truth.
Mary Anne & Pamela Aden are well known analysts and editors of The Aden Forecast, a market newsletter providing specific forecasts and recommendations on gold, stocks, interest rates and the other major markets. For more information, go to www.adenforecast.com
Aden_Forecast Archive

-
I know Mike is a very solid investor and respect his opinions very much. So if he says pay attention to this or that - I will.
~ Dale G.
-
I've started managing my own investments so view Michael's site as a one-stop shop from which to get information and perspectives.
~ Dave E.
-
Michael offers easy reading, honest, common sense information that anyone can use in a practical manner.
~ der_al.
-
A sane voice in a scrambled investment world.
~ Ed R.
Inside Edge Pro Contributors

Greg Weldon

Josef Schachter

Tyler Bollhorn

Ryan Irvine

Paul Beattie

Martin Straith

Patrick Ceresna

Mark Leibovit

James Thorne

Victor Adair