Gold & Precious Metals

July 31, 2018 

1.  Under Trump, it can be argued that the US economy (which is separate from the Wall Street casino) is experiencing a degree of normalization.  

2.  Top economists give him credit for corporate tax cuts and deregulation.  At the same time, the US central bank is also pursuing a policy of normalization that began with Yellen.

3.  As I predicted, this normalization has seen the stock market begin a topping process while inflationary pressures become more evident.  This topping process will now accelerate, as will the inflationary pressures.

4.  Please click here now. Double-click to enlarge this disturbing weekly Nasdaq100 index chart.

5.  Note the ugly non-confirmation taking place between the RSI oscillator and the price.  For decades I’ve urged investors to hedge themselves or sell as the US stock market “crash season” begins at the start of August.  It lasts until the end of October, and I recommend rebuying then.  Please click here now.  As stock market heavyweight Mike Wilson notes in his interview yesterday, the US stock market selling has just begun! 

6.   While US stock markets are set to swoon and perhaps crash, the rise of China/India and the normalization of America is producing a new era for gold. The wild fear trade of the past is being superseded by a theme of general respect for the asset.

7.   Chinese and Indian gold investors do invest in the global fear trade for gold.  That’s a big part of why they buy, but their understanding of gold is highly refined.  Their analysis is wise and subtle. 

8.   The growing dominance of Chindians in the market is producing a much calmer investing experience for Western investors who are feeling this wonderful golden vibe! 

9.   Please click here now.  Next, please click here now. Out with the old (fear trade of the West), and in with the new (love trade demand of the East)! 

10.   To Vanguard’s credit, I will note that it is restructuring its fund to gain exposure to the general equity markets, but with a commodity-oriented theme.

11.  Official Indian imports would be over 1000 tons for fiscal 2018 if the rupee had not been temporarily derailed.  If free (black) market demand is included, the total imports are probably in the 1200 – 1300 tons area.  

12.   Please click here now. It’s a bird!  It’s a plane!  It’s the gold bull era’s superman!  Since being appointed as “interim” finance minister of India, Piyush Goyal is pumping out so many pro-citizen and pro-business tweets and announcements that he makes Donald Trump look like a turtle swimming through a pool of end of empire molasses, and Trump himself can be considered a pro-business racehorse!

13.   If Goyal continues to reduce the drag of government on citizens and businesses, my prediction that India will hit 10% GDP growth and 1500 tons of total annual gold demand in the next 18 months will likely become a “done deal”.

14.  To view what may be the world’s most important chart, please click here now. Double-click to enlarge.  Gold stocks have surged against gold and held their ground against US fiat while bullion has fallen about $170 an ounce!

15.  While earnings, AISC, and cash flow numbers have turned negative for many gold miners, most of them continue to look good against gold and are holding their recent lows against the dollar.  

16.  GDX would likely be trading around $10 a share right now if institutions were buying or selling just based on earnings and other financial reports about the component companies.

17.  Please click here now. Why is this strange price action happening?  Why is GDX trading above its February low even though gold has moved so much lower?

18.  Well, the most reasonable explanation is that savvy institutional power players are looking beyond the short term earning hits.  They are focusing on the rise in inflation in the West.  

19.  This interesting gold market action is occurring just as the horrific action of the main US stock market sectors begin to suggest that general equities are already in a rolling bear market and poised to begin something much more sinister.  

20.  The US stock market could soon become an inflation-oriented quagmire that would greatly resemble the markets of the 1970s.

21.  Please click here now. Double-click to enlarge this gold chart.  Gold is oversold, but the 14,3,3 Stochastics series is flatlining. 

22.  This tends to happen when investor sentiment becomes weak but physical demand in China and India has yet to strengthen.  It creates an incentive for smart commercial traders on the COMEX to cover short positions but not to buy many longs.

23.  Please click here now. Double-click to enlarge another great gold chart.  From both a fundamental and technical perspective, nothing is happening in the gold market that is unexpected.  

24.  If the current gold price sale ends in the $1200 – $1180 area it would give the right side of the huge inverse head and shoulders pattern almost perfect symmetry with the left side.  The personnel changes in India’s finance ministry and the rise of inflation in America (as the stock market peaks) are fundamentally in tune with the big picture technical action for gold.  A joyous bull era is poised to begin, with good times for all gold investors!

 Thanks

Cheers

St  

Stewart Thomson  

Graceland Updates 

Note: We are privacy oriented.  We accept cheques, credit card, and if needed, PayPal.

Written between 4am-7am.  5-6 issues per week.  Emailed at aprox 9am daily.

https://gracelandjuniors.com     

www.guswinger.com   

Email: 

stewart@gracelandupdates.com  

Stewart Thomson is a retired Merrill Lynch broker. Stewart writes the Graceland Updates daily between 4am-7am. They are sent out around 8am-9am. The newsletter is attractively priced and the format is a unique numbered point form.  Giving clarity of each point and saving valuable reading time.

The last time we saw this gold skyrocketed $300!

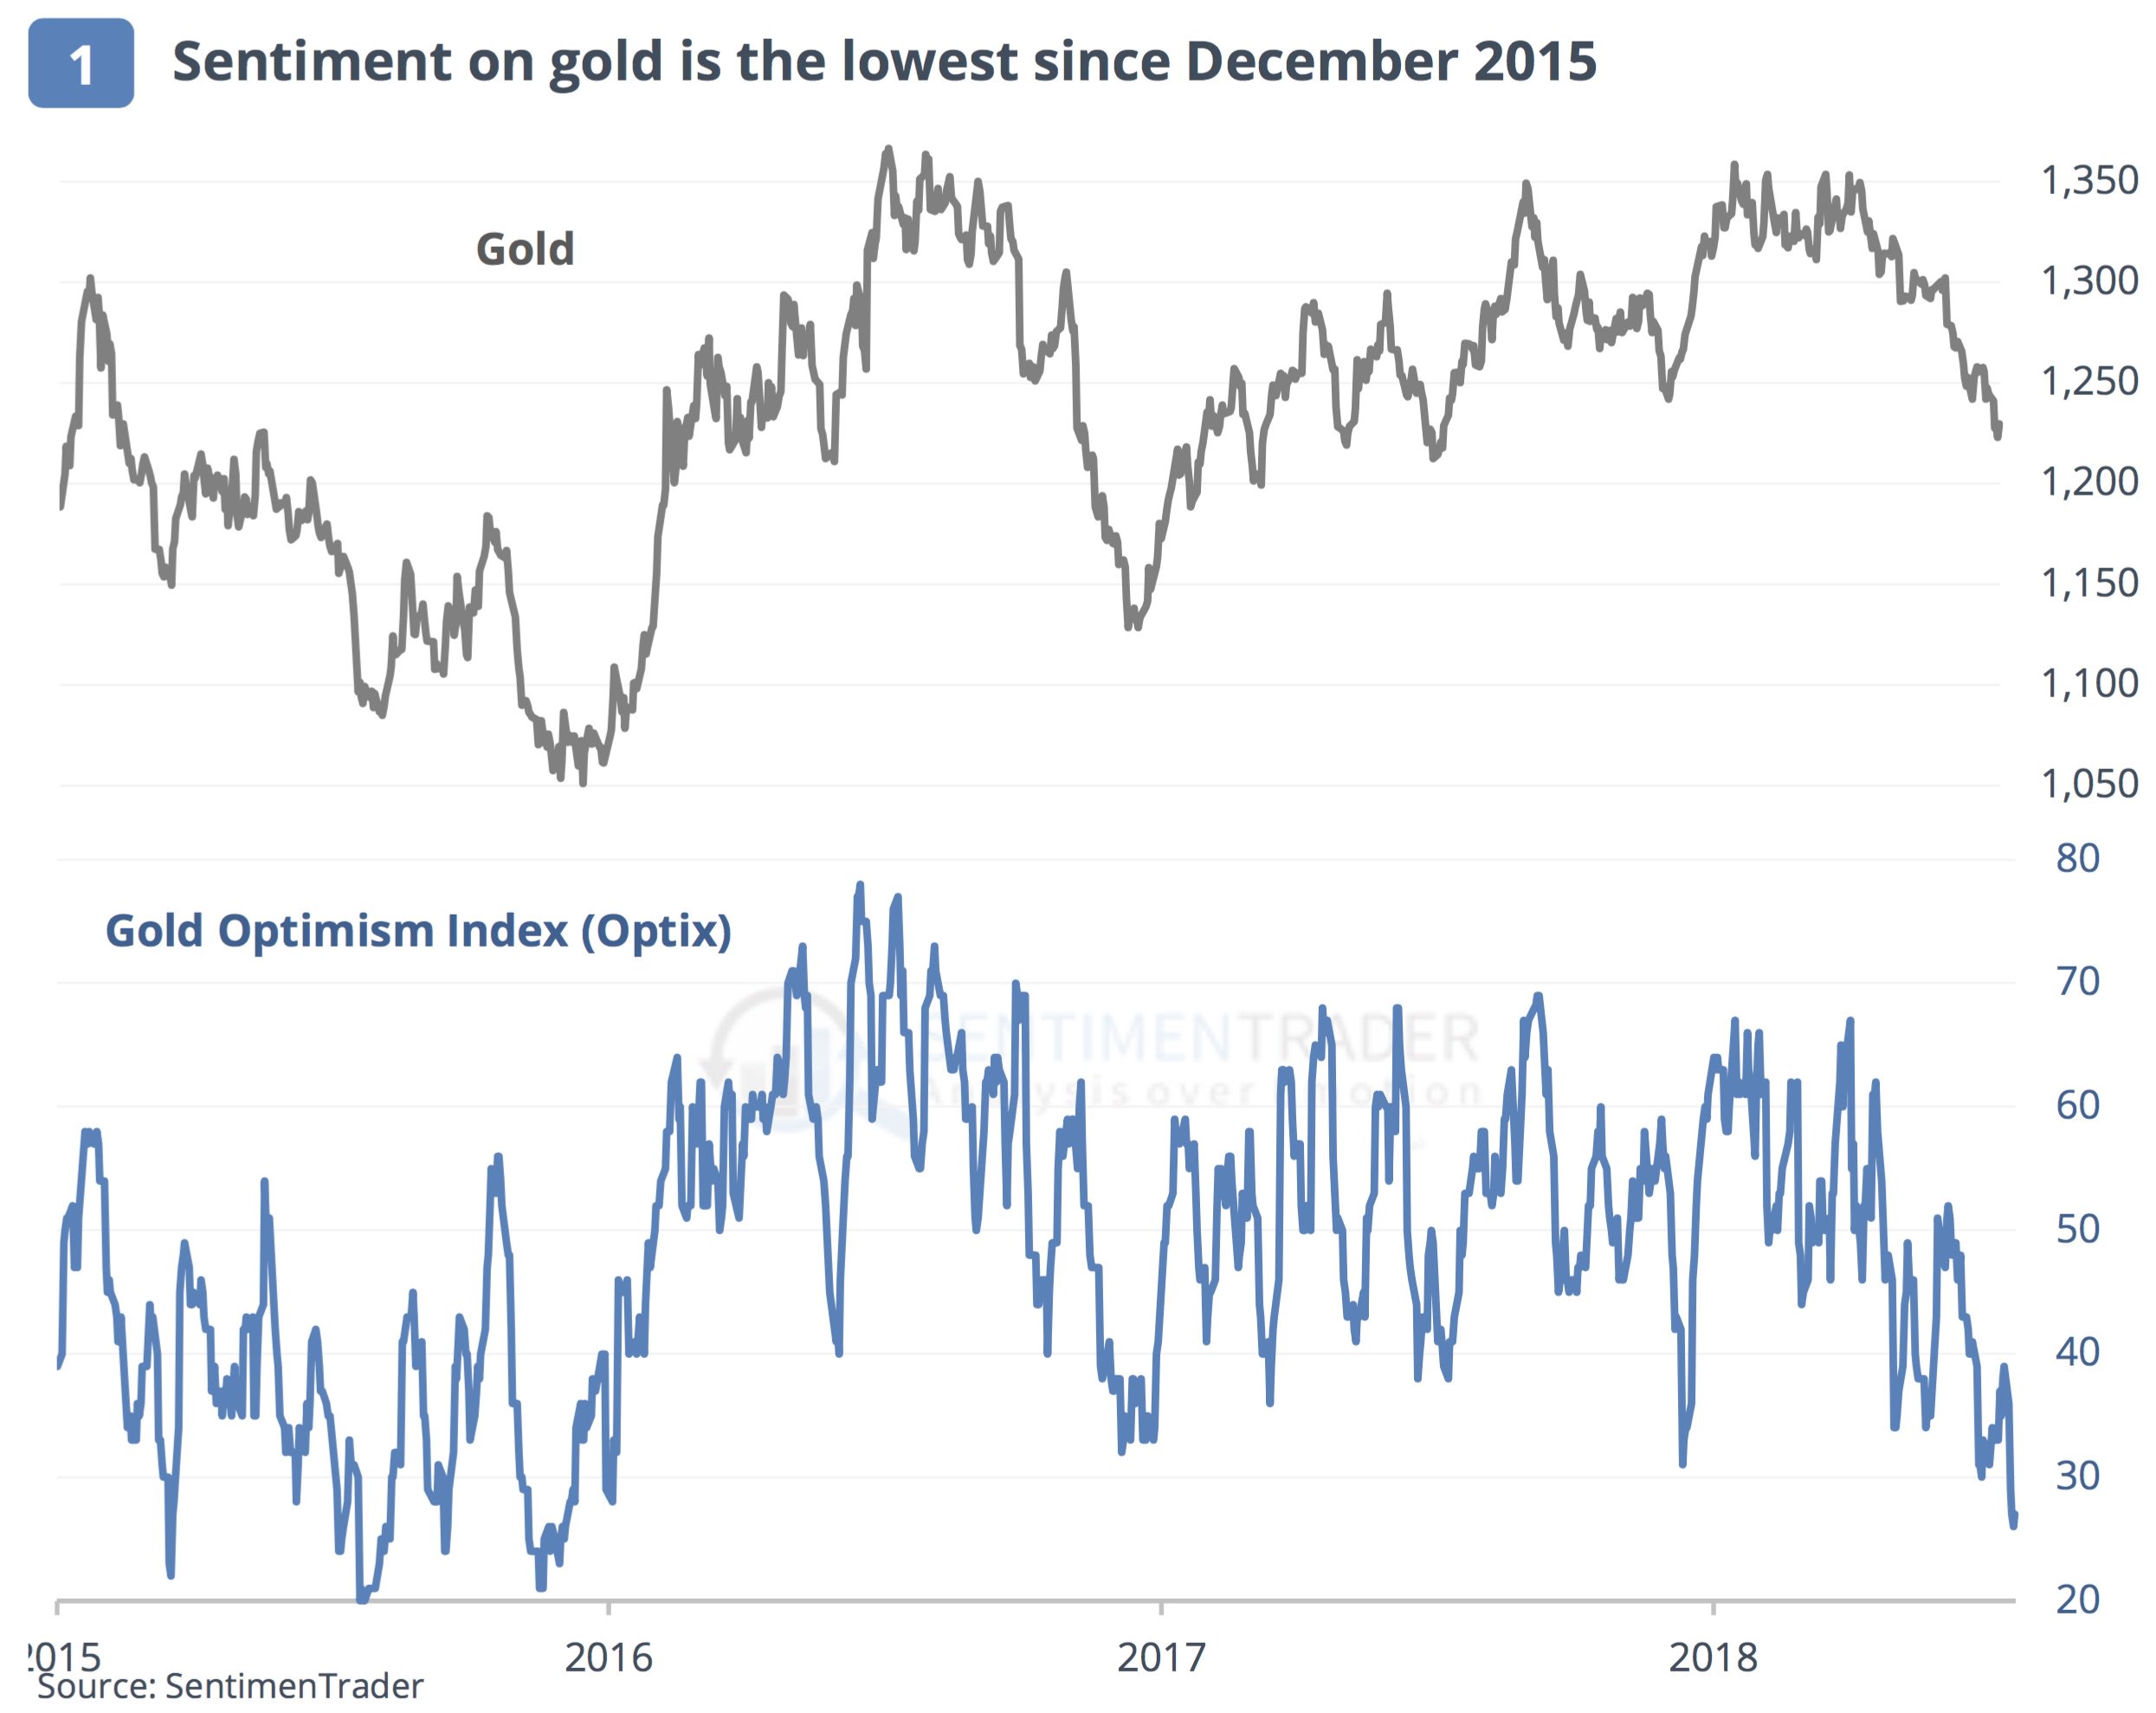
Here is a special update on the gold market from Jason Goepfert at SentimenTrader:  Optimism on gold dropped to one of its lowest levels in its 7-year bear market, and the lowest since December 2015. When holding through all days when sentiment was this low, gold’s returns over the next few months were excellent, especially the risk/reward…

KWN-SentimenTrader-I-7242018

….read full article HERE

….also from KingWorldNews: A Golden Opportunity – Pretium is one of the cheapest miners relative to NAV and earnings on next year’s estimate that I have ever researched.

Jul 24, 2018

  1. In 2013 and 2014 I predicted the Fed would lead the ECB and the BOJ in a slow but steady reversal of central bank policy, from QE/low rates to QT and relentless rate hikes. Even more shockingly, I predicted this would create a money velocity bull cycle in most Western countries. I also suggested that during this process the world’s greatest asset (gold) would regain its position as the most respected asset.
  2. Please  click here now. Double-click to enlarge. I’m predicting that the ECB joins the Fed in substantial balance sheet contraction in 2019, and the BOJ won’t be far behind.
  3. As that happens, I expect the dollar will resume its long-term bear market against gold and experience a substantial decline against the yen.
  4. Institutional money managers are becoming concerned about the decline in liquidity in many bond markets around the world. I would suggest this is only the tip of the inflationary iceberg.
  5. Please  click here now. Double-click to enlarge. From a technical perspective, the US government bond market looks like a train going off the tracks on the side of Mount Everest!
  6. There’s a massive head and shoulders top in play. Bond market money managers are trying to talk the market higher in the face of Powell’s significant balance sheet contraction and rate hike actions. Those money managers will likely fail, and fail badly.
  7. Japanese banks will become must-own stocks as the BOJ begins rate hikes and QT. Their ability to make a profit has been severely hampered by the BOJ’s crazed QE and ultra-low rates policy.
  8. What’s particularly interesting is that Japan’s citizens are massive savers. They will move significant funds into the banking system as the BOJ tightens. Japan will soon become a major exporter of inflation to America and to the rest of the world. The same thing will happen in Europe as the ECB begins QT and rate hikes.
  9. Please  click here now. Double-click to enlarge this key gold chart. When the weekly chart Stochastics oscillator (14,3,3 series) becomes substantially oversold in July or December, as it is now, gold becomes a “must-buy” for gold asset enthusiasts.
  10. Please  click here now. The smart money commercial traders are often aggressive buyers of gold on the COMEX in July. 
  11. Clearly, this year is no exception to that golden rule! The commercials bought about 28,000 long gold contracts (basis the latest reporting period). I’m predicting they will buy an additional 25,000 to 75,000 contracts if gold trades in the $1200 – $1180 area.
  12. It’s very important for gold asset enthusiasts to focus on buying gold-related items in July like shopping for groceries in a grocery store. The commercial traders are simply adding modestly to their long positions, and that’s what gold bugs must do too.
  13. Many technical analysts appear to be trying to outsmart the commercial traders using their charts. They are looking for lower prices some kind of “final low.” I don’t endorse that type of approach to building wealth in the gold market.
  14. It’s far more rational to simply go shopping with a grocery cart when the sale is ongoing (now) than to try to identify the final day or hour of this price sale. 
  15. Morgan Stanley’s analysts have predicted that India’s central bank will likely raise rates at the August 1, 2018 meeting. A rate hike there would likely create a rally in the rupee and lower the price of gold in India. That would likely create substantial buying by jewellers and dealers. I’m quite sure this is what the COMEX commercial traders are focused on now.
  16. A rate hike by Powell in September is also positive for gold. It could roil US stock, bond, and currency markets. 
  17. Please  click here now. Double-click to enlarge this long-term gold chart. The giant inverse head & shoulders bottom is near completion. Perfect symmetry would be achieved with a dip to the $1200 – $1180 zone. All gold market investors should be very enthusiastic now, as the rally from this pattern could be record-breaking in terms of its relentlessness.
  18. Please  click here now. Double-click to enlarge. Gold is the world’s greatest asset, and bitcoin is the most exciting! Some call it digital gold. Some call it a fad. Some call it in need of regulation. I call it headed for my $40,000 target! 
  19. You won’t see heavyweight mainstream analysts talking about “sky high” price targets for gold (and rightly so) but many of the best ones do it with bitcoin. Tom Lee is one of the world’s most respected equity market analysts. His ultimate target for bitcoin is above $200,000. His year-end target of $30,000 is slightly below mine, but still very solid. These high price targets are achievable with bitcoin as opposed to gold, because the total supply of gold grows slowly but still grows, whereas the supply of bitcoin is absolutely fixed at around 21 million coins. 
  20. In terms of market capitalization, bitcoin makes up almost 50% of the entire crypto asset class. The forks appear to produce no significant dilution. They are more like corporate spin-offs than dilutions of this mighty coin! 
  21. A week ago, I urged investors to buy bitcoin in advance of the inverse head and shoulders bottom pattern breakout. Just hours later, bitcoin blasted through the neckline of that pattern. I then advised investors to do further buying with their eyes closed. I did that because it’s pointless to wait for minor pullbacks when a major buy signal is in play. That call is working out very well. 
  22. With the involvement of banks, hedge funds, and regulators, it’s becoming quiet likely that bitcoin is here to stay. Eager wealth builders can get in on the blockchain/crypto action (mining and investment) with my  www.gublockchain.com newsletter.
  23. Please  click here now. Double-click to enlarge this important GDX versus gold chart. I’ve suggested that while the outperformance of GDX against gold during this substantial gold bullion price sale is due for a pause, I think it’s only a very short pause that will end after the Indian central bank meeting next week.
  24. Please  click here now. Double-click to enlarge. Against the dollar, GDX has continued to build an enormous base in my buy zone of $23 – $18. The $21 area is the “meat and potatoes” of that zone. Investors who have gone shopping for gold stocks on a weekly or monthly basis in this price zone should be sitting happily on some great core positions, and ready for some great upside action that appears to be imminent!

Thanks! 

Cheers
st

Jul 24, 2018
Stewart Thomson  
Graceland Updates
website: www.gracelandupdates.com

Signals vs. Noise in the Gold Market

Screenshot 2018-07-19 06.29.45

In his book Nobody Knows Anything, my friend Bob Moriarty wrote about the difference between signal and noise. Unfortunately, much of the information in the gold space or what passes for such is really noise. Conspiracy theories around manipulation, price suppression and China are all too popular while important factors like real interest rates, investment demand and gold’s relationship to equities are neglected. At present the Gold market has experienced a critical breakdown yet in some circles a new theory and explanation is gaining traction.

Last week more than a handful of subscribers alerted me to Jim Rickards’ belief that China has pegged the SDR (an IMF reserve currency) Gold price from 850-950 SDR/oz and this is what is impacting the Gold price. Rickards writes that the peg is too cheap given the scarce supply of Gold and that the IMF will print trillions of SDRs during the next global financial crisis. It’s a signal that China is betting on the SDR and Gold, he says. He also tweeted that at the Sprott Investment Conference he would present the evidence of the new gold standard at 900 SDR/oz. 

First, the supply of Gold is not scarce. The supply of Gold actually grows in perpetuity because Gold is not consumed like other commodities. 

Second, let’s look at the chart of the Gold price in SDRs, kindly provided to me by Dan Popescu. Sure, it has traded from 850 to 950 for the past 18 months but that does not imply a peg or some behind the scenes price management. Everyone following precious metals knows the market has been locked in a very tight range for many months. 

However, technically speaking the Gold price in SDRs has broken down from a large, bearish consolidation and the implication is price will continue to trend lower. I expect it will test that low at 840 and ultimately trend towards its 2014-2016 lows before its next bottom.

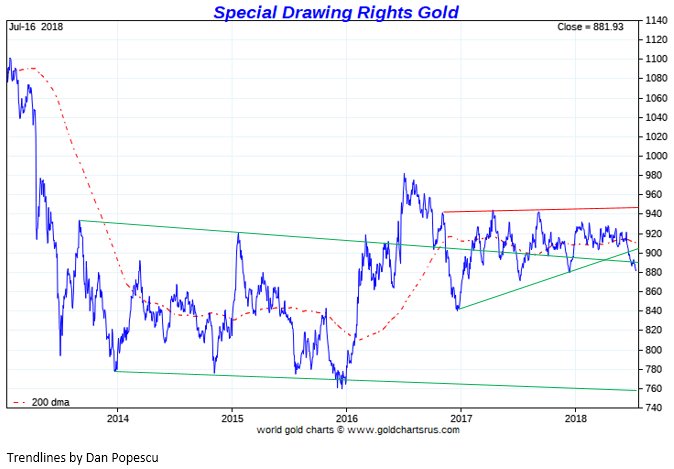
It is an ominous looking chart (above) and so is this one (below).

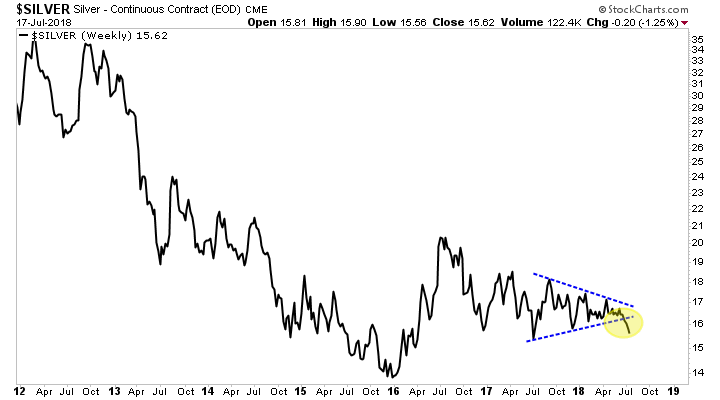
And it’s not just Gold. Here is Silver, breaking down from a triangle consolidation.

We’ve written about the reasons for Gold’s struggles (stable real interest rates, rising stock market, renewed dollar strength) and what it will take for its next bull market to take hold

That being said, great traders don’t focus on the why. They focus on the price action. 

The message of the market is quite clear. Gold and Silver were trading in ranges but they are now breaking to the downside. Sentiment data is certainly sending bullish signals for a counter-trend rally (and it may have begun Wednesday) but I digress. 

Price action, fundamentals and sentiment data are what we call signals. They come from real data that can be verified. Interpretations can differ, but the data is factual.    

The view or belief that China is pegging the SDR or creating a new gold standard at 900 SDR/oz or will revalue the Gold price higher in due time is noise. It’s not based on anything that can be verified. Its merely an opinion of someone purported to be an “insider.” Moreover, if the new downtrend in Gold is sustained then the SDR price will decline and the theory of a peg or new gold standard would be quickly disproven. 

With all due respect, we need to focus on signals and not conspiracy theories that can’t be proven or verified and don’t help anyone make money. That’s noise. Regardless of the veracity of the aforementioned theory, Gold and Silver have broken down technically and could trend lower after a relief rally.

July 17, 2018 

  1. The world’s greatest asset is on sale.  In China, India, and the Western gold community, shoppers are happily placing small amounts of “golden groceries” into their shopping carts each week, and enjoying the price sale.
  2. Please click here now. Double-click to enlarge this gold chart.  
  3. From a technical perspective, this chart is magnificent.  The left shouldering process took about eighteen months, and the right shouldering process has just reached the same eighteen months of time.
  4. The pattern itself is an inverse head & shoulders bull continuation pattern.  From a price perspective, perfect symmetry would be created if gold traded at $1180 during the next few months, before surging above the $1400 neckline area and up towards the $1750 target zone.
  5. Please click here now. Double-click to enlarge this short-term gold chart.
  6. Gold may trade down to the “perfect symmetry” zone of $1180.   It could also begin to rally from the current $1250 – $1225 modest support zone.  What happens next will be determined mainly by market fundamentals.
  7. Jay Powell seems determined to push ahead with balance sheet contraction via QT, rate hikes, and he may widen the Fed funds/excess reserves spread further.  
  8. That’s negative for the ability of the US government to finance itself, positive for money velocity, and positive for gold.
  9. Please click here now. Double-click to enlarge this dollar versus rupee chart.  
  10. The bottom line is that the current gold price sale is a very mundane love trade oriented affair.
  11. That’s because the dollar’s strength against the rupee during gold’s weak demand season has resulted in a very modest price sale for gold priced in rupees.
  12. The good news: A bear wedge has appeared on the dollar-rupee chart just as gold arrives at $1250 -$1225 support and seasonal love trade demand begins to strengthen.  
  13. This is essentially a mandate for all gold market shoppers to buy this price sale, and buy it with a smile.
  14. Please click here now. I’ve suggested the US stock market is somewhere between the seventh and ninth innings of its ballgame, and clearly top money managers at Guggenheim agree. 
  15. Global tariffs are modestly inflationary and negative for GDP growth.  Trump’s next round of tax cuts may not even provide enough stimulus to offset the tariffs.  
  16. The Western world is steadily transitioning from growth with growing inflation to more inflation, fading growth, and peaking stock market valuations.  
  17. Recent polls suggest that at least 70% of American Millennials want a third political party, don’t trust banks, and are enthusiastic bitcoin investors.
  18. Please click here now.  Double-click to enlarge.  Gold is the world’s greatest asset, and bitcoin is the most exciting.  I cover the most intense action at my www.gublockchain.com website.  The goal is to help global blockchain/crypto enthusiasts get richer as fast as possible.
  19. When baby boomers dominated US demographics, they focused on traditional stocks and government bonds.  In contrast, Millennials in Asia are focused on stocks, bitcoin, and gold.  I’ve predicted that American Millennials will ultimately have the same focus as their Asian counterparts.  
  20. I’ve also predicted that gold-backed bitcoin beats out the yuan and the IMF SDR in the race to become the main world currency, but it could be just bitcoin alone.  
  21. In that scenario, gold would function as the safe haven/ultimate asset, and bitcoin as the payments currency.  Going forwards a decade or two, the dollar may look good in a glass jar in the ancient history museum, but Asian Millennials won’t see much use for it beyond that. Regardless, outrageously good times lie directly ahead for both bitcoin and gold.
  22. Please click here now. Double-click to enlarge.  GDX has rallied against gold many times in the past, but that was always when gold rallied against the dollar. 
  23. Now it’s happening while gold falls about $140 an ounce!  This stunning price action fits with the transition from deflation to inflation.  
  24. It’s very similar to what happened in the late 1960s in America, and adds to the importance of buying the current price sale in both miners and metal!

Thanks

Cheers

St  

Stewart Thomson  

Graceland Updates 4am-7am 

https://www.gracelandupdates.com   

https://gracelandjuniors.com

https://gudividends.com     

https://guswinger.com   

https://gublockchain.com