
Gold & Precious Metals

The Fed decision was the catalyst for the final breakdown in precious metals. On Thursday Gold closed at a new low, below $1200 and the gold shares also closed at a new low. Last week we wrote:“The bulk of the evidence leads me to believe that we probably have not seen the bottom though we are very close…..Bottoms can happen in an instant or develop through a basing process. Huge immediate rebounds originate from extreme oversold conditions. We don’t have that at the moment.”
The bad news is obvious. Precious metals are breaking again. However, the good news is this will lead to the end of the bear market and a “back up the truck” or “fat pitch” type of buying opportunity. History makes a strong case that this bear market is about to end. Couple that with precious metals touching multi-year support levels and the bear market has a very high probability of ending.
First, we’ll look at Gold. The chart below shows all of Gold’s bear markets though we excluded the two extremes: the 1980-1982 (a 65% decline) and the 1987-1993 bear (lasted five years and only declined 35%). The current bear best resembles the bears of 1976-1976 and 1983-1985. The fact that the current bear is longer suggests it will be less severe in price. Gold’s shorter bears (including 1980-1982) ended in a panic selloff. It appears this bear will share the fate.

Where would a panic selloff take Gold? Gold should find strong support at $1085 which is the 50% retracement of the entire bull market. That is a 9% decline from Thursday’s close. Also, major trendline support comes into play in the low $1100s.

Moving to the gold stocks, we can see that the current bear market (in black) only needs to go a bit further to be on par with past bear markets. Note that the three bear markets that lasted the longest were far less oversold at the current point. This suggests the current bear should end quite soon.

The chart below is a weekly line chart (weekly closes) which shows the HUI Gold Bugs index and the GDM index (forerunner to GDX). The HUI has 10% downside to 9-year support while the GDM, a broader index has 5% downside to support dating back to 2002.

History, as it does for the gold shares, makes a strong argument that the bear in Silver is nearly complete. With a bit more of a decline, the current bear will become the second worst ever. Again, note that the bear markets which lasted longer than the current one were far less oversold at the present point.

Silver, like Gold has very strong, multi-year trendline support that could mark the bottom after this final selloff.

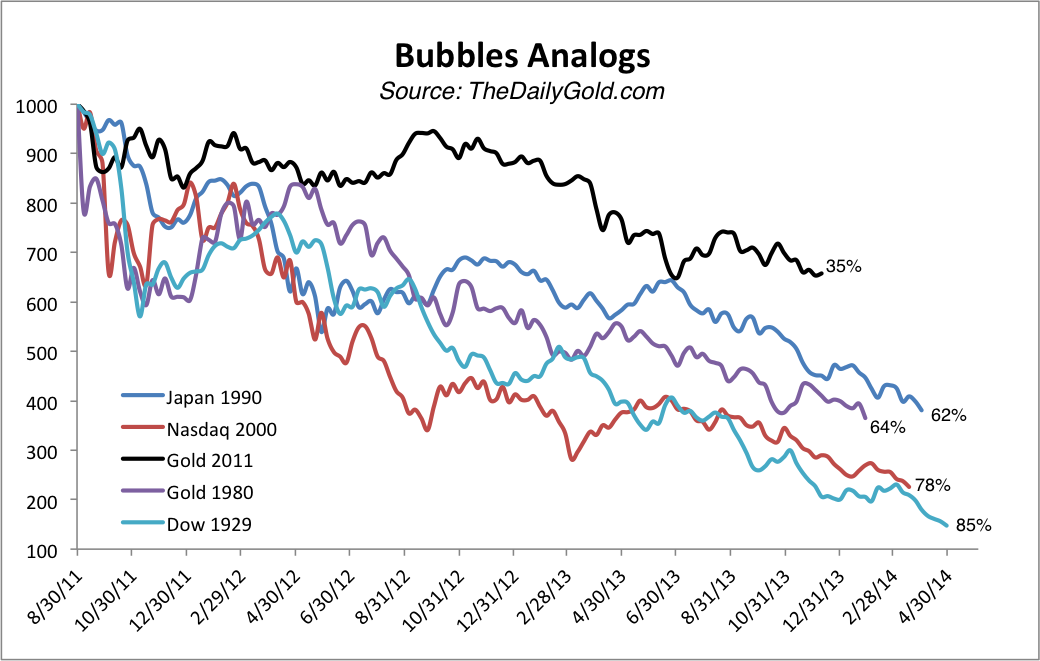
Given the weight of this historical analysis and technical analysis, I don’t see how anyone can argue that the bear market isn’t coming to an end. Bear markets typically last two to three years and are a function of price and time. The more severe the bear is in price, the shorter it lasts. Bears that last more than a few years are less severe in price. These historical charts make a strong argument and the fact that Gold, Silver and the gold stocks are nearing decade long support should increase your confidence substantially. Moreover, the biggest bubbles (Japan, Nasdaq, Gold, 1929) on average deflated by 65% to 85% in two and a half years. The Silver bears chart shows its 87% decline in the early 1980s. If the secular bull market was over, Gold & Silver would already be trading at much lower levels.
Last week we concluded that: “The bottom line is there is no need to aggressively buy yet unless the market becomes extremely oversold and plunges to a new low. Wait for that to happen and if it doesn’t, then a base is likely developing.” Now we know that a final plunge is developing rather than a base. The key to catching a falling knife is to do so at an area of very strong support. I think we’ve laid out the strong support for Gold, Silver and the gold stocks. If you’d be interested in more of this analysis and the companies poised to rocket out of this bottom then we invite you to learn more about our service.
Good Luck!
Jordan Roy-Byrne, CMT
Go HERE top right to sign up for the Newsletter

….”Normalization” Challenged by US Earnings.
WHOLESALE London gold sank against all currencies Thursday morning, falling 1.9% vs. the Dollar to hit 6-month lows after initially trading flat overnight despite the US Fed finally reducing its $85 billion per month in asset purchases.
Cutting next month’s quantitative easing of US mortgage and longer-term government bond rates to $75bn, the Fed pointed to “growing underlying strength in the broader economy.”
US stockmarket indices the S&P500 and the Dow surged to new all-time closing highs, while Treasury bonds fell and spot gold fell through this week’s previous low at $1230.
Besides the taper, however, the Fed revised its policy on short-term interest rates, saying it will hold the federal funds rate at zero “well past the time” that the US jobless rate falls to 6.5%, its previous line in the sand.
Overnight in Asia, Japanese shares rose but Chinese stocks fell as the People’s Bank of China broke its own rules and took to Weibo, the equivalent of Twitter, to announce a “short-term liquidity operation” after Shanghai’s interbank lending rate jump above 10%.
The PBoC usually waits a month before reporting such moves, says the Financial Times.
“It’s very clear they want to calm down market fears,” the FT quotes ANZ analyst Zhou Hao, noting the previous spike in Chinese interest rates in June, when US Fed chairman Ben Bernanke spoke about possible QE tapering.
Shanghai gold today fell 0.8% in Yuan but increased its premium over international prices from $6 to $11 per ounce.
Amongst Western investors, “More sensible minds realise,” says a note from David Govett at brokers Marex, “that on the whole [the Fed news] is not a good move for the precious complex.
“With further tapering probably to come over the course of next year, the outlook remains muted. However, I don’t subscribe to the theory that it’s all over for the bullion market [and] would be a buyer of dips if we do manage to break below $1200.”
Bids in London’s wholesale market briefly dropped below that level Thursday morning, hitting a 6-month low of $1199.75 per ounce.
Priced in Sterling and Euros, wholesale gold bullion fell to its lowest since spring 2010, down 29% and 31% respectively from the start of 2013.
Silver tracked gold in Dollars, briefly falling below $19.30 per ounce – a “key level” according to technical analysts at one bullion bank.
Fed tapering “highlights the overall positive sentiment towards the macro economy,” reckons UBS analyst Joni Teves.
“Equities are in fierce competition with gold for investor dollars, and this year’s trend of rotation away from gold into growth assets is expected to continue into 2014.”
“This is another sign of increasing normalisation for the world economy,” agrees Matthew Turner at Macquarie Bank. “Gold’s insurance function is less desirable in that environment.”
“But if the economy is accelerating as people think,” counters Albert Edwards in his latest Global Strategy Weekly for clients of French investment and London bullion bank Societe Generale, “how come Thomson Reuters has just reported the fastest pace of US earnings downgrades on record?
“If we are set for a profits-driven economic slowdown, then the low rate of core inflation will start to become a key concern. Deflationary forces are in fact stronger than even the latest [official data] suggests.”
Adrian Ash
Click HERE or on chart to choose different times

Gold price chart, no delay | Buy gold online
Adrian Ash is head of research at BullionVault, the secure, low-cost gold and silver market for private investors online, where you can fully allocated bullion already vaulted in your choice of London, New York, Singapore, Toronto or Zurich for just 0.5% commission.
(c) BullionVault 2013
Please Note: This article is to inform your thinking, not lead it. Only you can decide the best place for your money, and any decision you make will put your money at risk. Information or data included here may have already been overtaken by events – and must be verified elsewhere – should you choose to act on it.

-
I know Mike is a very solid investor and respect his opinions very much. So if he says pay attention to this or that - I will.
~ Dale G.
-
I've started managing my own investments so view Michael's site as a one-stop shop from which to get information and perspectives.
~ Dave E.
-
Michael offers easy reading, honest, common sense information that anyone can use in a practical manner.
~ der_al.
-
A sane voice in a scrambled investment world.
~ Ed R.
Inside Edge Pro Contributors

Greg Weldon

Josef Schachter

Tyler Bollhorn

Ryan Irvine

Paul Beattie

Martin Straith

Patrick Ceresna

Mark Leibovit

James Thorne

Victor Adair