
Gold & Precious Metals
In this Weekend Report I’m going to show you the Chartology of gold, from my perspective, for the last 17 years or so. As you know I don’t pay lip service to the cycle guys, Elliot Waver’s or the many different disciplines that folks use to analyze the markets. My goal is to give you an unbiased look at the markets strictly from a Chartology perspective that is unique for our site.
In this look at gold I’m going to use several different concepts that I’ve shown you in the past to try to give you a feel of where we maybe headed. We’re going to look at neckline symmetry rails, neckline extension rails, reverse symmetry and just your everyday support and resistance points on a chart. I hope to paint a fairly accurate picture of where the gold market may find an important low based on the charting concepts listed above.
1…NECKLINE EXTENTIONS
Before we look at gold I want to show you some of these charting concepts so you will have a better understanding of what I’m showing when we get to gold. The first thing I would like to show you is a neckline extension rail. Many times when a neckline is broken you will get an immediate backtest and then the move will take place. There is a saying I uses that goes like this, a neckline never dies it just slowly fades away. By that I mean you can extend the neckline way out in time and it can still be active even though the original move has completed and the price objective met.
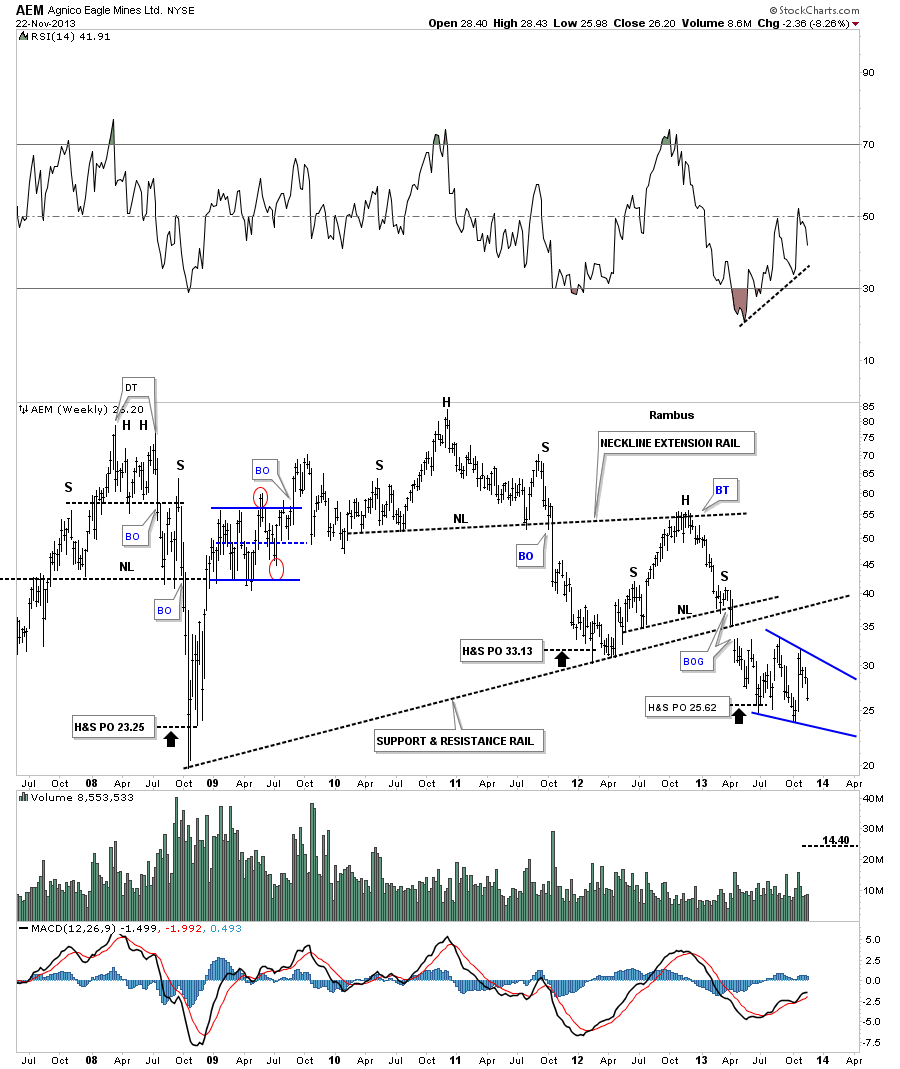
AEM was one of the first big cap precious metals stocks to form its high and breakdown while the rest were still building out their topping patterns. There are three H&S tops on this weekly chart below but we’re just interested in the middle one that formed back in 2010 – 2011. After reaching its price objective down at 33 or so it then had a counter trend rally that took the price action all the way up to the old neckline that I’ve labeled, Neckline Extension Rail. As you can see AEM tried for several months to breakout above that neckline extension rail but failed. That failure created the head portion of another H&S top which reached its price objective down at the 25.62 area where its currently trying to form a blue falling wedge.

I’m penning this column from my cabin on the Crystal Symphony where I’ve met with subscribers who joined us on the first Money and Markets cruise.
I’ll tell you more about it in my next issue, including details of the presentation I gave on the war cycles and what they show for 2014.
But, today, I want to get to the most urgent matter at hand, none other than gold.
With gold now moving lower and breaking critical support at the $1,262 level, let me tell you exactly what’s happening:
First, the timeframe for a major low in gold runs until the end of January.
And now that it’s broken that $1,262 level, we are likely to see gold fall below the June low at $1,178, and then below $1,100. I suspect the final low will be somewhere between $990 and $1,035.
Second, the action we are seeing in gold of late is part and parcel of a major bottoming process. It’s swinging wildly. So are silver, platinum and palladium.
Important bottoms are characterized by:That volatility is important. Why? Because important bottoms in any market take time to develop. Unlike important tops, which occur suddenly, important bottoms are tricky.
 Important bottoms are characterized by:
- Increasing volatility
- False breakouts
- Sharp moves lower
- Wild swings overall, causing traders and investors to become impatient, frustrated, even hopeless
The key during this very important time period: Don’t let impatience or frustration cause you to take your eye off the prize. That’s what the market wants you to do.
But if you fall prey to the market’s antics at this time, when a major bottom is being formed, you will not be one of those who rides the next bull leg higher to glory.
Keep in mind that at important tops, a market will always do its best to trap you near the highs and make it hard for you to get out …
While at important market bottoms, a market will do everything in its power to prevent you from getting on board.
So, though gold has broken the $1,262 level, sharp rallies are still possible within the confines of a trend that should find gold headed lower into January.
Third, the latest data from my cycle studies support the wild action we are seeing and the bottoming process.
More specifically, as you can see from the chart below of the long-term daily cycles, gold should be heading lower into January.
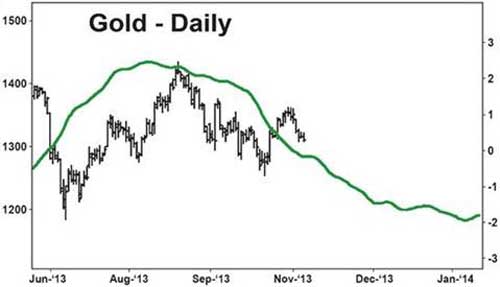
But look at the long-term weekly cycles for gold on this next chart.
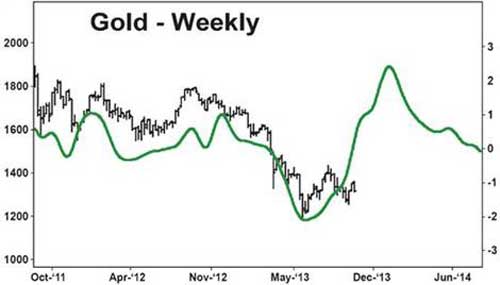
This type of formation — where the daily cycles are bearish but the weekly cycles are bullish — is not unusual at important turning points.
It’s what causes wild swings, confusion in the market place — and yet, it’s part and parcel of the bottoming process.
It’s the market’s way of throwing as many curveballs at you as possible — to shake you out of the market — so only the savviest, most disciplined investors can profit from the next leg up.
One more thing about gold and the bottoming process. Here are my year-end momentum and trading ranges to monitor for gold …
Gold’s 2014 momentum range: $1,948.10 — $1,338.20
Gold’s 2014 trend range: $1,268.30 — $852.60
If you’ve been watching gold closely, you can see how accurate those ranges are. Gold rallied above the $1,338.20 level — the bottom of the 2014 momentum range — in late October, but then suddenly dropped right back below it.
This is critical. It is telling you that the momentum in gold remains negative, with a bearish bias heading into year-end.
And now, gold has fallen below the top of the 2014 trend range at $1,268.30. This tells you that the daily cycles are now overpowering the weekly cycles, setting up gold for a January 2014 low, at much lower prices.
All of this is also why I urge you to pay very close attention to the gold market now … to everything I write and send you … and be ready to act on a moment’s notice.
Gold is reaching its most important inflexion point since its major bottom back in 1999. And if you let the wild action throw you off course, you will miss the next big leg up that will take gold to well over $5,000 an ounce.
Be patient, disciplined and wait for my signals. If you can do that, you stand to make more money in gold over the next three years than you ever dreamed possible.
Best wishes,
Larry
About Larry Edelson
This investment news is brought to you by Money and Markets. Money and Markets is a free daily investment newsletter from Martin D. Weiss and Weiss Research analysts offering the latest investing news and financial insights for the stock market, including tips and advice on investing in gold, energy and oil. Dr. Weiss is a leader in the fields of investing, interest rates, financial safety and economic forecasting. To view archives or subscribe, visit http://www.moneyandmarkets.com/.
Take a look at this chart above:
See that huge drop?
That’s a collapse in the supply of silver. It began in 2010.
Tim Mittelsteadt
Editor-in-Chief, Common Sense Publishing

Already beleaguered, gold suffered another sharp drop this week. When the minutes from the Federal Reserve’s latest policy meeting implied it might slow its QE3 bond-buying campaign “in coming months”, futures speculators responded with heavy selling. But their extreme gold bearishness is highly irrational, they are missing the forest for the trees. Taper or not, quantitative easing remains super-bullish for gold.
Quantitative easing is the fancy name for the Fed’s massive and unprecedented bond-buying programs of recent years. In order for normal investors to buy bonds, they first have to raise the necessary cash by selling something else. But when central banks like the Fed buy bonds, they conjure the cash out of thin air! The Fed pays the bond sellers with new money that never existed before, which is then immediately spent.
Thus throughout world history the benign-sounding “quantitative easing” was always known by its far-more-sinister label of debt monetization. Central banks literally convert their local government’s debt into new money, which is pure inflation. Governments “finance” their excessive spending by selling their bonds to their central banks for newly-printed money, which the governments directly inject into their economies.
This ultimately results in relatively more money bidding for relatively less goods and services, which inevitably bids up general price levels. There is nothing more inflationary than central banks monetizing debt, which is why it is so incredibly bullish for gold. Due to the inherent limitations of gold mining, the global gold supply perpetually grows vastly slower than the central banks’ endless supplies of fiat money.
The Federal Reserve embarked on the slippery slope of debt monetization in late 2008. It had forced its benchmark interest rate to zero in response to that year’s once-in-a-century stock panic. So without any more conventional easing possible, it decided to print money to buy debt for the first time in its history. And now today fully 5 years later, it has shown no signs of stopping despite endless promises to the contrary.
And indeed the money supply has soared since. Between mid-December 2008 when the Fed launched its zero-interest-rate policy (ZIRP) to today, the M1 money supply is up 68%! That’s why everything we all need to live is much more expensive today than it was 5 years ago. There are far more dollars chasing the goods and services our economy offers, which have bid up their price levels significantly to greatly.
This includes the gold price, the ultimate inflation barometer. In the week leading into the Fed’s decision to punish savers with ZIRP, gold was trading near $800. Less than a few years later it challenged $1900, and even today remains far higher than the pre-QE days. During the first quantitative-easing campaign’s lifespan gold surged 51% higher, and in QE2 it rallied another 25%. Yet gold has withered under QE3.
The Fed birthed QE3, which is destined to be the Fed’s largest debt monetization ever, in September 2012. The day before gold was trading around $1730. This week just 14 months later, it is down 28% over QE3’s lifespan. Is gold’s horrendous performance so far in QE3 because it really isn’t inflationary? No way. All the newly-created money the Fed uses to monetize debt continues to balloon its balance sheet.
When the Fed buys bonds, those bonds appear as assets on its balance sheet. The Fed rather helpfully publishes extensive data on its holdings weekly, which this first chart chronicles. Within the orange total balance sheet, this data is stacked. The red Treasury holdings are on top of the yellow mortgage bonds. The most striking thing in this chart is the gargantuan growth in the Fed’s balance sheet during QE3.
In September 2012 just before the Fed launched its unprecedented open-ended third quantitative-easing campaign, its balance sheet was at $2798b. This was already very high, as it had only averaged around $875b in 2008 before the stock panic. But the Fed joined in panicking, going nuclear with ZIRP and then QE in a matter of months. And the Fed’s massive debt-monetization campaigns have rarely paused since.
After QE3 being expanded to include Treasury monetizations last December, the Fed has been buying up bonds with newly-created money at a blistering $85b-per-month pace. This has catapulted the Fed’s balance sheet to $3822b as of this week, up a staggering $1024b or 37% over QE3’s lifespan! Does it make any sense at all for gold to plunge 28% in just over a year where the Fed’s balance sheet soared 37%?
Absolutely not! The deluge of selling gold has suffered this year is extraordinarily, epically irrational in light of what the Fed is doing with QE3. Other than that emergency initial spike in late 2008, the Fed’s balance sheet has never grown faster than it has over this past year. All the new money it is creating to buy bonds is exploding the money supplies, pure inflation. Gold’s price should be sharply higher over this span.
Yet just the opposite has happened, gold has plunged as debt monetization soared. One of the primary reasons is the way American futures speculators are hysterically reacting to the Fed. Rather than watch what it does, they are fixated on what it says. And for the entire short history of QE3, the Fed has fallen all over itself trying to convince the financial markets that QE3 will soon end. Each time gold futures get dumped.
This whole exercise has been a ludicrous farce right from the beginning. After launching QE3 at its September 2012 meeting, the Fed more than doubled its scale to include Treasuries just a few months later in December. As always, that Federal Open Market Committee meeting’s minutes were released 3 weeks later in early January. That was the first time gold got hit this year on the endless QE3-taper talk.
At the very meeting where QE3 was expanded with a nearly-unanimous 11-to-1 vote, there was already internal discussion on when to end QE3! So futures speculators heavily sold gold contracts, rightfully figuring that lower future inflation was less bullish for gold. But ever since 2013’s initial release of FOMC minutes, the idea that the Fed is debating when to slow and eventually end QE3 has been old news.
The Fed’s FOMC meets 8 times annually, so there are 8 FOMC statements released per year each followed several weeks later by the meetings’ minutes. This works out to some major Fed release about once every 3 weeks. And at every subsequent meeting after QE3 was expanded to include Treasuries, the FOMC members continued to debate how and when to exit QE3. It was never going to be permanent.
Yet American futures speculators continued to dump gold aggressively each time the Fed rehashed this old news that QE3 would eventually end. A couple months ago I superimposed FOMC decision and minutes dates over a gold chart, and the result is striking. Nearly all gold’s sharp and anomalous selloffs this year are the direct result of futures traders reacting to what the Fed is saying. They keep freaking out!
This response is absurdly irrational. Since early January it has been crystal-clear that QE3 wouldn’t last forever, yet each time the Fed repeats that heavy gold selling follows. This week’s is the latest example. Yet despite Fed officials’ constant jawboning that they have to slow and stop QE3 soon, it just keeps on chugging ahead at full steam. The Fed’s balance sheet continues to balloon as it aggressively inflates.
A common proverb we all learn at a relatively young age is “talk is cheap”. People promise to do things all the time, from our friends to politicians to Fed officials. Yet if they don’t carry through on those promises, we quickly discount their credibility. Thus the older and wiser we get, the more we tend to focus on what people do instead of what they say. Fed officials have been promising QE ending soon since early 2009!
By irrationally fixating on the endless Fedspeak that never comes to fruition, futures speculators are missing the forest for the trees. Since early January, despite every FOMC meeting and minutes since, despite the long parade of Fed officials suggesting otherwise, the Fed’s balance sheet has continued to grow at a frightful pace as it continues to monetize debt. It’s high time futures traders start paying attention.
QE1 was gigantic, totaling $1750b of Fed bond buying with newly-conjured money. Yet only $300b of that included direct Treasury monetizations, the purest form of inflation. Thanks to Obama’s insane record deficit spendingand debt growth, every dollar the Fed has created to buy Treasuries has been immediately spent by Washington. All this money injected directly into the US economy is bidding up price levels.
Gold powered 51% higher during QE1, a universal acknowledgement by all market participants including futures speculators that QE is highly inflationary. QE2 was much smaller than QE1, totaling $900b of debt monetizations. But while all of this was in US Treasuries, only $600b was inflationary new buying. Yet this was still twice the size of QE1’s total Treasury monetizations, so gold still powered another 25% higher.
Despite an entire year of Fed officials falsely promising that QE3 would end soon, it has become utterly massive. As of the end of this month, the Fed will have monetized $560b of mortgage-backed bonds and $495b of Treasuries! This means QE3 is already $1055b, dwarfing QE2 and giving QE1 a run for its money. Its $495b of direct Treasury buying is way higher than QE1’s $300b and rapidly approaching QE2’s $600b.
And no matter what the Fed does, QE3 is going to get a lot bigger still! All the Fed officials’ bloviating all year long has made one thing very clear, the FOMC is terrified slowing QE3 will have an adverse market impact. I discussed the risks of this in depth back in September just before the Fed was universally expected to start tapering QE3. Of course the Fed chickened out and failed to keep its implied promises, again.
But back in mid-June, the Fed chairman laid out a best-case QE3-tapering timeline. One thing the Fed has emphasized over and over again is the end of QE3 will be gradual to minimize the risk of spooking the markets. Ben Bernanke’s plan called for QE3’s new bond purchases gradually being reduced to zero over a 9-month span. I strongly suspect no matter when QE3 tapering starts, it will take about 9 months.
Assuming an even taper pace, those 9 months will each average half of QE3’s current $85b per month of buying, or $42.5b. That’s another $383b or so baked in on top of QE3’s already-gigantic $1055b size. This puts QE3 up to $1438b, starting to challenge QE1. And every month that the start of QE3 tapering is delayed increases its total size by $85b. Even a December-meeting taper would leave QE3 at $1523b!
The more-likely March meeting, the first under the new Fed chairman, would mushroom QE3 to $1778b. This exceeds QE1 absolutely, and the Treasury portion of QE3 alone would be $878b. This is almost as big as the new Treasury monetizations in QE1 and QE2 combined! And many analysts believe Janet Yellen, who is far more Keynesian and dovish than Ben Bernanke, will keep buying bonds much longer.
No matter when the Fed starts tapering QE3, this debt-monetization campaign is going to be massive beyond belief. And even after QE3 eventually ends, it is not like the Fed is going to instantly sell its trillions of dollars of bonds. To do so would crash the Treasury market and send yields and general interest rates skyrocketing. Instead the Fed will simply let all the bonds it bought naturally mature and gradually roll off.
This is going to take many years. Way back in QE1, the Fed purchased $200b in agency debt (Fannie and Freddie bonds). It hasn’t purchased any more since. Yet look how slowly this green category is naturally rolling off the Fed’s balance sheet. The Treasuries are going to take considerably longer, as they have longer maturities since the Fed is by its own admissionexplicitly manipulating long rates.
The chart above shows how slowly Treasuries rolled off in the lulls between QE1 and QE2, and then QE2 and QE3. The point is even when QE3 eventually ends, the Fed’s balance sheet is going to remain extremely highfor many years to come. All of this monetary inflation will remain in the economy in the meantime, continuing to keep price levels high. The trillions of QE will take years to unwind after QE3 ends.
So the goofy futures speculators dumping gold every time the Fed or some Fed official implies the FOMC might start slowing QE3 soon is the height of irrationality. QE3 is massive beyond belief, and still growing full-speed. QE3 will keep expanding the Fed’s balance sheet even as it is tapered, and all this inflation will remain baked into the economy for many years to come until all the bought bonds slowly mature.
There is a strong case to be made that gold prices already fully adjusted to reflect a QE3 tapering back in early January, when they were still trading around $1650. All the futures selling since has been the result of emotion, totally hysteric. And the resulting gold-price anomaly grows even more extreme with each passing month as the Fed keeps QE3 fully online, ensuring its ultimate size will be that much larger.
QE3 is almost certainly going to prove the biggest inflationary event in the Fed’s century-long history, wildly bullish for gold. One of the surest bets anyone can make is that gold prices will be much higher when QE3 ends than they were when it began. And since that benchmark is way up around $1730, gold is going to have to regain much ground. Futures speculatorsbuying again will drive this upleg’s early gains.
While we’re on this Fed thread, there’s something even more important than QE for gold’s future, ZIRP. The Fed has been holding interest rates at zero since late 2008, and Fed officials are now saying ZIRP may stay in placewell into 2017, long after QE presumably ends. Keeping short rates so artificially low guarantees negative real interest rates, the most bullish monetary environment possible for gold.
I’ve written many essays on negative real rates and gold, the latest exactly a year ago. ZIRP bludgeons down short Treasury yields, including the benchmark 1-year Treasury Bill yield used in the real-rate calculation. From it the year-over-year change in the chronically-understated US Consumer Price Index is subtracted, revealing real rates. They are going to remain negative for as long as the Fed maintains ZIRP.
Gold’s current secular bull was born in early 2001 because real interest rates were heading into negative territory due to Fed interest-rate manipulations. Negative real rates guarantee that bond investors will lose purchasing power after inflation, making gold far more attractive. Thus gold tends to power higher as long as real rates remain negative. Secular gold bulls don’t end until real rates spike massively positive.
It took real rates above 6% to kill the 1970s secular gold bull. And even with the absurdly-low and totally fictional 1.0% inflation rate the CPI is claiming today, the Fed would have to hike short rates near 7% to see similar real rates again. I can’t imagine that happening in the next decade, let alone the coming years! This gives gold’s current secular bull years left to run before the Fed starts thinking about ending ZIRP.
And at best in today’s secular bull, gold was merely up 7.4x by mid-2011. That compares to a whopping 24.3x in the 1970s secular bull! We have yet to see the gold popular mania that is necessary to kill a secular bull, and the Fed’s massively-inflationary easy-money policies will certainly contribute to its eventual arrival. ZIRP is at least as bullish for gold as QE, and history argues it may be even more so.
So don’t worry about the myopic American futures speculators freaking out every time the Fed says it ought to slow and end QE3 soon. Futures’ extreme leverage forces these guys to have trading time horizons measured in days or weeks, they can’t see the forest for the trees. But eventually they will figure out that they should watch what the Fed is doing rather than merely saying, and they will flood back into gold.
We’ll be ready at Zeal. This year has been the most brutal imaginable for the entire precious-metals realm, painfully testing the mettle of all contrarian investors and speculators. Most have given up and capitulated, leaving gold, silver, and especially their miners’ stocks absurdly cheap. No one is left but the bears, who have foolishly convinced themselves gold is going to spiral lower forever despite enormous QE.
But this is the time to buy low, with the streets drenched in blood. We publish acclaimed weekly and monthly newsletters for contrarians, that follow the stock markets and precious metals and everything that drives them. We buy low when others are afraid then later sell high when others are brave, gradually growing rich in the process. Join us and put our hard-won experience, knowledge, wisdom, and ongoing research to work for you. Subscribe today before everyone else figures out how cheap gold is!
The bottom line is gold’s recurring selloffs this year each time the Fed announces QE3 isn’t going to run forever are the height of hysteria. This is old news, and the gold price had already adjusted to that reality way back in early January. All the selling since was emotional, driven by unsustainable hyper-bearishness. Sooner or later excitable American futures speculators will start watching what the Fed does.
They will realize QE3 is massive beyond belief, with enormous direct Treasury monetizations. They will grasp that the tapering process will take many months to unfold once started, during which the Fed’s balance sheet will continue growing. And they will understand that it will take many years for QE to gradually unwind through maturing bonds. Then they will return to gold with a fervor few can imagine.
Adam Hamilton, CPA
November 22, 2013
So how can you profit from this information? We publish an acclaimed monthly newsletter, Zeal Intelligence, that details exactly what we are doing in terms of actual stock and options trading based on all the lessons we have learned in our market research. Please consider joining us each month for tactical trading details and more in our premium Zeal Intelligence service at … www.zealllc.com/subscribe.htm
Questions for Adam? I would be more than happy to address them through my private consulting business. Please visit www.zealllc.com/adam.htm for more information.
Thoughts, comments, or flames? Fire away at zelotes@zealllc.com. Due to my staggering and perpetually increasing e-mail load, I regret that I am not able to respond to comments personally. I will read all messages though and really appreciate your feedback!
Copyright 2000 – 2013 Zeal Research (www.ZealLLC.com)
In our latest free essay, we focused on silver. We wrote: “the outlook for silver remains bearish and further declines should not surprise us.” On the same day, after the essay was posted, silver declined sharply moving very close to the declining support line that we had featured in that essay. On a side note, it was actually a long-term support line that stopped the decline (for now).
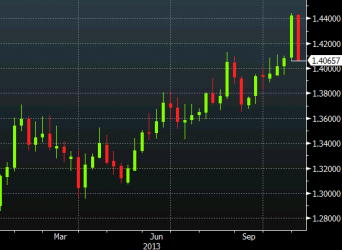
With so much volatility this week, we have decided to zoom out a bit and take a look at the markets from the long-term perspective. Is the final bottom in for gold, silver and mining stocks? We have prepared 3 charts for you today that should help us deal with this issue. Let’s start with the Dow-to-gold ratio (charts courtesy of http://stockcharts.com).

That’s one of the most important and useful ratios there are as far as long- and medium-term trends are concerned. In particular, the big price moves can be detected before they happen (note the breakout in the first months of the year that heralded declines in gold).
In Tuesday’s Market Alert, we wrote the following:
The Dow-to-gold ratio moved above the 12.5 level – to 12.56. The breakout is small and unconfirmed by the moment, but we are one step closer to the next (and probably final) plunge in the precious metals sector.
With the ratio even higher today, we have a good possibility that the breakout will be confirmed and that we will see a big drop in the price of gold in the coming weeks or months.
Having discussed the above, let’s move on to the chart featuring junior mining stocks. This is actually the only somewhat bullish chart that we feature today. This might seem encouraging, until you consider the fact that the previous small breakouts turned out to be fake moves and led to even bigger declines.

In our essay on mining stocks from Nov. 8, we wrote the following:
Although the juniors sector moved above the declining resistance line, we think that it’s still too early to say that the breakout has been truly confirmed – especially when we take into account the position of the RSI.
Please note that the last two times when the indicator reached these levels, major medium-term tops were formed. Therefore, we would need to see a verification of the breakout first to view it as an important medium-term signal. This would be the case in any other breakout as well, but in case of the above chart, waiting for a verification seems particularly justified because we have already seen a false breakout at the beginning of this year – one which was followed by a significant decline in the entire precious metals sector.
Since we wrote the above, juniors have declined (in the preceding two weeks and also this week) and they look like they are about to invalidate the previous breakout, which would – naturally – have bearish medium-term consequences for the entire precious metals sector.
If the decline that we are likely to see in the precious metals sector takes juniors back below their declining red support/resistance line, we will have one more indication that the next major move will be to the downside.
Please note that in case of the junior mining stocks the next significant support is much below the current value of the TSX Venture Index, so the coming decline will likely be very significant.
Finally, we would like to discuss the current situation with the gold-stocks-to-gold ratio.

On the above chart, we see that the situation has deteriorated in recent days. Since the beginning of the week, the HUI-to-gold ratio has declined and hit a fresh monthly low on Thursday. Despite this drop, the gold-stocks-to-gold ratio is still above its previous 2013 lows.
From this perspective, the downtrend remains in place, and it will remain in place as long as the HUI-to-gold ratio stays below the declining resistance line. Since the ratio is not that close to it, it doesn’t seem that we will see a breakout soon. In fact, we don’t expect to see one before another major plunge in the precious metals sector.
Summing up, the final bottom for the decline in gold, silver and mining stocks doesn’t seem to be in just yet. Consequently, jumping in with both feet into the gold market might not be the best idea right now. Still, when and how that bottom is reached is a different matter and we encourage you to keep an eye out for technical signs that could help you not only enter the market at the right moment, but perhaps make money also while metals and miners decline.
To make sure that you are notified once the new features are implemented, and get immediate access to our free thoughts on the market, including information not available publicly, we urge you to sign up for our free gold newsletter. Sign up today and you’ll also get free, 7-day access to the Premium Sections on our website, including valuable tools and charts dedicated to serious Precious Metals Investors and Traders along with our 14 best gold investment practices. It’s free and you may unsubscribe at any time.
Thank you for reading. Have a great and profitable week!
Przemyslaw Radomski, CFA
Founder, Editor-in-chief
Gold Price Prediction Website – SunshineProfits.com
* * * * *
About Sunshine Profits
Sunshine Profits enables anyone to forecast market changes with a level of accuracy that was once only available to closed-door institutions. It provides free trial access to its best investment tools (including lists of best gold stocks and silver stocks), proprietary gold & silver indicators, buy & sell signals, weekly newsletter, and more. Seeing is believing.
Disclaimer
All essays, research and information found above represent analyses and opinions of Przemyslaw Radomski, CFA and Sunshine Profits’ associates only. As such, it may prove wrong and be a subject to change without notice. Opinions and analyses were based on data available to authors of respective essays at the time of writing. Although the information provided above is based on careful research and sources that are believed to be accurate, Przemyslaw Radomski, CFA and his associates do not guarantee the accuracy or thoroughness of the data or information reported. The opinions published above are neither an offer nor a recommendation to purchase or sell any securities. Mr. Radomski is not a Registered Securities Advisor. By reading Przemyslaw Radomski’s, CFA reports you fully agree that he will not be held responsible or liable for any decisions you make regarding any information provided in these reports. Investing, trading and speculation in any financial markets may involve high risk of loss. Przemyslaw Radomski, CFA, Sunshine Profits’ employees and affiliates as well as members of their families may have a short or long position in any securities, including those mentioned in any of the reports or essays, and may make additional purchases and/or sales of those securities without notice.

-
I know Mike is a very solid investor and respect his opinions very much. So if he says pay attention to this or that - I will.
~ Dale G.
-
I've started managing my own investments so view Michael's site as a one-stop shop from which to get information and perspectives.
~ Dave E.
-
Michael offers easy reading, honest, common sense information that anyone can use in a practical manner.
~ der_al.
-
A sane voice in a scrambled investment world.
~ Ed R.
Inside Edge Pro Contributors

Greg Weldon

Josef Schachter

Tyler Bollhorn

Ryan Irvine

Paul Beattie

Martin Straith

Patrick Ceresna

Mark Leibovit

James Thorne

Victor Adair