
Until one of these lines in the sand get broken, there is just no compelling reason to place a directional trade in the precious metals market.
Gold & Precious Metals
Mining Stocks‘ and Euro‘s Implications for Precious Metals
In our essay on gold price in November we examined the long- and the-short-term outlook for gold to check whether it confirm the indications for silver and mining stocks or not. As we wrote in the summary:
(…) the medium-term outlook for gold remains bearish and, at this time, the short-term outlook is bearish as well. It seems that the precious metals sector reversed direction this week right after moving to the declining resistance lines. (…) From this point of view, it might be the case that the next major downleg has already begun and it seems likely that we will see at least a short-term downswing shortly.
Since that essay was published, gold dropped below $1,340 and almost reached an important support level at $1,300. The yellow metal has lost about 3% since Oct. 28 and has logged its longest losing run since mid-May when it dropped 8% in seven days. Additionally, we also saw drops in case of silver and mining stocks.
From today’s point of view we see that this decline was triggered (as it was likely to happen anyway, based on technical reasons) by doubts over when the U.S. Federal Reserve would begin scaling back its stimulus measures. Although the Fed left its $85-billion-a-month asset purchase program in place following its monthly policy meeting, it didn’t give clear indication whether it would start scaling back stimulus at the December meeting or continue it into the start of 2014.
Therefore, investors still look out for U.S. data reports to gauge if they will strengthen or weaken the case for the Fed to reduce its bond purchases. As is well known, if you want to be an effective and profitable investor, you should look at the situation from different angles and make sure that the actions that you are about to take are justified based on each of them, or at least based on a majority of them. That’s why in today’s essay we examine the Euro Index and the HUI Index (along with its performance relative to gold) to see if there’s anything on the horizon that could drive the precious metals market higher or lower. We’ll start with the Euro Index chart (charts courtesy byhttp://stockcharts.com).
Click on image or HERE for larger view:

Looking at the above chart we see that the long-term downtrend remains in place. Additionally, it seems that the short-term uptrend might already be over. In the previous week, the RSI bounced off the 70 level, which was a bearish sign. At the same time the Euro Index moved very close to the strong resistance created by the declining resistance line, but it didn’t break above it. This show of weakness in combination with the position of the RSI triggered a heavy decline and the European currency dropped below the 135 level. Earlier this week, the euro extended declines and it seems that the downward move is not limited at the moment.
At this point, we would like to emphasize one important fact: the previous tops (in 2008 and then in 2011) were followed by major declines in the precious metals sector. If history repeats itself we may see similar price action in this situation.
Having discussed the current situation in the European currency, let’s take a look at our Correlation Matrix – a tool designed to measure, present and provide interpretations of correlations between various parts of the precious metals sector and key markets that impact it – specifically, at the USD Index and the general stock market.
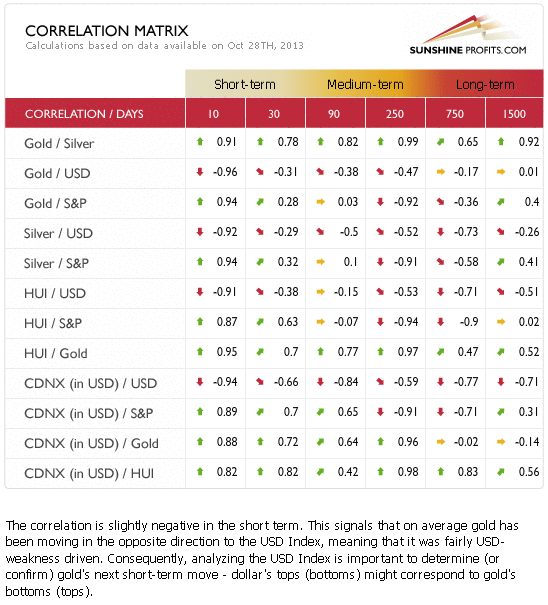
In the previous week we saw a return to normalcy in case of the short-term coefficients. The precious metals sector responded negatively to changes in the USD Index and positively to changes on the general stock market. However, taking into account the situation in the Euro Index, we clearly see that the long-term resistance triggered a medium-term downward move. Therefore, we will focus on the medium-term correlations.
The correlation coefficients between USD Index and precious metals are clearly negative when we take the last 250 and 750 trading days into account and it seems that a big decline in the Euro Index could trigger a decline in the precious metals, as it would very likely mean a major move up in the USD Index.
Once we know what the current situation in the Euro Index, let’s move on to the HUI Index and try to find out what kind of impact the mining stocks can have on gold’s future price.
Click HERE or on Chart for Larger Image:

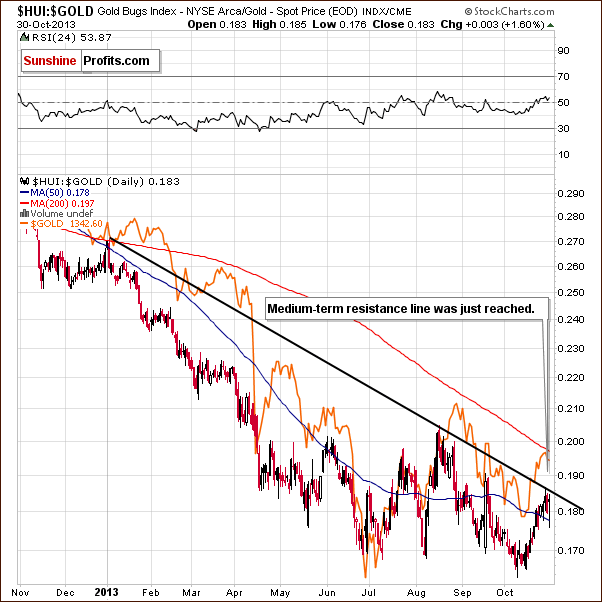
On the above long-term chart we see that the HUI Index reached its medium-term declining resistance line in the previous week.
At this point it’s worth noting that we also saw similar price action in the case of gold and silver. Therefore, implications are bearish and the trend remains down. Please note that we still expect that the HUI Index will move to the 150 level or very close to it.
Before we summarize, let’s turn to our final chart – the gold stocks:gold ratio. After all, gold stocks used to lead gold both higher and lower for years (not in the very recent past, though).
Looking at the above chart featuring gold stocks performance relative to the underlying metal – gold, we clearly see that the ratio reached its medium-term resistance line (similar to what we saw in case of gold, silver and the HUI index), but there was no breakout above this line, which is a medium- and short-term bearish factor.
Although we saw an invalidation of the breakdown below the previous 2013 low, the long-term trend remains unchanged – we have the ratio below the 2008 low and the breakdown below this low was already confirmed.
Summing up, looking at the current situation in the Euro index we see that the implications for the precious metal market are no longer bullish in the short term as currencies have already reversed and the USD Index has done so at the cyclical turning point. It might be the case that we are looking at the very early days of a major downswing in the Euro Index and a rally in the USD Index. Taking this into account and combining it with the medium-term outlook for the mining stocks, it seems that the medium term trend in the precious metals market remains down.
Thank you for reading. Have a great and profitable week!
Przemyslaw Radomski, CFA
Founder, Editor-in-chief
Gold Price Analysis Website – SunshineProfits.com
* * * * *
Disclaimer
All essays, research and information found above represent analyses and opinions of Przemyslaw Radomski, CFA and Sunshine Profits’ associates only. As such, it may prove wrong and be a subject to change without notice. Opinions and analyses were based on data available to authors of respective essays at the time of writing. Although the information provided above is based on careful research and sources that are believed to be accurate, Przemyslaw Radomski, CFA and his associates do not guarantee the accuracy or thoroughness of the data or information reported. The opinions published above are neither an offer nor a recommendation to purchase or sell any securities. Mr. Radomski is not a Registered Securities Advisor. By reading Przemyslaw Radomski’s, CFA reports you fully agree that he will not be held responsible or liable for any decisions you make regarding any information provided in these reports. Investing, trading and speculation in any financial markets may involve high risk of loss. Przemyslaw Radomski, CFA, Sunshine Profits’ employees and affiliates as well as members of their families may have a short or long position in any securities, including those mentioned in any of the reports or essays, and may make additional purchases and/or sales of those securities without notice.

At the moment gold is at a critical crossroads. If it can move above $1,375, it will confirm that an intermediate degree bottom occurred last month at $1,251, and start a pattern of higher highs. If however gold continues lower and breaks below the $1,251 level it will confirm that an intermediate degree decline is still in progress and the recent bounce was nothing more than another bull trap to work off the short-term oversold levels.
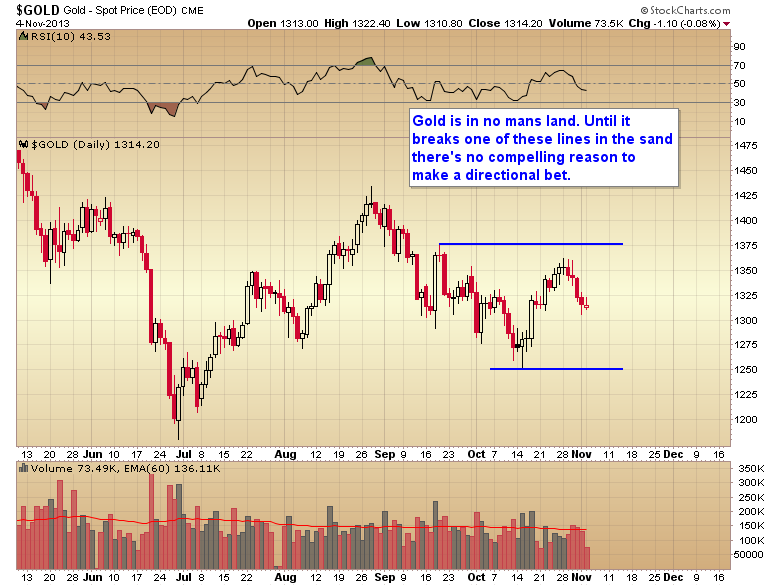
Actually, based on my cycles analysis, I think we can even narrow the band a little tighter. If gold can move above the Oct. 28 high at $1,361 over the next several days, it would confirm that this daily cycle has become right translated and complete a new pattern of higher highs and higher lows.
If, however, gold moves below Friday’s half cycle low of $1,305 it would confirm that the daily cycle has topped in a left translated manner and the odds would then be very high that the October low at $1,251 is going to be broken over the next 2-3 weeks.

The Indian government has restricted the importation of gold. So Indians have switched to silver:
“Starved of gold, Indians may import record volumes of silver
(Reuters) – Indian silver imports are on pace to hit a record high this year as the wedding and festival season drives up buying of the precious metal instead of the traditional gold, made scarcer and dearer by official measures aimed at cutting the trade gap.
Higher silver demand in the world’s biggest buyer may help support prices, which have fallen almost 30 percent this year on the international market and are on track for their biggest annual drop in almost three decades.
The increase in buying is unlikely to spark a fresh policy response from authorities, as in the case of gold, since the value of silver that is imported is far lower than that of gold and therefore not critical to the trade balance.
“There has been a massive improvement in silver imports and we will continue to see more. Investors are taking advantage of lower prices and the lack of restrictions on silver imports as of now,” said Harmesh Arora, director with the Bombay Bullion Association.
According to the GFMS metals consultancy, India imported 4,073 tonnes of silver from January to August, more than double the 1,921 tonnes in the whole of 2012, when a jump in prices in the peak season hurt demand. The record high was 5,048 tonnes in 2008.
India, also the world’s biggest buyer of gold, has raised the import duty on bullion three times this year, taking it to 10 percent, and in July the government told importers that a fifth of their purchases would have to be turned around for export, leaving only 80 percent for domestic use.
SECOND CHOICE
The import duty on silver was also raised to 10 percent in August from 6 percent, but prices remain far apart: gold is about 60 times more expensive than silver in dollar terms.Gold has a special place in Indian culture, bought as a hedge against inflation and traditionally used for gifts at weddings and festivals. Silver does not enjoy the same status.
The value of silver imports in 2012 was $1.8 billion, whereas gold imports cost $52 billion. Even record shipments of silver are therefore unlikely to put any strain on the trade deficit, in contrast to the impact of gold, which is India’s second-biggest import item after oil.
For now, much of the silver flooding in is finding its way to rural areas, where industry officials expect a surge in disposable incomes after a bountiful monsoon boosted agricultural harvests.
Some thoughts
Here’s a chart showing Indian silver imports since 2008. Note how they plunged in 2012, which might have had a bit to do with silver falling by over half from its $50 high.
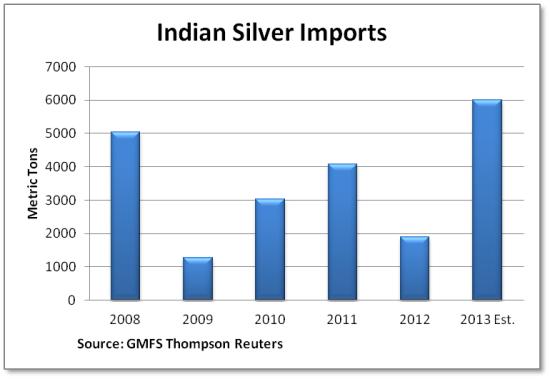
There are about 32,000 ounces in a ton, so India’s projected 2013 imports of 6,000 tons is nearly 200 million ounces. The total annual supply of silver is a billion ounces (750 million ounces from mines, 250 million from recycling). So 200 million ounces is 20% of total global supply – a lot of silver for just one country.
According to the Silver Institute, industrial users (including jewelry makers) absorb about 850 million ounces of silver each year, which leaves 150 million ounces for investors. But by importing 132 million more ounces this year than last, India is taking almost all of that surplus for itself, leaving the rest of the world’s silver bugs to scramble for what little is left.
Also interesting is the fact that silver is so cheap that a doubling of imports has a negligible impact on India’s balance of trade and therefore probably won’t attract the ire of regulators. So from a policy standpoint, restricting gold imports is working and will likely continue. That means the current level of silver demand might be sustained. Wonder where all the extra silver will come from?
ALSO ON DOLLARCOLLAPSE.COM
-
Another Reason to Worry About China 10 comments
-
Mass Delusion and the Myth of Deleveraging 22 comments
-
China Enjoying Gold Clearance Sale 23 comments
-
China’s Appetite for Gold: “Waning” or Surging? 4 comments

-
I know Mike is a very solid investor and respect his opinions very much. So if he says pay attention to this or that - I will.
~ Dale G.
-
I've started managing my own investments so view Michael's site as a one-stop shop from which to get information and perspectives.
~ Dave E.
-
Michael offers easy reading, honest, common sense information that anyone can use in a practical manner.
~ der_al.
-
A sane voice in a scrambled investment world.
~ Ed R.
Inside Edge Pro Contributors

Greg Weldon

Josef Schachter

Tyler Bollhorn

Ryan Irvine

Paul Beattie

Martin Straith

Patrick Ceresna

Mark Leibovit

James Thorne

Victor Adair