
Gold & Precious Metals
I’d like to clarify my position on gold:
First, it’s bottoming. I can’t tell you precisely when or at what price, but I have every reason to believe that gold is now in the timeframe for a bottom, and a major bottom at that.
In fact, it may have already bottomed at $1,178 back in late June. That is possible. Or it may dip back to near $1,178 one last time, soon, or even after a big rally. Or it may just explode higher here and now.
It is impossible for me to say with any certainty. For anyone to say, actually.
All I can tell you is, again, that all of my models indicate that gold is very near, or already may have seen, an important bottom.
Second, trying to time the exact day or even the exact week, and the exact price, would simply be foolish.
That said, let me give you the three scenarios I see for gold. If it seems like I am talking out of both sides of my mouth, let me assure you that I am not.
I am merely giving you the three most likely scenarios for gold going forward, scenarios you will need to keep in mind to get properly positioned so you can minimize risk and maximize potential profits.
 To invest or trade gold now without having these scenarios in mind is simply foolish.
Scenario #1: Gold’s low at $1,178 in late June was the major bottom. In this scenario, gold must now confirm it by moving and closing above $1,449.50 on a Friday, weekly basis followed by a weekly close above $1,605.50.
So far, gold has taken out important short-term resistance at the $1,338 level. That does indeed imply a further rally, with the next important level of resistance at the $1,400 level, followed by $1,449.50.
This is now becoming the highest probability projection. But, still, as in life, nothing is certain, so we must keep an open mind toward …
Scenario #2: Gold continues to rally, as high as $1,605.50, but fails to close above $1,449.50 or $1,605.50 on a weekly closing basis. Gold then trades back down, even as low as the $1,265 level in early 2014, and then begins another move higher, one that eventually gives us the “buy” signals we need to confirm the end of the bear market and the beginning of the next leg up. The $1,178 June 2013 low holds, but gold swings wildly before taking off for good.
Scenario #3: Gold continues to rally, as high as $1,605.50, but fails to close above $1,449.50 or $1,605.50 on a weekly closing basis and then collapses into a major new low in 2014.
Whereas a new low below $1,178 was the highest probability before, it is now the lowest probability scenario. But we simply cannot throw it out the window.
In this scenario, we see a decent rally in the weeks ahead, but it fails to issue major confirming “buy” signals and, instead, trades lower as in Scenario #2 above.
But instead of holding major support at the $1,265 level early next year, gold crashes right through the June 2013 low at $1,178 and makes a new low down at major system support at the $1,035 to $1,050 levels.
Now, I fully realize you might not like anything I just told you, that you think I’m hedging my gold forecast or talking out of both sides of my mouth. Or that you like Scenario #1, the most bullish, and you don’t like, or agree, with the other two scenarios.
That’s OK. I am not trying to win a popularity contest. I am not here to tell you what you want to hear. My job is to tell you what I see ahead based on my tried-and-true models and indicators, and without any bias.
I always call ‘em like I see ‘em, and precisely the way I would put my own money on the line, which brings me to …
What should you do now in gold? In silver? In mining shares?
As you can tell from the above three scenarios, we are likely to see gold now rally into year-end, and as high as $1,605.50 or even higher.
That sounds really exciting, right? Heck, if that kind of rally were to materialize, it would be gold’s best performance in almost three years.
But as I’ve shown you, unless gold closes above $1,449.50 and $1,605.50 on a Friday closing basis, then the gold rally would be for naught, it would be nothing but a bear market rally. And if you loaded up too much on gold, it would backfire on you.
So instead, now is merely the time to begin to test the waters. You don’t go all in, you don’t over commit, you don’t become impatient, and you don’t get overly emotional.
You map out your strategy based on all the evidence and data you have, and then you focus most of your energy on controlling the unknowns, your risk. That’s how the most successful investors and traders make the most money, by controlling — and, indeed, insuring against — the unknowns.
For gold, that means long-term investors can start buying gold again, lightly, committing at this time, no more than 5 percent of your funds available for investing in gold, being fully aware that we do not have full confirmation yet that the low has been made. Testing the waters with up to a 5 percent position will help limit your risk.
For traders, you trade leverage positions, but hedge your bets with limited risk inverse ETFs, with options, or even spread your futures strategy both long and short. Basically, you put yourself in a position to profit from a rally from a bottom in gold if we have already gotten it, yet you take out some insurance in case you’re wrong.
As for silver, this may or may not surprise you, but I would continue to steer clear of the metal. There is a chance silver has not bottomed yet, even if gold has. Hard to believe, I know, but that is what my models are telling me.
For mining shares, my models tell me they have not yet bottomed. Again, hard to believe, but most mining-share ETFs have taken out that important cyclical low they made back on Aug. 6. That means lower lows are possible.
So, like silver, it is indeed possible that mining shares may still move lower, even if gold has already bottomed and even if gold stages a decent rally. Hard to believe, yes, but that’s what my models are telling me, and I never deviate from what they say. They have proven themselves over and over, time and time again. So, for now, mining shares are not yet primed for major investment.
Right now, I urge patience and emotional discipline. Those are always the two most important elements of successful trading and investing, especially near major market turning points.
Major market turning points offer tremendous opportunities for profit, but they are also the most dangerous. The markets never take any prisoners, so you want to make sure, through patience and emotional discipline, that you’re not going to be one of its victims.
Stay tuned to all of my writings during this critical juncture.
Best wishes,
Larry

The precious metal market has been stuck in a strong down trend since 2012. But the recent chart, volume and technical analysis is starting to show some signs that a bottom may have already taken place.
This report focused on the weekly and monthly charts which allow us to see the bigger picture of where the precious metals sector stands in terms of its trend.
Let’s take a look at a few charts below for a quick overview, but if you want more interesting ones visit: https://stockcharts.com/public/1992897
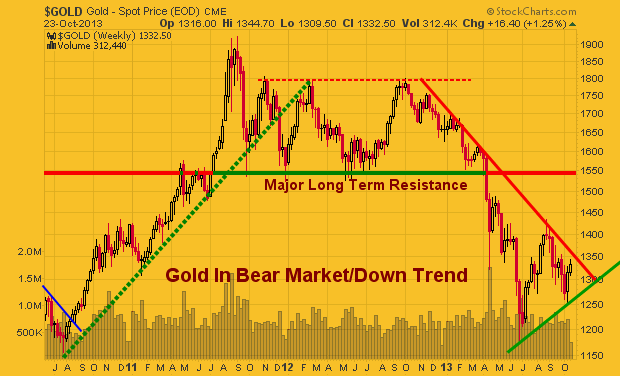
Gold Spot Price – Weekly Chart
This chart clearly shows the trends which gold has gone through in the last three years. With simple technical analysis trend lines, clearly price is nearing a significant apex which will result in a strong breakout in either direction.
Remember, this is the weekly chart, so we could still have another month or three of sideways chatter to work through. But a breakout in either direction will trigger a large move.
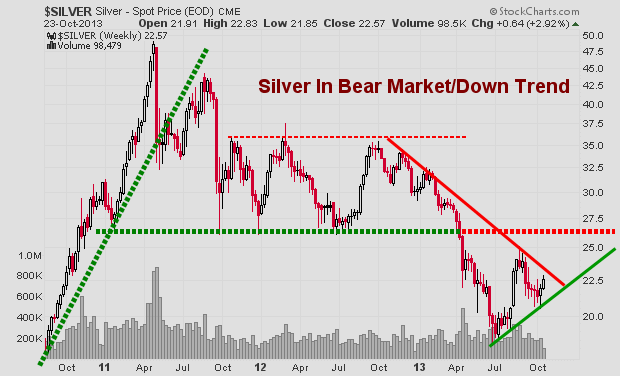
Silver Spot Price – Weekly Chart
Silver is also stuck in a similar pattern. Currently the odds still favors lower prices and for the upper resistance trend line to reject price and send it lower. But if we keep out eye on the leading indicators like gold miners, we may be able to catch a breakout or traded the rejection of resistance in the next month or so.
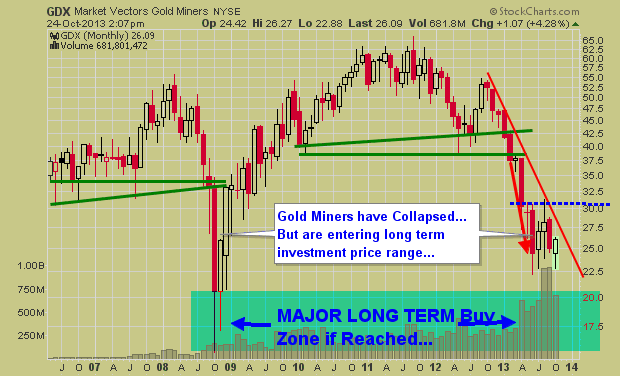
Gold Mining Stock ETF – Monthly Chart
Gold miners have a very sloppy looking chart. Price is extremely volatile and the recent price action in 2013 could go either way VERY quickly. I have a gut feeling GDX in the coming months could have a washout bottom and tag the $20 price level. While I hope I am wrong for many investors sake, if it does happen, it will be a very strong investment level to accumulate a position.
Precious Metals Bigger Picture Outlook:
In short, I remain neutral – bearish for this sector. In the next 1-3 months we are likely to see some strong price action which will be great. We need a breakout or bottoming pattern to form before we get involved at this level.
I know everyone is dying to get involved in precious metals again for another huge rally… but sometimes it’s just best to wait for the big picture chart to catch up with your bias before taking a position of size.
Get My Free Weekly Trading Sector Reports
Delivered To Your Inbox: www.GoldAndOilGuy.com
This entry was posted on Thursday, October 24th, 2013 at 2:56 pm and is filed under blog, ETF Trading Newsletter, Gold Bullion, Gold bullion forecast, Gold ETF Analysis, Gold Forecasting, gold forecasting service, Gold Newsletter, How To Trade Gold, silver, Silver Analysis, Silver ETF Analysis. You can follow any responses to this entry through the RSS 2.0 feed. Both comments and pings are currently closed.

Four of the largest gold refineries on earth are located in Switzerland, being Metalor, Pamp, Argor-Heraeus and Valcambi. It’s estimated 70 % of the world’s refining is done near the Alps, therefor massive amounts of gold are distributed here; Switzerland has imported 808 tons of gold in the third quarter of 2013, and exported 680 tons in this period. Year to date import is 2420 tons, and export 2184 tons. Switzerland has never exported this much gold in 9 months, or in 12 months, the yearly total estimate is 2912 tons. I dare to say more than 1100 tons of this will hit the Chinese shores, wether it be Hong Kong or any other port.
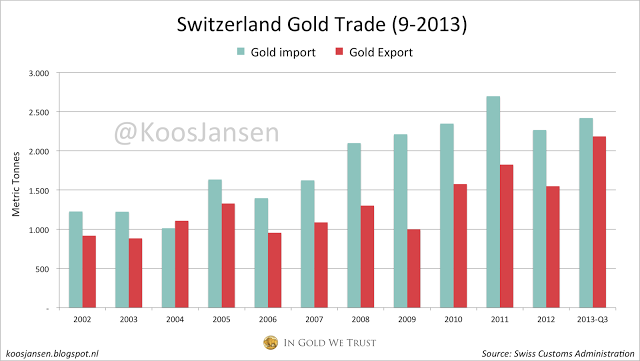
We know Hong Kong has net imported, in between January and August, 598 tons from Switzerland. Much of this is sent forward to Shanghai, but the Chinese are also importing directly from the Swiss. We know this from SGE physical deliveries and from Alex Stanczyk, Chief Market Strategist at Anglo Far-East Bullion, who I interviewed a couple of months ago. He told me China imports a lot that’s not going through Hong Kong (or through the SGE!).
Our firm has got personal experience dealing with the guys that transport the gold, the security companies. One of our partners had lunch in the recent past with the head of the largest global operations company in security transport. He said there is a lot of gold that they’re moving into China that’s not going through exchanges. If the gold is for the government they don’t have to declare where it’s going. They don’t have to declare where it’s going in, or where it’s heading. If you look at the way the Chinese do things, why would they tell?
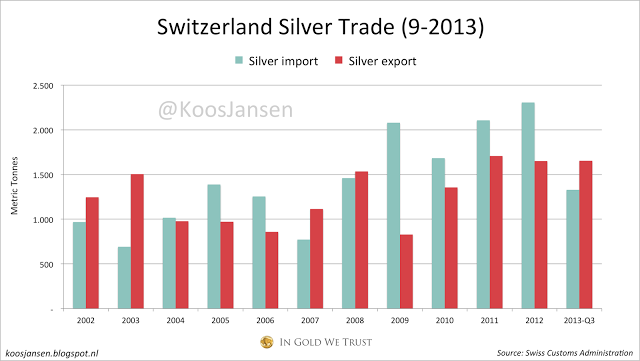
Given the fact the Gold/Silver ratio is 59 currently, silver data from the Swiss looks a bit pathetic, but for all you silver bugs I made a chart! In the third quarter of this year the Swiss imported 545 tons of silver and exported 608 tons. Year to date import is 1328 tons, export 1653 tons.
The Other Precious Metal Can Double Your Money Now
At times like this, gold and silver typically grab all the attention… and attract all the “safe” money. But there’s another metal that could blast past both of these, virtually overnight.
That’s because it has unique physical properties for which there is just no substitute – something its biggest consumers lose quite a bit of sleep over.
It’s 15 times more rare than platinum… and 30 times more rare than gold.
And, as you’ll see in the chart below, it hasn’t been this attractive in 13 years.
We’re looking at a 70% gain on this one – perhaps more – no matter how far Washington kicks the “debt can” down the road.
At current prices, it could even double…
Palladium: The Double-Your-Money Metal
Even when the government isn’t on the brink of financial suicide, palladium is in heavy – and growing – demand.
It’s found in everything from jewelry to dental equipment, including a wide range of electronics.
Tablets, flat screen TVs, iPhones, iPods, iPads, iEverythings…
They all require palladium.
Electronics represent 12% of gross palladium demand.
For perspective, there were 5.4 billion cell phones on the planet in 2009. By the end of this year, estimates are that there will be 8 billion. It’s going to take a lot of palladium for the world to keep talking, texting, and tweeting.
But its most significant use is in the automotive industry, where fully two-thirds, or 67%, of all palladium is consumed each and every year.
That’s because palladium is found in virtually every single gas-powered vehicle’s pollution-controlling catalytic converter.
And global light vehicle production has been on a tear in the last couple of years, with no signs of abating. 2011 saw 77 million light vehicles produced, and 2012 saw 81 million. This year, it’s expected there will be 85 million units produced, and by 2017, IHS Automotive forecasts 102 million units.
By 2018, China alone will likely be manufacturing and buying about 31 million vehicles annually.
Developed and developing economies alike have adopted increasingly stringent emission control standards, boosting the need for palladium.
There’s little doubt, we’re going to need a whole lot more of this specialized metal.
But it’s not going to be easy…
Global Supply Is Dwindling
What’s crucial to understand about palladium supply is where the metal is actually sourced.
Only about 6.5 million ounces of palladium are produced annually. Recycling, plus sales from a Russian stockpile, supplies the rest, to reach a total 9.8 million ounces each year.
Russia is responsible for fully 44% of the 6.5 million produced ounces and South Africa for 36%. But both of these suppliers face serious output challenges. Norilsk Nickel is responsible for all of Russia’s mined production as a byproduct of nickel production. But Russia’s mined supply has been dwindling, and active mines have seen declining ore grades.
What’s more, only two years ago 775,000 ounces came to market from Russia’s state repository, Gokhran. That was about 8% of world supply. Last year, that number had dropped by 68% to 250,000 ounces. Industry insiders figure those stockpiles may now be totally exhausted, but officially no one can say for sure; Gokhran’s contents are a state secret.
What we do know is that 2012 saw the lowest level of global palladium supply since 2002, suffering a deficit of 1.07 million ounces.
For its part, South African supply is even more challenged. Palladium is produced there as a byproduct of platinum. Numerous South African platinum producers are facing such high costs that they no longer turn a profit. Mines are deeper, power and water are sparse, labor costs are rising, political risks are growing, and work strikes and other stoppages all add up to declining output.
That leaves 14% of mined palladium supply contributed by North America and 6% from a few small players sprinkled across Africa, Australia, China, and the former Yugoslavia.
The ever-dwindling supply of palladium isn’t going entirely unnoticed, of course…
Industry Insiders Are Hyper Aware of the Supply Squeeze
I recently interviewed a mining executive whose company is a primary palladium producer.
He concurred that the fundamentals for palladium demand – thanks to pressure from pollution control and car sales – are very supportive. He also confirmed that Russian and South African supplies face real headwinds.
Morgan Stanley (NYSE: MS) has recently said, “We expect an ongoing and sizable structural deficit in palladium supported by an increase in net auto catalytic converter demand as gross demand from strong vehicle growth and tightening emission standards outpaces recycled palladium supply, especially in China.”
After accounting for investment demand, Morgan Stanley is forecasting a 2013 palladium deficit on the order of 1.013 million ounces.
Besides the deteriorating supply and expanding demand factors I’ve outlined, there are two other catalysts that are primed to ignite palladium prices ahead.
“Double Demand” from ETFs and Short-Sellers
The first is physical, or investment, demand. Since 2007 physically backed palladium ETFs have grown to include 11 such investment vehicles, absorbing nearly 2.2 million ounces from global supply, up from 1.9 million at the outset of 2013. Johnson Matthey PLC (LON:JMAT) has indicated that so far this year palladium ETFs have acquired 339,000 ounces of palladium, on pace to surpass 2012’s 385,000 ounces. And this trend is in motion.
Now a 12th palladium ETF is in the offing, which could be trading on South Africa’s Johannesburg Stock Exchange by year’s end. A wildly successful platinum ETF that began trading there earlier this year has already soaked up 685,000 ounces, representing fully 30% of worldwide ETF holdings. The new palladium offering could well be Act II, further exacerbating the market’s persistent shortfall.
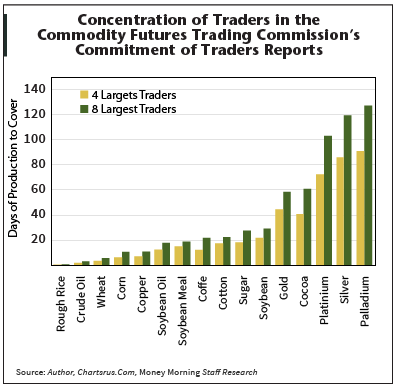 Yet another bullish factor for palladium prices is something intriguing that’s happening in the futures market. As you can see in the chart at right, the eight largest futures traders are short 127 days of world palladium production. That’s at a 13-year high, and it’s more than any precious metal, and more than all other major commodities.
If the palladium price should suddenly rise significantly, those traders would likely be forced to quickly cover their massive short positions.
That could lead to a violent rally in the price of palladium, as they would have to buy long contracts to offset their shorts.
And get this…
Norilsk, the world’s largest palladium producer, also expects a 1 million ounce deficit this year and has repeated their stance that Gokhran is drained of its palladium stockpile, unable to contribute to the market going forward.
The pricing estimates reflect that shortfall, too.
Palladium is currently trading around $710 per ounce. The average of analysts’ forecasts pegs this year’s price at $751, next year’s at $829, and $909 two years out. The most optimistic of these projections sees palladium averaging $1,200 in 2015.
Extremely bullish supply and demand fundamentals, impending growth in investment demand – and the futures “wild card” all point to palladium prices heading up fast, a lot faster than most analysts expect.

-
I know Mike is a very solid investor and respect his opinions very much. So if he says pay attention to this or that - I will.
~ Dale G.
-
I've started managing my own investments so view Michael's site as a one-stop shop from which to get information and perspectives.
~ Dave E.
-
Michael offers easy reading, honest, common sense information that anyone can use in a practical manner.
~ der_al.
-
A sane voice in a scrambled investment world.
~ Ed R.
Inside Edge Pro Contributors

Greg Weldon

Josef Schachter

Tyler Bollhorn

Ryan Irvine

Paul Beattie

Martin Straith

Patrick Ceresna

Mark Leibovit

James Thorne

Victor Adair