
Gold & Precious Metals

Is one last hellish plunge necessary to shake out the weak hands in the Gold Market before it takes off for new highs? In this analysis Rick Acekerman makes the case that the long, frustrating 6 year sideways Gold movement has already done the trick – R. Zurrer for Money Talks
Is gold headed below $1000? I doubt it. Like every other bullion investor who has tired of watching gold’s price meander sideways for nearly six years, I’ve grown increasingly disappointed and frustrated. But also concerned, as many apparently are, that one last, hellish plunge may be necessary to shake out the weak hands. However, looking at the long-term chart, I’m persuaded that bulls still have the edge, if not a big one. That’s because the ‘impulsive’ leap gold took between October 2008 and August 2011 was so powerful, pushing the price of an ounce from $680 to $1912. Although the subsequent retracement took 70% of it back with the $1046 low that occurred in December 2015, bears have been challenged ever since to win the skirmishes that prefigure changes in the long-term trend.
By my analysis, gold ‘should have’ fallen to $821 at its correction low. It could still get there, and that target will remain valid in any event until such time as 1432.50 is exceeded to the upside. But there is nothing in the chart that implies bulls are going to give up that much ground. To the contrary, they took a shot across bears’ bow with a $328 thrust in 2016 that tripped a theoretical long-term ‘buy’ signal at the green line (see inset). The move exceeded no fewer than four ‘external’ peaks on the daily chart, and that’s why the bad guys have struggled so hard to push gold back down. They may be able to crush the spirit of bulls, and to do so repeatedly. But this is not the same as crushing prior lows that continue to provide ‘structural’ and psychological support on the long-term charts.
Set an Alert at 1208
If you want a warning signal that the tide could be turning in bears’ favor, simply watch for downtrends that exceed two or more prior lows on the monthly chart without a significant correction. At the moment, that would imply a sell-off exceeding 1208.60. Even that wouldn’t necessarily mean gold is headed below $1000 — only that we should be especially mindful of downtrending abcd patterns on the lesser charts that start to exceed their ‘d’ targets. That would be warning that the bear is gaining the upper hand. We should also watch for ABCD uptrends that fail to reach their targets. This has actually been happening, and it needs to be monitored. But the effect is not so pronounced as to suggest any more than chronic-but-not-fatal fatigue on bulls’ part. One more thing concerning the big picture: Gold would need to push above 1662 to suggest that a move to the 2278 target is likely. That is a midpoint Hidden Pivot, and unless 1046 is exceeded to the downside, it will remain crucial to price action in the months or even years ahead.

It was an interesting week in the precious metals complex. There appeared to be the start of a short squeeze in Silver (hedge funds were heavily short) but it ceased at important resistance. Meanwhile, Gold closed the week on a weak note, losing $1340-$1350. The gold stocks, like Silver closed the week below technical resistance. The price action in the complex continues to suggest that a breakout in Gold is the key to unleashing strong outperformance from Silver and the gold stocks.
While Silver has very supportive sentiment, it has not broken out from… CLICK HERE

This analyst posits that Silver supply will not be adequate when investment demand surges since the 4th largest Silver producer mine supply down 20%, only two mines supply half Of U.S. Silver Production & the global silver scrap supply has plunged from its 2011 high silver – R. Zurrer for Money Talks
Global silver scrap supply fell to its lowest level in 26 years. World silver recycling in 2017 dropped by nearly 50% since its peak in 2011. According to the 2018 World Silver Survey, global silver scrap supply declined to 138 million oz (Moz) compared to 261 Moz in 2011. While the lower silver price is partly responsible for the large drop in silver recycling, there are other market dynamics.
For example, silver recycling from the photography sector has declined since consumption peaked in 1999. The photography industry was using 228 Moz of silver in 1999 compared to the 44 Moz last year. Thus, silver consumption in photography has declined by 80% in nearly two decades… and along with it, a great deal of recycled silver supply.
Furthermore, a lot of silverware was recycled during the period of rising prices (2007-2012). A lot of Millennials who inherited their parent’s (and grandparents) silverware decided it was much easier to pawn it rather than spending a lot of time polishing it for holiday gatherings. Which means, a lot of available stocks of silver scrap have already been recycled.

As we can see in the chart above, even though the $17 silver price in 2017 was four times higher than in 1991 ($3.91), global silver scrap supply is less than it was 26 years ago. Moreover, world silver scrap was over 200 Moz a year (2005-2009) when the average annual price was much less than it was last year.
Now according to the Metal Focus Silver Scrap Report published in 2015, they forecasted the following percentages of silver scrap from the various sectors:
Industry = 60%
Silverware = 16%
Photographic = 12%
Jewelry = 10%
Coin = 2%
While it is well known that the majority of silver scrap comes from recycling of industrial silver waste, due to the industrial sector being the largest user of silver, jewelry only accounts for 10% but is the second largest consumer. For example, the 2018 World Silver Survey reported that the industrial sector consumed nearly 600 Moz of silver in 2017 while jewelry fabricators used 209 Moz. However, silverware and the photographic sectors only consumed 102 Moz, but account for 28% of silver scrap supply.
What this tells us is that owners of silver jewelry are not that motivated to pawn their silver jewelry because there just isn’t enough monetary value. So, a large supply of potential silver scrap will likely never make it to the market, even at much higher prices, due to the relatively small value of silver jewelry held by individuals.
As for gold jewelry, it’s quite the opposite. Nearly 90% of global gold scrap supply comes from recycled gold jewelry. Thus, a significant increase in the gold price would result in higher gold jewelry recycling, whereas a higher silver price would not generate much of an increase in silver jewelry scrap supplies. So, each year about 200 Moz of silver are used in silver jewelry fabrication, but only a small amount is ever recycled.
Lastly, annual gold scrap accounts for 28% of total global gold supply compared to only 14% for the silver market. Even at much higher silver prices, global silver recycling will not be able to supply enough metal when investment demand surges as the broader markets collapse.
Also from Steve: Two Mines Supply Half Of U.S. Silver Production & The Real Cost To Produce Silver
and
CHILE, WORLD’S FOURTH LARGEST SILVER PRODUCER: Mine Supply Down 20%

A few weeks ago we wrote that it may not be Gold’s time yet but a few recent developments suggest its time could be sooner than we anticipated. Although Gold failed to breakout last week, we should note the positive action in the miners. Over the past seven trading days the miners have strongly outperformed Gold. That includes the juniors, which appear very close to breaking out of the downtrend that has been in effect for over 12 months.
In the chart below we plot the three major junior ETFs: GDXJ, GOEX (explorers) and SILJ (silver juniors). The juniors have trended lower since February 2017 but are now threatening to break trendline resistance. Since December 2017 the juniors have traded in an increasingly tighter and tighter range which indicates a break is coming very soon. Also, note how the 200-day moving averages are flat and no longer sloping lower. That reflects a mature correction and the potential for a new uptrend if the juniors break above resistance in a strong fashion.
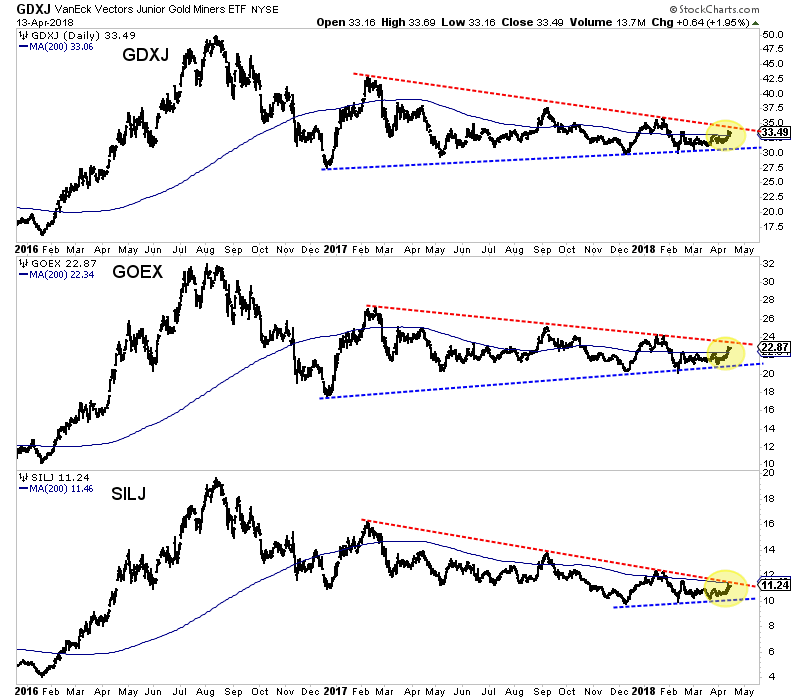
There are a few other things worth mentioning.
First, as we alluded to, GDXJ has strongly outperformed Gold over the past seven trading days. The GDXJ to Gold ratio has reached its highest mark since the start of February. That sudden relative strength is significant considering Gold is within spitting distance of a major breakout.
Second, one custom breadth indicator we track is the percentage of juniors (a basket of 50 stocks) trading above the 200-day moving average. This figure (currently 42%) has not exceeded 51% since February 2017. A strong push above 51% could confirm a renewed uptrend in the juniors.
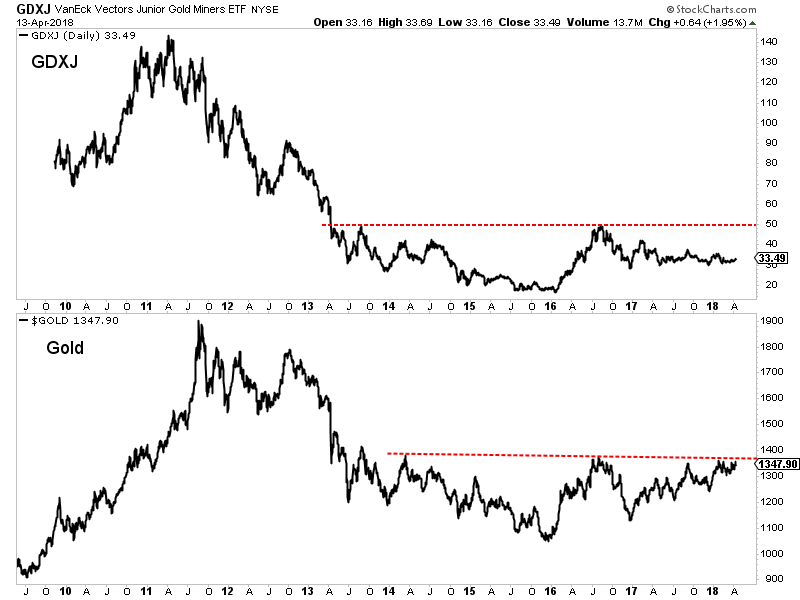
If juniors are going to break out of their downtrends, it could mark the start of potentially a very large move. Gold, upon a breakout through $1375, will have a measured upside target of roughly $1700/oz. Although the juniors aren’t very close to breaking their 2016 high, they, upon a breakout would have similar upside potential. GDXJ, upon a breakout through $50 would have a measured upside target of $83.
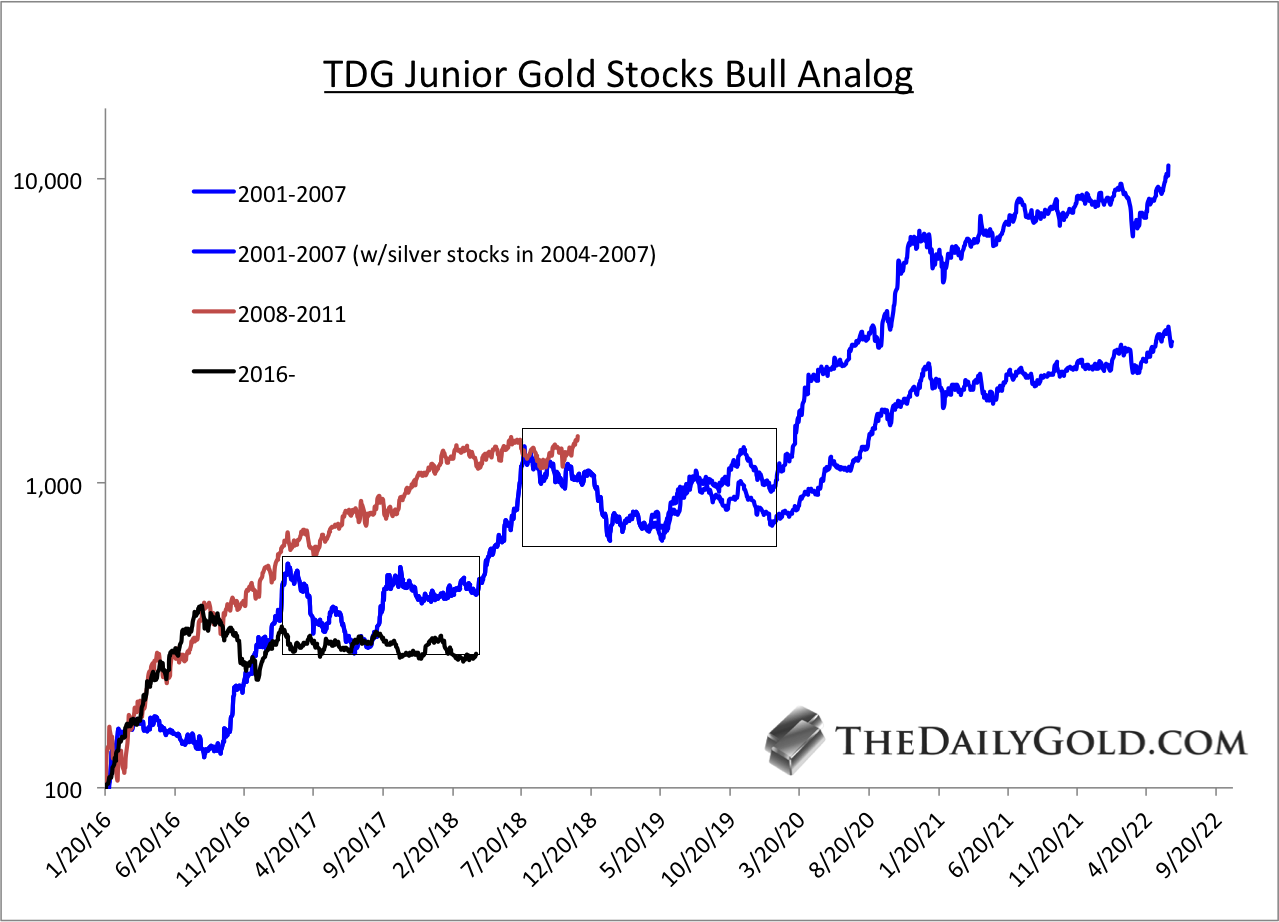
That potential measured upside target for GDXJ may seem extreme but for juniors its par for the course. Below we show an updated chart of our Junior Gold Stocks Bull Analog. By my data, juniors are well below where they were during the 2001-2007 and 2008-2011 bull markets. So if Gold breaks higher and is going to reach $1700/oz then juniors are likely to catch up to historical performance.
Although Gold failed to breakout (again) last week, the performance in the gold stocks did not confirm that failure. The newfound relative strength, if sustained over the next few weeks could signal that a sector breakout is much closer than previously anticipated. The juniors are very close to breaking their downtrend and that break could only be the start of a potentially massive move. In anticipation of that potential move, we have been accumulating the juniors that have 300% to 500% upside potential over the next 18-24 months.

-
I know Mike is a very solid investor and respect his opinions very much. So if he says pay attention to this or that - I will.
~ Dale G.
-
I've started managing my own investments so view Michael's site as a one-stop shop from which to get information and perspectives.
~ Dave E.
-
Michael offers easy reading, honest, common sense information that anyone can use in a practical manner.
~ der_al.
-
A sane voice in a scrambled investment world.
~ Ed R.
Inside Edge Pro Contributors

Greg Weldon

Josef Schachter

Tyler Bollhorn

Ryan Irvine

Paul Beattie

Martin Straith

Patrick Ceresna

Mark Leibovit

James Thorne

Victor Adair