
Gold & Precious Metals
 …. Says Bearish Precious Metal View Was “Incorrect”
Yesterday it was Goldman capitulating on their near-term gold, er, capitulation reco (expectedly so after gold ripped over $75 in the span of 24 hours). Now, it is Bank of America’s turn to close their silver short.
….more commentary and great chart HERE

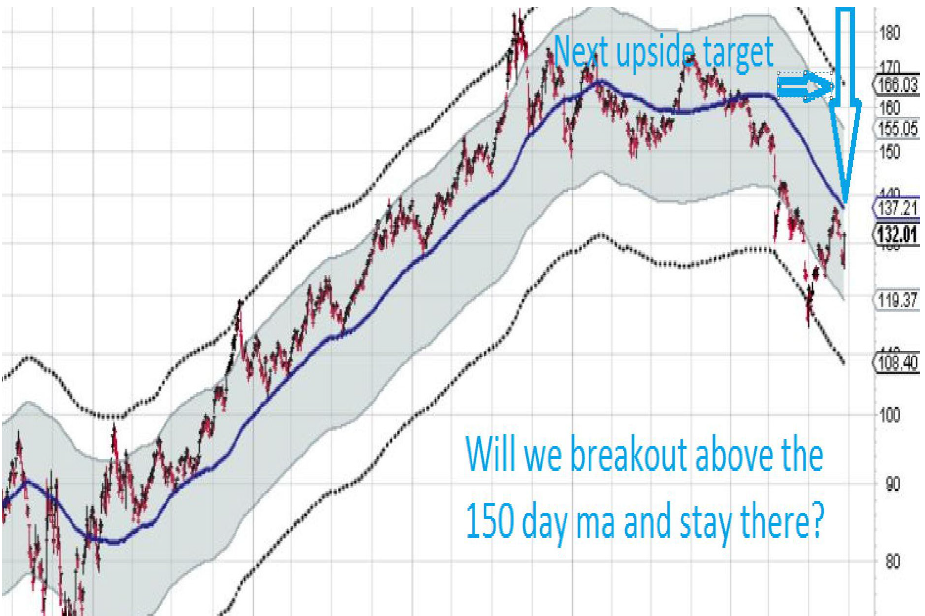
Terry Laundry’s ‘Adaptive Channels’ view of the gold market (herein using GLD as an example) remains the most important chart in terms of defining overall trend. Keep in mind that GLD trades at approximately at 3% discount to the physica metals which explains why we are showing a 132.16 close on Wednesday, September 18 below versus the spot close of 1364.30. In any event, the patterns are all relative. The key, as before, is the important 150 day moving average depicted below by the dark blue line. Trading under that line defines a bear or corrective cycle, while trading above it defines a renewed bull cycle.
The bottom line is these ‘magical’ bands hold the key for gold and a sustainable resumption of the uptrend will not occur until we trade and trend over the 150 day moving average.
Should the undesired event occur and gold nosedives once again the ‘dotted’ band does not show any meaningful support until we reach just under the 107.50 level in GLD or approximately 1100 in the physical market, but let’s take it one step at a time. Stepping back, you know I am very much a long-term unwavering bull on gold and natural resources. That said, I’ve told you that the current rally in gold may only be ‘dead-cat’ bounce, i.e., a corrective bounce well ahead part of the final bottoming process. Indeed, if you look at the two channels above the market, one shows resistance in the 1500s and the one above it in the mid 1600s. Though a desired result, it would be far from new highs. We will know ‘in the fullness of time’!
The above is an excerpt from Mark Leibovit’s 14 page VR Gold Letter. The Leibovit VR Gold Letter arrives weekly via e-mail with alert bulletins as market conditions dictate. “We offer multiple subscription plans to best suit your needs.”
Click below to view subscription plans, pricing and sign up HERE
About Mark Leibovit:
Mark Leibovitwas ranked the #2 U.S. Gold Timer by TIMER DIGEST Magazine for 2011 and held the #1 slot in the first six months of 2011
Mark Leibovit’s career in the financial industry spans more than 35 years, beginning as a market maker on the Chicago Board Options Exchange and the Midwest Options Exchange where he made a market in many issues including Newmont Mining, and continuing on to serve as Director of technical Research at Rodman and Renshaw, later leaving to publish his own stock market research letter currently available at http://www.vrtrader.com. He is both a Certified Investment Management Analyst (CIMA) and Accredited Investment Fiduciary (AIF), and is also a member of the Market Technicians Association and CFA Institute.
Mr.Leibovit’s extensive media television profile includes seven years as a consultant ‘Elf’ on “Louis Rukeyser’s Wall Street Week” television program, and over thirty years as a Market Monitor guest for PBS “The Nightly Business Report”. He also has appeared on Fox Business News, CNBC, BNN (Canada), and Bloomberg, and has been interviewed in Barrons, Business Week, Forbes and The Wall Street Journal.
Mr.Leibovit’s specialty is Volume Analysis and his proprietary Leibovit Volume Reversal Indicator is well known for forecasting accurate signals of trend direction and reversals in the equity, metals and futures markets. He has historical experience recognizing, bull and bear markets and signaling alerts prior to market crashes. His indicator is currently available on the Metastock platoform at http://www.vrplug-in.com.
His comprehensive study on Volume Analysis, The Trader’s Book of Volume was recently released by McGraw-Hill 2011. Mark has appeared in speaking engagements and seminars in the U.S. and Canada and provides customized Volume Analysis for managers and institutions. He publishes a newsletter on the gold, metals and mining markets which can be found at (www.vrgoldletter.com) .
Mr. Leibovit is currently Timer Digest’s #2 Gold Market timer for 2011, and has also been named the #1 Gold Market timer for the 5 year period ending in 2010, and the #1 Intermediate Stock Market timer for the 10-year period ending in 2007.
GOLD has turned bearish last week and made a sharp decline towards 1300 with a personality of an impulsive price action; strong and large move in the short period of time. As such, we believe that metal is in a new bearish period which could bring price even back to June lows. We will be looking lower as long as 1434 is in place. With that said, to take advantage of the current down move it’s important to keep an eye on intra-day wave patterns and any evidences of a corrective or contra-trend patterns that will give you an opportunity to join the trend.
Well, on the hourly we see a sideways movement in tight range which is a very important guideline for a correction, or temporary pause within downtrend. From an Elliott Wave perspective we see current pause as a triangle which is a continuation pattern, most likely placed in wave four. As such, we anticipate trust out of a triangle into wave (v) that could reach levels around 1280 in the next 24-48 hours once 1300 support is taken out.

TRIANGLE-BASIC STRUCTURE
A Triangle is a common 5 wave pattern labeled A-B-C-D-E that moves counter-trend and is corrective in nature. Triangles move within two channel lines drawn from waves A to C, and from waves B to D. A Triangle is either contracting or expanding depending on whether the channel lines are converging or expanding. Triangles are overlapping five wave affairs that subdivide 3-3-3-3-3.

• structure is 3-3-3-3-3
• each subwave of a triangle is ussaly a zig-zag
• wave E must end in the price territory of wave A
• one subwave of a triangle usually has a much more complex structure than others subwaves
• appears in wave four in an impulse, wave B in an A-B-C, wave X or wave Y in a double threes, wave X or wave Z in a triple threes
About the Author
Gregor is based in Slovenia and has been in Forex market since 2003. Most of the charts that you can find on the website is his work. His approach to the markets is mainly technical. He uses a lot of different methods when analyzing the markets; from candlestick patterns, MA, technical indicators etc. His specialty however is Elliott Wave Theory which could be very helpful especially if you know how to use it in combination with other useful tools.
]Website: http://www.ew-forecast.com/


-
I know Mike is a very solid investor and respect his opinions very much. So if he says pay attention to this or that - I will.
~ Dale G.
-
I've started managing my own investments so view Michael's site as a one-stop shop from which to get information and perspectives.
~ Dave E.
-
Michael offers easy reading, honest, common sense information that anyone can use in a practical manner.
~ der_al.
-
A sane voice in a scrambled investment world.
~ Ed R.
Inside Edge Pro Contributors

Greg Weldon

Josef Schachter

Tyler Bollhorn

Ryan Irvine

Paul Beattie

Martin Straith

Patrick Ceresna

Mark Leibovit

James Thorne

Victor Adair