
Gold & Precious Metals

Golds performance has outstripped the booming S&P 500 since the year 2000. Even with dividends reinvested, the soaring Stock Market is still trailing the yellow metal! That’s even with Gold dribbling down $600 since its high of $1920 8 years ago. Definitely time to take a look at Gold’s near and long term potential – R. Zurrer for Money TAlks

In a January post, I showed how the price of gold rallied in the months following the 2015 and 2016 December interest rate hikes—as much as 29 percent in the former cycle, 17.8 percent in the latter. Gold ended 2017 up double digits, despite pressure from skyrocketing stocks and massive cryptocurrency speculation.

I forecast then that we could see another “Fed rally” this year following the rate hike in December 2017. Hypothetically, if gold took a similar trajectory as the past two cycles, its price could climb as high as $1,500 this year.
As I told Kitco News’ Daniela Cambone last week, I stand by the $1,500 forecast. Before last week, investors might have been slightly disappointed by gold’s mostly sideways performance so far this year. But now, in response to a number of factors, it’s up close to 3 percent in 2018, compared to the S&P 500 Index, down 2.4 percent.
Living with Volatility
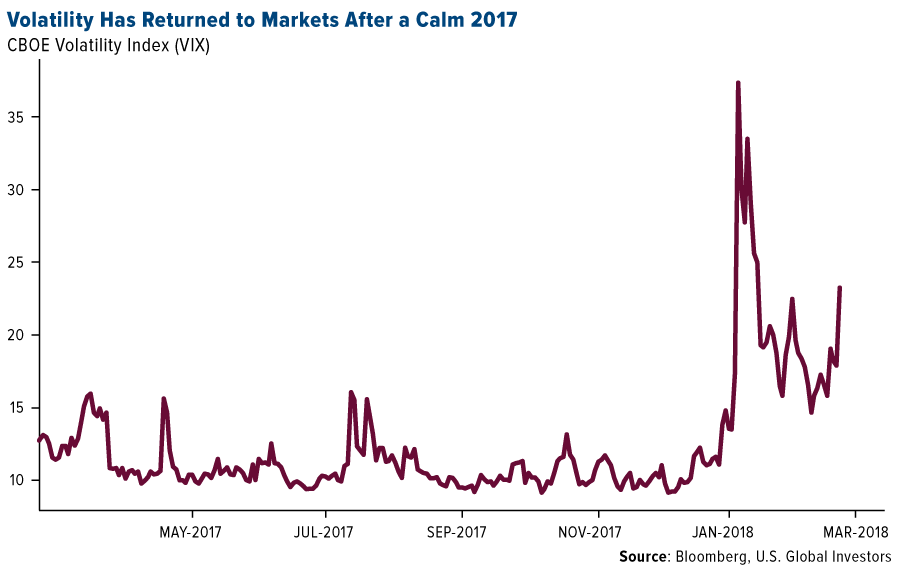
While I’m on the topic of equities, the S&P 500 dividend yield, for the first time in nearly a decade, is now below the yield on the two-year Treasury. Historically, the economy has slowed around six months after dividends stopped paying as much as short-dated government paper. This could spur some stock investors to trim their exposure and rotate into other asset classes, including not just bonds but also precious metals, which I believe might help gold revisit resistance from its 2016 high of $1,374 an ounce.

Volatility has also crept back into markets. It began with the positive wage growth report in February, implying the possibility of faster inflation. More recently, the CBOE Volatility Index (VIX), or “fear gauge,” has surged on the departures of Gary Cohn as chief economic advisor and Rex Tillerson as secretary of state, as well as the application of tariffs on steel and aluminum imports. Last week, President Donald Trump ordered tariffs on at least $50 billion of Chinese goods, stoking new fears of a U.S.-China trade war. In response, the Asian giant proposed fresh duties on as much as $3 billion of U.S. products, including wine, fruits, nuts, ethanol and steel pipes.
As I see it, there could be other contributing factors pushing up the price of gold. A good place to start is with Trump’s recent appointment of former CNBC star Larry Kudlow as White House chief economic advisor.
Kudlow’s Kerfuffle Over Gold
Between 2001 and 2007, I appeared on Kudlow’s various CNBC shows a number of times, and though he always struck me as highly intelligent, informed and accomplished—he served as Bear Stearns’ chief economist and even advised President Ronald Reagan—it was clear he had a strong bias against gold. This was the case even as the price of the yellow metal was on a tear, rising from $270 in 2001 to more than $830 an ounce by the end of 2007.
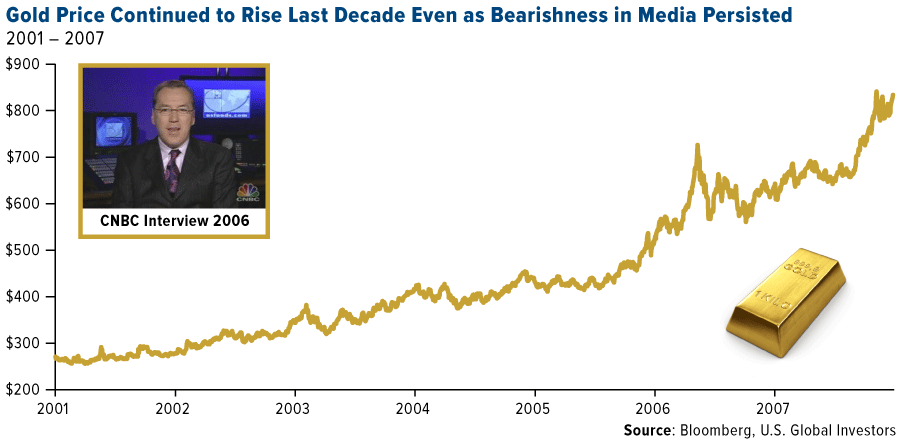
Kudlow showed his true colors toward gold as recently as this month, telling viewers: I would buy King Dollar and I would sell gold. As you can see below, this has’t been a prudent trade for more than a year now.

Earlier this month, Kudlow wrote that falling gold is good, as it “bodes well for the future economy.” He said he agreed with a friend, who called the metal an “end-of-the-world insurance contract.”
While there are those who would agree with him, it’s important to remember that gold is used for much more than as a portfolio diversifier, and its price is driven by a number of factors. These include Fear Trade factors, from inflation to negative real interest rates, and Love Trade factors such as gift-giving during cultural and religious festivals. The precious metal has important industrial applications as well.
And since I first went on Kudlow’s program, gold has outperformed the S&P 500’s price action nearly two-to-one, as I showed you back in December. Even with dividends reinvested, the market is still trailing the yellow metal.

So it’s fine if gold isn’t your favorite asset, but to dismiss it wholesale as Kudlow has again and again is, with all due respect, irrational.
It’s Not About Steel, It’s About Stealing
Kudlow isn’t just anti-gold, however. He’s also anti-China, and even though he’s traditionally opposed tariffs in general, he supports Trump’s efforts to levy taxes on Chinese imports. Specifically, the duties are designed to offset the cost of intellectual property allegedly stolen by the Chinese over the past several years.
China’s J-31 fighter jet, for example, is believed to be a knockoff of Lockheed Martin’s F-35, the most expensive piece of U.S. military equipment. It’s for this reason that Lockheed’s CEO, Marillyn Hewson, was present when Trump signed the authorization to impose new tariffs.

Our intellectual property is hugely important to the U.S. economy. As important as steel and aluminum are, they account for only 2 percent of world trade, and in the U.S., it’s even less than a percent of gross domestic product (GDP). Technology exports, on the other hand, represent about 17 percent of U.S. GDP.
That said, the implications of a trade war with the world’s second-largest economy certainly have many investors concerned—all the more reason to consider adding to your gold allocation at this time. As always, I recommend a 10 percent weighting, with 5 percent in gold bullion, 5 percent in high-quality gold mining stocks and ETFs.
Is Trump Betting on the Wrong Guy?
On a final note, we were pleased to have an old friend visit our office last week. Michael Ding, a veteran of the U.S. Global investments team, joined us to share some laughs and his thoughts on what’s happening in Asian markets right now.
Specifically, Michael said that Ray Dalio, founder of mammoth investment firm Bridgewater Associates, which manages around $160 billion, has become something of an economic guru for members of the Chinese ruling party’s highest-ranking members, including Premier Li Keqiang. Dalio—whose most recent book, Principles, nowtops China’s bestseller list—is reportedly advising the country’s top bankers and economists on how to deleverage safely without triggering a so-called “hard landing.”
A trade war between the U.S. and China, Ray Dalio said recently, would be a “tragedy.”
So to put it in perspective: Whereas Trump has just now brought on Kudlow, the Chinese are leaning on a fellow American, Dalio, one of the smartest, most gifted money managers in the world—not just of our time but of all time.
Did Trump make the right call? Which player would you want on your team: Kudlow or Dalio? For my money, I would pick Dalio.
Learn more about investment opportunities in China by clicking here!
The trade-weighted US dollar index, also known as the broad index, is a measure of the value of the United States dollar relative to other world currencies.
The S&P 500 is a stock market index that tracks the stocks of 500 large-cap companies. It seeks to represent the stock market’s performance by reporting the risk and return of the biggest companies.
The CBOE Volatility Index, known by its ticker symbol VIX, is a popular measure of the stock market’s expectation of volatility implied by S&P 500 index options, calculated and published by the Chicago Board Options Exchange (CBOE). It is colloquially referred to as the fear index or the fear gauge.
There is no guarantee that the issuers of any securities will declare dividends in the future or that, if declared, will remain at current levels or increase over time.
Holdings may change daily. Holdings are reported as of the most recent quarter-end. None of the securities mentioned in the article were held by any accounts managed by U.S. Global Investors as of 12/31/2017.


One look at Stewart’s chart above indicates that we are in a buying zone right here. That leaves the questions what will perform the best and how rising interest rates will effect this market in this 24 point analysis – R. Zurrer for Money Talks
Mar 27, 2018
- I’ve predicted that in 2018 the US stock market would suffer a series of crashes somewhat akin to the 1987 event, but smaller in size.
- Please Double-click the chart above for a larger version of this interesting chart of the US stock market. Clearly, these mini-crashes are starting to happen.
- Having said that, I haven’t sold any of my US bank stocks and I have no plans to do so.
- To understand why I’m still “long and strong” the bank stocks in this environment, please click here now. Bank profits are soaring because of tax cuts, QT, and rate hikes.
- Corporate boards are still using the bulk of the profits for stock buybacks and bonuses for the “fat cats”, while throwing crumbs to the lower-paid workers.
- As disgusting as that is, it’s a good environment to own stock market indexes, and a great environment to own bank stocks.
- This is the stage of the business cycle where “big growth” transitions to “decent growth with inflation”. Simply put, in this environment bank stocks do well, growth stocks stumble, and gold stocks start to get modest liquidity flows from institutions.
- As the cycle moves to “inflation with low growth”, growth stocks crash, bank stocks fade, and gold stocks soar.
- Please click here now. Double-click to enlarge this key T-bond chart. US interest rates are rising now and poised to rise relentlessly for the next several years.
- There are “institutional thresholds” of importance in major markets. For the US stock market, institutions will generally continue to buy stocks until the ten-year yield reaches the 4%-5% range.
- Please click here now. Double-click to enlarge.
- Goldman is predicting four rate hikes this year and I’m predicting a minimum of three. The yield should get close to 4% by the end of this year.
- I realise that most gold bugs are “stock market crash enthusiasts”. There’s no question that the US stock market has soared mainly because the “hot air” of QE and low rates has incentivized corporate boards to focus on stock market buybacks rather than worker wages and business expansion.
- Having said that, patience is required. Investors need to focus on the slow but steady cyclical transition from growth to inflation as the Fed pushes the enormous QE money ball out of government bonds and into the fractional reserve banking system.
- Please click here now. Double-click to enlarge this fabulous daily gold chart. The rectangle pattern is flag-like, and suggests gold is coiling to burst above my key $1370 resistance zone.
- Short term traders who took my recommendation to buy the $1310 area should be sellers in this $1340-$1355 area. That’s because there could be quite a bit more coiling action before a true breakout above $1370 occurs. The bottom line is that investors need to be patient and traders need to book profits now!
- Looking at the big picture, the inflation trade is clearly becoming more positive for gold every day. The Trump decision to appoint John “The Hawk” Bolton to a key post in his administration makes the geopolitical trade for gold a positive one as well.
- What about the love trade? Well, please click here now. The 2019 Indian elections are approaching and the Modi government is likely to win again.
- Modi is backed with “monster money” and to ensure he wins again he’s launching a huge farm income program called MSP. This program is inflationary because it boosts crop prices. That alone is positive for the global price of gold.
- The MSP program also is poised to create a massive boost in farmer income, and rural Indians always use extra income to buy more gold. Please click here now. This MSP policy launch is happening at the same time as the influential Niti Aayog panel pushes the Modi government to implement a massive gold-positive policy agenda.
- I’ve been adamant that 2018 would see the absolute end of gold-negative policy from the Modi government, and the launch of positive policy. That’s clearly in play, and it’s going to exponentially accelerate relentlessly.
- Please click here now. Double-click to enlarge this GDX chart. The technical action is superb, and investors should now be buyers of their favourite GDX and GDXJ component stocks on all two and three-day pullbacks.
- Please click here now. Double click to enlarge. With food inflation set to surge in India and general wage and price inflation on the move in America, it’s time for investors to take a more serious interest in silver stocks. The big upside action won’t start until there’s a volume-based breakout from the bull wedge pattern on this silver stocks ETF chart.
- Call option buyers should wait for that breakout before buying, but all silver stock enthusiasts should be buyers of key SIL component stocks right now. Use two and three-day pull backs to take buy-side action, in preparation for the imminent upside rocket ride!
Thanks!
Cheers
st
Mar 27, 2018
Stewart Thomson
Graceland Updates
website: www.gracelandupdates.com
Stewart Thomson is a retired Merrill Lynch broker. Stewart writes the Graceland Updates daily between 4am-7am. They are sent out around 8am. The newsletter is attractively priced and the format is a unique numbered point form; giving clarity to each point and saving valuable reading time.
Risks, Disclaimers, Legal
Stewart Thomson is no longer an investment advisor. The information provided by Stewart and Graceland Updates is for general information purposes only. Before taking any action on any investment, it is imperative that you consult with multiple properly licensed, experienced and qualifed investment advisors and get numerous opinions before taking any action. Your minimum risk on any investment in the world is 100% loss of all your money. You may be taking or preparing to take leveraged positions in investments and not know it, exposing yourself to unlimited risks. This is highly concerning if you are an investor in any derivatives products. There is an approx $700 trillion OTC Derivatives Iceberg with a tiny portion written off officially. The bottom line:

Gold vs. major stock markets got impulsive to end the week. The case appears to be building, pending the macro relief that will come when fear and angst max out on the short-term – R. Zurrer for Money Talks
If you have followed my work for a while you probably know me as the guy who keeps insisting that the precious metals will not be ready until some strange interplanetary alignment comes into place. That would be the Macrocosm, our handy pictorial (rough) representation of the optimal backdrop for a real bull view on the gold sector.

See the biggest planet out front? Well, gold has started to make some inroads and if the stock market correction proceeds to its worst near-term potentials (options are a hold the 200 day averages and rally, or a decline to a clear SPX gap around 2460, which would open the possibility of a new intermediate downtrend) the gold sector would get a key macro fundamental underpinning. For reference, see today’s article Gold’s Fundamentals on the Move: PM Price Moves Should Follow.
In that article, we look at one economic/market cycle indicator on the verge of going negative. That is the ratio of gold (counter-cyclical) to Industrial Metals (cyclical).

But I would like to excerpt some of NFTRH 492’s Precious Metals segment for eLetter readers to expand on the theme. The segment also went on to discuss gold and silver prices, CoT data (silver is now very compelling from a contrarian perspective) and review 29 daily charts of miners that I have interest in.
Precious Metals
This space has been parroting over and over again that as long as risk is ‘on’ in the macro, as long as gold under performs stocks, oil, materials and the things of human hopes (a term I used to use a decade or so ago was “human hopes for prosperity”) then the sector is not ready. On that note, if you have time check out this article I wrote as published at GoldSeek back in October, 2008 if you have the time [I found it when searching for my own “human hopes” term. It was published 2 weeks after NFTRH’s September 28th 2008 launch].
The Next Bubble?
Thanks to a subscriber for forwarding this graph of gold priced in “human hopes for prosperity”proxy Wages/Gold. There was a distinct upturn in this indicator after gold began its bear market in 2012. The ratio was driven by gold’s decline. But even as of May 2017 the ratio was losing momentum and rolling over. It is a minor indicator, but a positive one [for the gold sector] if it breaks down. While the data are a bit dated, the point is that throughout the recovery workers are not exactly rejoicing at their standing within the macro. It is favorable for gold’s bull case when people feel insecure rather than happy.

The precious metals and in particular the miners are very interested to see whether the macro event taking place right now is going to evolve to something maxi from its current mini standing. A break of the stock market’s 200 day moving average brings us further toward maxi and a breakdown into a bear market trend puts the gold sector front and center… and in MAXI mode from macro fundamental (gold/stocks, gold/cyclical assets, gold/human hopes, etc.) and sector fundamental (gold/energy, gold/materials, etc.) perspectives.
We reviewed SPX/Gold on page 10. It’s in breakdown mode. We also reviewed Industrial Metals & Palladium/Gold; also in breakdown mode. Let’s get a wider view on the macro/sector fundamentals.
Gold vs. major stock markets got impulsive to end the week. It had already been constructive vs. European, UK and Japanese markets. But what a real gold bull market looks like is a thing that is uniform, across the board in ref. to the world of risk ‘on’ assets. The daily chart is a start…

Aside from the aforementioned gold, silver, miners and CoT situations NFTRH 492 went on to review the weekly version of the chart above along with gold vs. commodities, bonds and currencies.
A bull case is built with sound data, not hopes and bias. At the close of last week at least, the case appears to be building, pending the macro relief that will come when fear and angst max out on the short-term.
“Hi Gary, Thank you for the emphasis on balance, and patience. I am not really making money at the moment, but not losing it either… small gold position, small short position, watching the market bounce about with patience while waiting for the trend to emerge. Something I never could have done a year, or even 6 months ago.” –Mike S 3.23.18
For consistent, high quality analysis (a weekly report and in-week market and technical ‘trade setup’ updates) that keeps subscribers on the right side of all major markets, consider an affordable premium subscription to NFTRH.
Watch for 3 three key numbers at next Friday’s close: 1. The March Monthly/Quarterly/Next Friday close above the $1330.00 level (hasn’t happened for 6 years, not since 2012. 2. Staying above the 200 day moving average at 12.92.07 3. Last, see if the GDX and GDXJ break above roughly $23 for GDX and $34 for GDXJ. – R. Zurrer for Money Talks
Gold has firmed above $1300 in recent days and is holding comfortably above $1300 for now. We think the market will break to the upside sometime this year. The question is when. Here are 3 things to watch that will tell us if Gold is on the cusp of that break-out soon or later.
First, keep your eye on Gold’s close at the end of next week. It’s not only the end of the week and month but also the end of the quarter. While Gold has traded above $1350 multiple times in the past two years, it has not made a quarterly close above $1330 since 2012. Since this is a quarterly time frame, we would need to see a close above $1340 or even $1345 to mark a significant breakout. If Gold can make such a close next Friday then the odds are good that it could break above $1375 fairly soon.

Gold Quarterly Chart
Second, (and I always beat this to death) Gold needs to break its downtrends relative to foreign currencies (FC) and equities. The Gold/equities ratio appears to be breaking out but needs follow through for confirmation. The 200-day moving average in that chart appears to have stopped declining. If the ratio can hold above the 200-day moving average then it’s obviously a bullish sign. Meanwhile, Gold/FC has work to do. Over the last 10 months, it has traded in a tighter and tighter range. That trendline resistance could go hand in hand with resistance at $1365-$1375.
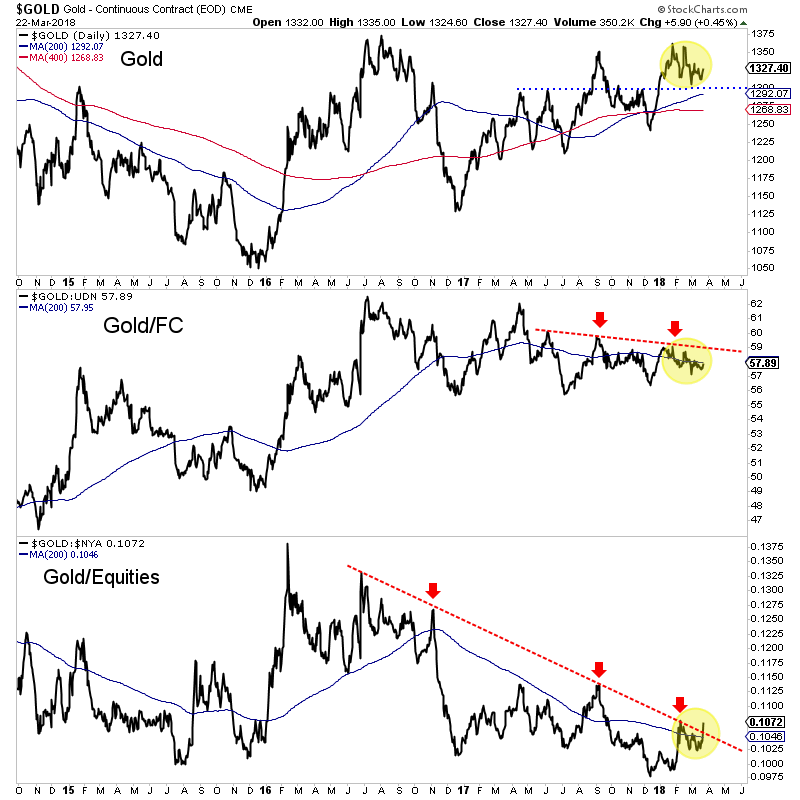

Of course, the price action in Gold itself will answer the question but these other charts can not only give an early hint but can also inform as to the sustainability of Gold’s strength. The first test will be the quarterly close next week. Then we can monitor if the Gold/equities ratio is holding its breakout and if Gold/FC is strengthening.
We have expected the move to a break-out in Gold could begin sometime in Q3. Let’s keep our eyes peeled on the above charts as the genesis of that move has a chance to begin earlier than expected. In the meantime, we continue to be patient but are accumulating the juniors we think have 500% return potential over the next 18-24 months.
Jordan Roy-Bryne
 Usually the most naturally volatile of markets, Gold Stocks are showing too are showing 14 – 25 year lows in long-term volatility in several indicators. It has been a tough time with the US Dollar rallying with the election of Donald Trump. Sooner or later extreme low volatility will change. Jordan estimates that will occur within the next 18-24 months. R. Zurrer for Money Talks
The past 18 months have been difficult for precious metals investors. If you had known Donald Trump would be elected and the US Dollar would soon begin a nearly 15% decline, you would have expected Gold to blow past its 2016 high. You would have been shocked to see the gold miners and junior gold stocks trading lower. Gold has fared okay but the gold stocks and Silver have lagged. As US equities have continued to power higher, precious metals have struggled to perform while volatility in the space has dwindled. Precious metals volatility has reached extremely low levels and this is a sign that a major move, while not necessarily imminent is surely on the horizon.
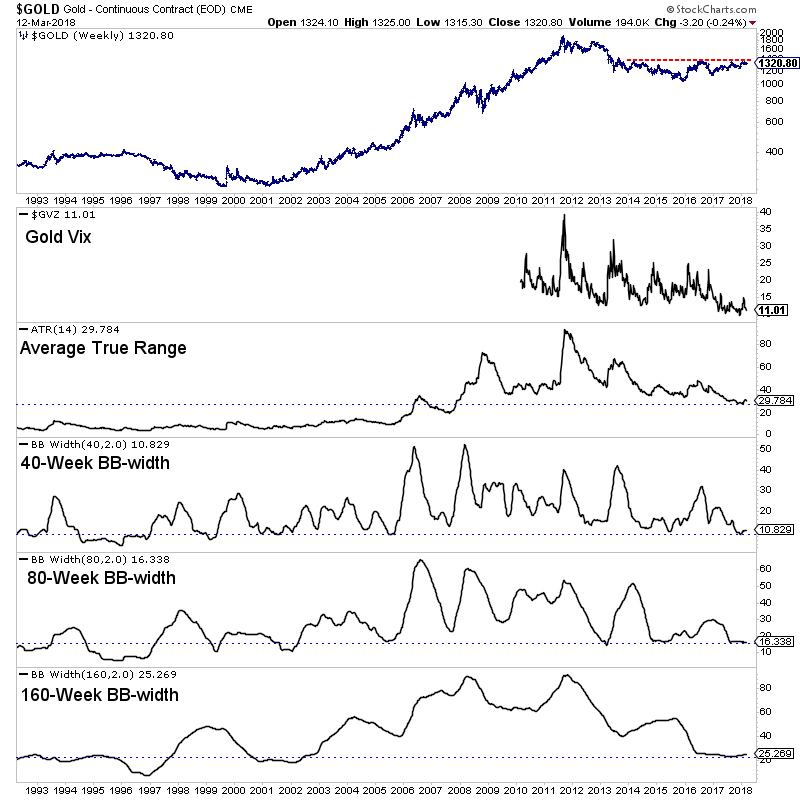
We plot a weekly bar chart of Gold that includes a handful of volatility indicators such as the Gold Vix (GVZ), Average True Range (ATR) and several bollinger band widths (BBw). These indicators have touched major lows in recent months. The Gold Vix which began trading in 2010 recently touched its lowest level ever at 9. ATR recently touched its lowest level since 2007. The 40-week and 80-week BBw’s recently hit their lowest levels since 2005 while the 160-week BBw recently touched its lowest level since 2002.
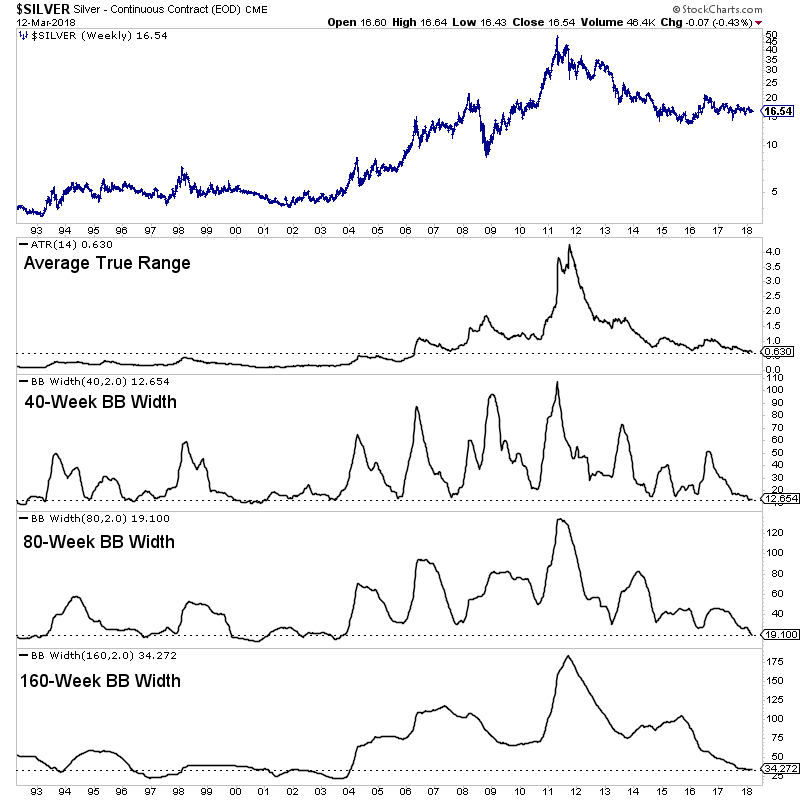
Like Gold, Silver is showing significantly low levels of long-term volatility. Its ATR recently touched its lowest point since 2006. The BBw for three time frames (40 week, 80-week and 160-week) recently touched 14 year lows.
Although the gold stocks are one of the most naturally volatile markets, they too are showing significantly low long-term volatility. Below we plot the NYSE Gold Miners Index, which is the parent index of GDX along with similar volatility indicators. The ATR indicator recently touched a 15 year low. Interestingly, both the 40-week and 80-week BBw’s recently hit some of the lowest points of the past 25 years. The 40-week BBw recently tied 2007 for the lowest point in the past 25 years while the 80-week BBw recently touched a 6-year low and its 3rd lowest point of the past 25 years.

The major markets within the precious metals sector are showing extremely low levels of long-term volatility. At somepoint this will change but we cannot know exactly when. Given our long-term bullish bias, our thinking is volatility could increase as Gold approaches resistance and then accelerate upon a break-out in Gold. Note that low volatility can last for a while and will not suddenly change overnight. It may slowly start to increase at first. While we cannot know when, we do know that extremely low volatility is present and can facilitate a major move over the next 12 to 24 months. With more time ahead before an increase in volatility and a potential break-out we continue to remain patient and accumulate the juniors we think have 500% return potential over the next 18-24 months. To follow our guidance and learn our favorite juniors for the next 12-18 months, consider learning more about our service.

-
I know Mike is a very solid investor and respect his opinions very much. So if he says pay attention to this or that - I will.
~ Dale G.
-
I've started managing my own investments so view Michael's site as a one-stop shop from which to get information and perspectives.
~ Dave E.
-
Michael offers easy reading, honest, common sense information that anyone can use in a practical manner.
~ der_al.
-
A sane voice in a scrambled investment world.
~ Ed R.
Inside Edge Pro Contributors

Greg Weldon

Josef Schachter

Tyler Bollhorn

Ryan Irvine

Paul Beattie

Martin Straith

Patrick Ceresna

Mark Leibovit

James Thorne

Victor Adair