
Gold & Precious Metals
The best of all possible introductory prices for Martin Murenbeeld & Co’s research on gold – FREE! Take advantage of this MoneyTalks opportunity to read what one of the world’s foremost precious metal experts thinks. CLICK HERE or on the image below and then select the Free Trial Offer button in the top right hand corner of Martin’s home page. ~ Ed.


One thing I really respect about this analyst, Steve St. Angelo, is that he makes a very clear argument using graphics and fundamentals. One look at the first chart certainly tells you which of Real Estate, the Dow Jones or Silver is in the “low risk” position. A well written, strong argument – Robert Zurrer for Money Talks
While silver is completely off the radar to most investors, it will turn out to be one of the best investments to own as the massive amount of leverage in the stock and real estate market evaporates. Unfortunately, investors, today are no longer capable of recognizing when an asset displays a HIGH or LOW risk. Thus, fundamental indicators are ignored as the investors continue the insane strategy of “Buying the Dip.”
A prudent investor is able to spot when an asset becomes a high risk and then has the sense to move his or her funds into one that is a lower risk. However, the majority of investors do not follow this practice as they are caught by surprise when a Market Crash occurs… again and again and again. Even worse, when investors are shown that the indicators are pointing to assets that are extremely risky, then ignore it and continue business as usual.
Today, complacency has turned investors’ brains into mush. They are no longer able to discern RIGHT from WRONG. So, when the market really starts to correction-crash, they will hold on to their stocks waiting for Wall Street’s next BUY THE DIP call.
Regardless, if we can understand the fundamentals, then we would be foolish to keep most of our investment funds in Stock and Real Estate assets. The following chart follows the KISS Principle – Keep It Simple Stupid:

You don’t need to be a highly-trained financial or technical analyst to spot the HIGH vs. LOW-RISK assets in the chart above. Hell, you don’t even need to see the figures in the chart. If we understand that all markets behave in cycles, then it’s common sense that asset prices will peak and decline. We can plainly see that both Real Estate and Stocks asset values are near their top while the silver price is closer to its bottom.
Thus, assets that are near a top are HIGH RISK, and those near a bottom are LOW RISK. It’s really that simple.
Now, if we look at each chart separately, we can easily spot which assets will be the BIG LOSERS in the future. According to the St. Louis Federal Reserve data (FRED), the U.S. Median Home Sales Price of $324,550 is nearly $100,000 higher than the bubble in 2007:

So, the current U.S. Median Home Sales Price is 30% higher than its previous peak in 2007 and 52% above its low in 2009. If I was going to invest in real estate, the best time to do so at a bottom (LOW RISK), then at the top (HIGH RISK). However, Americans are piling into new and existing homes because they believe the prices will continue higher forever. Unfortunately for American homeowners and buyers, the Fed’s current policy to increase interest rates over the next year is not positive for the real estate market.
While U.S. Median home prices are 52% higher than their low in 2009, the Dow Jones Index is a staggering 220% higher during the same period. If U.S. real estate values are HIGH RISK, then the Dow Jones Index must be EXTREMELY RISKY:

Going by the 200 Month Moving Average (MA), shown in red, the Dow Jones Index is 11,000 points higher, or 45% over-valued. However, if we went by the Dow Jones low in 2009, then the index is 73% over-valued. Again, when assets are way above their baseline values, then they enter into a HIGH-RISK category. It doesn’t matter if U.S. home prices or the broader stock markets continue to move higher for a while, they are still highly risky assets.
Now, if we look at the Silver Price, we see a much different setup. Not only is the silver price way off its highs set back in 2011, but it is also just 40 cents above its 200 MA:

With the silver price being 2% above its 200 MA, it is clearly the LOWEST RISK asset compared to the Dow Jones or U.S. residential real estate values. Furthermore, the Commitment Of Traders (COT) Report suggests that the very low net commercial silver short position also indicates that the silver price is bottoming:

The chart above shows that the Commercials present net short position in silver is back to its cycle lows. While the Commercials could continue to liquidate more short contracts, as the silver price falls a bit lower, we are closer to forming a bottom than a top. So, if we use logic, then the silver price is the LOW-RISK asset to purchase and hold while U.S. residential real estate and stocks are HIGH-RISK assets to sell.
Of course, it will take time for these markets to correct, but nothing goes up or down forever. However, the horrible irony of how the markets will play out in the future is to watch investors get wiped out because they are unable to distinguish between HIGH and LOW-RISK assets.
Check back for new articles and updates at the SRSrocco Report.
Amidst the hurricane of a plunging/soaring/plunging Stock Market Dr. Sieron reviews the facts of Gold’s performance against the S&P 500, Oil, US Dollar & the Fed’s inflation rate – Robert Zurrer for Money Talks
One month after the February stock market rout is an excellent time to step back and review all the facts – and their implications for the gold market. Here’s exactly what happened – and what it implies for your capital allocation.
- After more than a year of continuously advancing, the S&P 500 fell nearly 10 percent in five days.
- The sell-off was allegedly triggered by the surprisingly strong January jobs report, showing the acceleration in wage growth. That released fears of higher inflation, which could prompt the Fedto tighten its stance further. As President Trump rightly pointed out (on Twitter, of course):
in the “old days,” when good news was reported, the Stock Market would go up. Today, when good news is reported, the Stock Market goes down.
- The stock market correction came on top of bond market tumble. The 10-year Treasury yield jumped from 2.72 percent on January 31 to 2.84 percent on February 2. Analysts claim that bond yields also spiked due to inflation concerns.
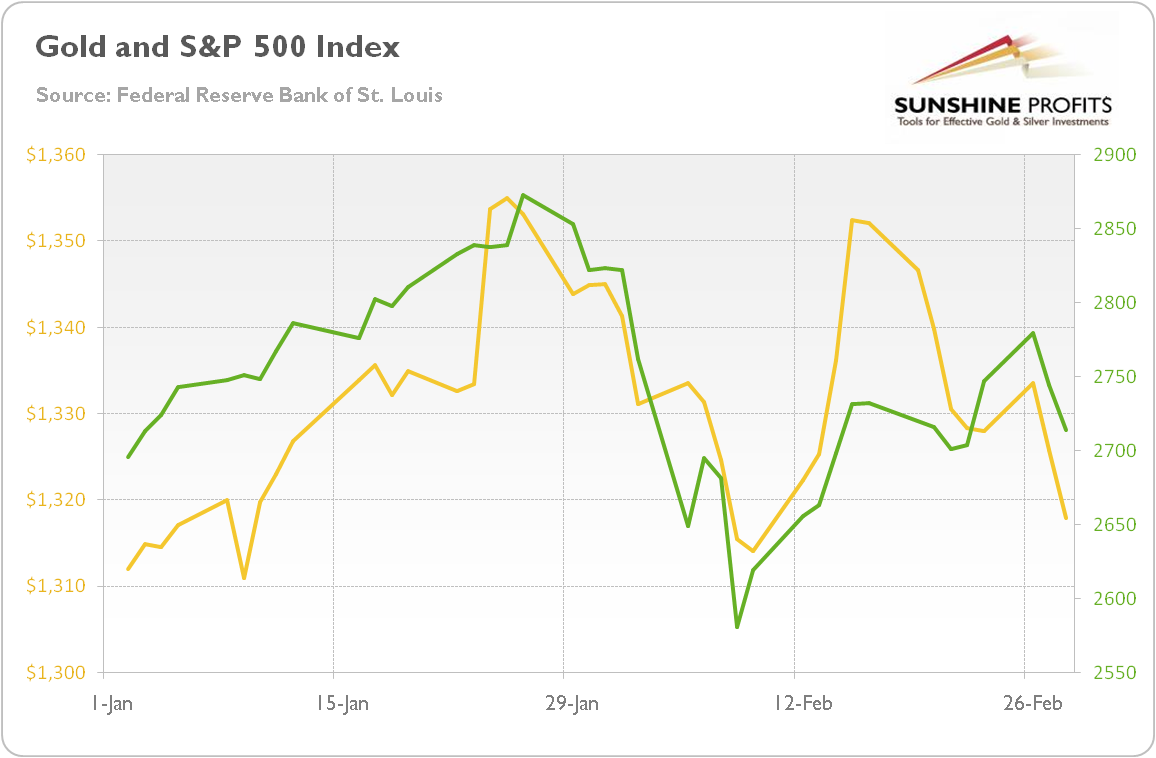
- Gold didn’t offer a hedge against stock market turmoil. Instead, it shared with equities the fears against a more hawkish Fed and moved in tandem with stocks, as one can see in the chart below. The correlation between these two assets this year is about 0.6, which is pretty high.
Chart 1: Gold prices (yellow line, left axis, London P.M. Fix, in $) and S&P 500 Index (green line, right axis) from January 1, 2018 to February 28, 2018.
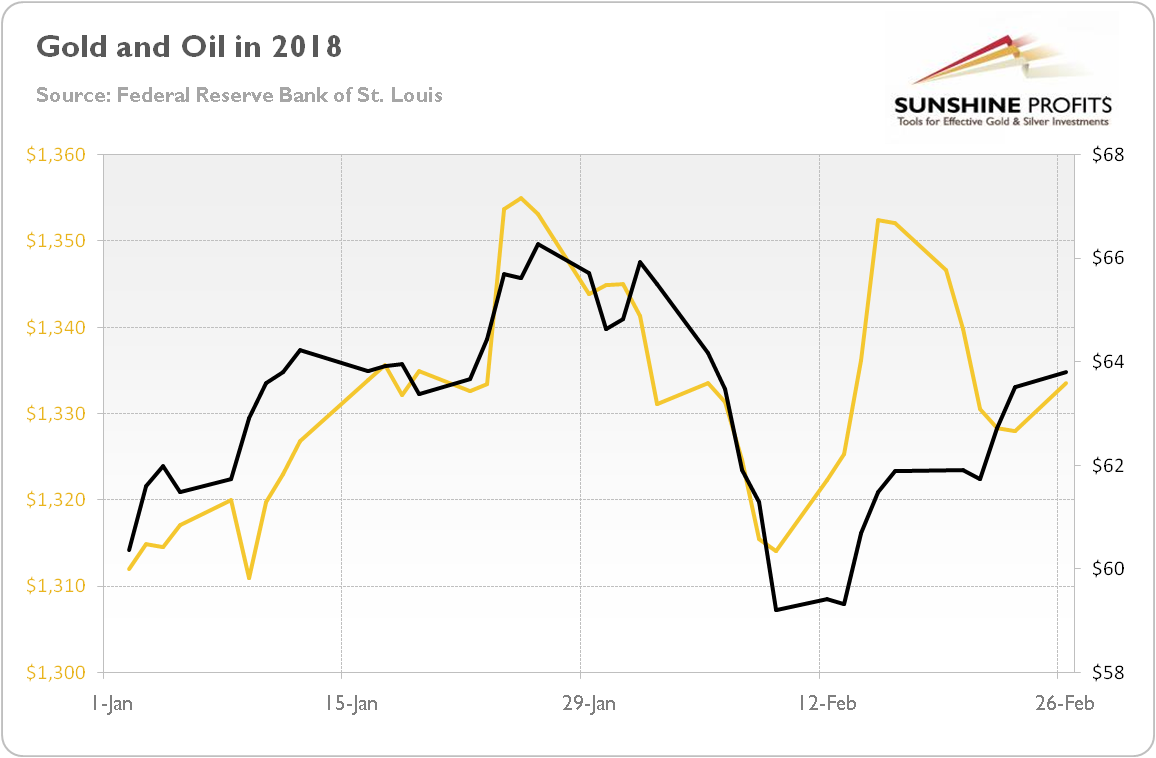
These are facts. But what do they imply for the future? Are they changing the economic outlook? Not really. First of all, fears of inflation are clearly exacerbated. Just look what happened to the oil prices in February. It doesn’t suggest that enormous inflation is coming. And it doesn’t bode well for bullion, given the strong correlation (almost 0.6 – see also the chart below) between the yellow and black gold in 2018.
Chart 2: Gold prices (yellow line, left axis, London P.M. Fix, in $) and oil prices (black line, right axis, WTI, in $) from January 1, 2018 to February 26, 2018.
And the basic rule of fundamental investing is to not overreacting to a single government report (or any statistics), especially to January data, as they are often revised later.
Second, we don’t deny that yields increased. This is a hard fact. But what really matters is why they rose. As a reminder, the nominal interest rates can be split into real interest rates and inflation premium. The data clearly says that inflation expectations weren’t the key driver lifting the 10-Treasury yields. Actually, they dropped, as one can see in the chart below, which paints the 10-year breakeven inflation rate, i.e. the difference between 10-year Treasury yields and 10-year Treasury yields indexed by inflation).
Chart 3: 10-year breakeven inflation rate (the difference between 10-Year Treasury Constant Maturity Securities and 10-Year Treasury Inflation-Indexed Constant Maturity Securities, in %) from January 1, 2018 to February 14, 2018.
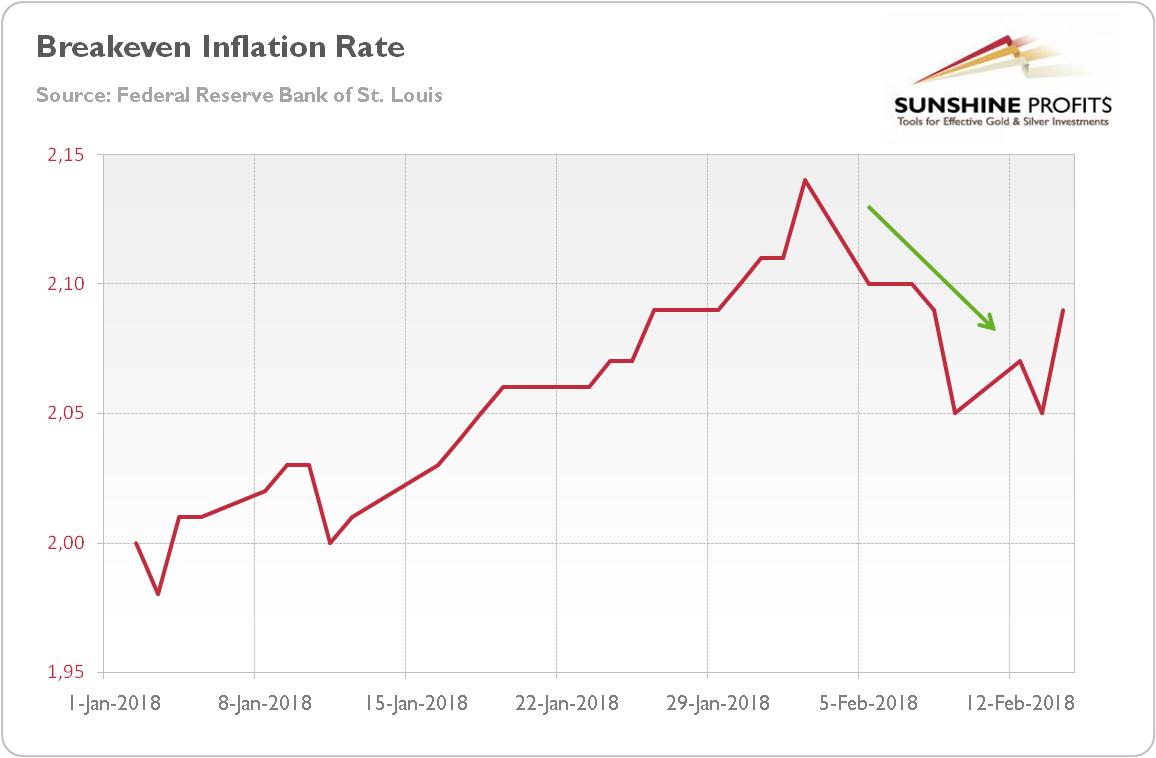
It means that, contrary to popular narrations, the bond yields didn’t jump because of inflation fears. Instead, the real interest rates soared, pulling nominal yields higher. Now, the question is: why did the real rates increase?
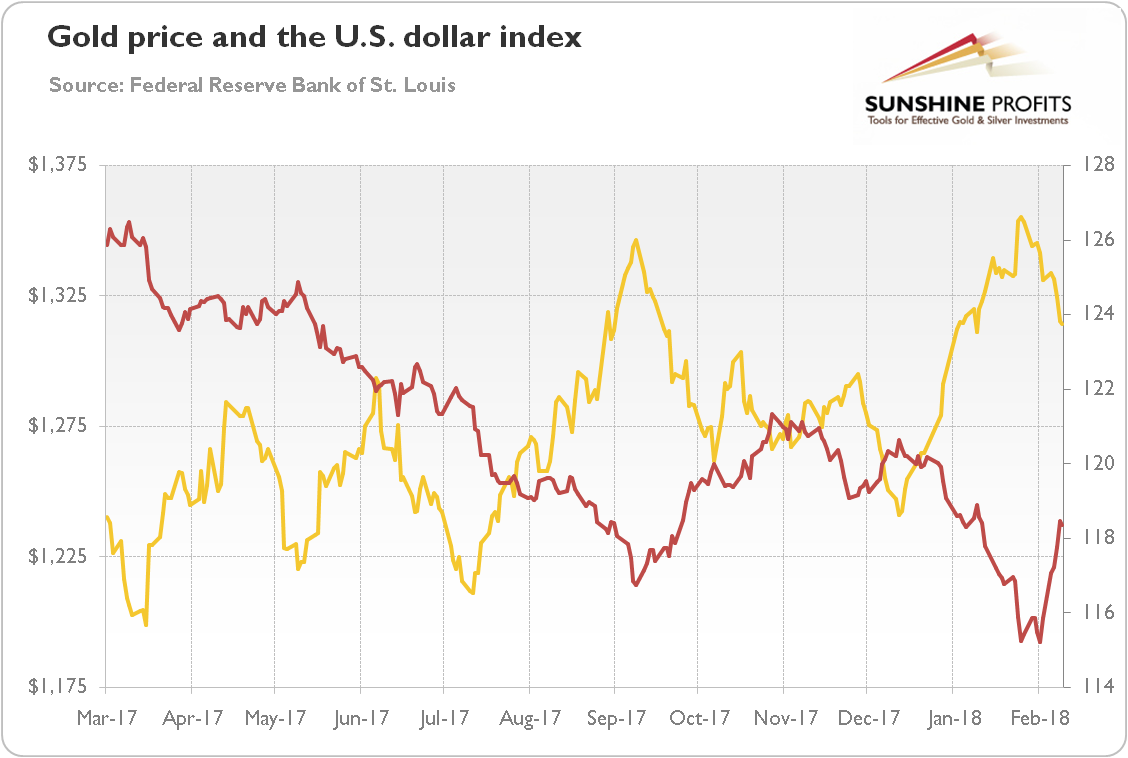
Some analysts believe that they rose, as investors expected acceleration in the economic growth. It might be the case, as the U.S. dollar strengthened during the bond market turmoil and the stock market rout, as the next chart shows. If true, bad times are approaching for gold, as higher yields are not worrying if they signal global growth and a return to normalcy.
Chart 4: Gold prices (yellow line, left axis, London P.M. Fix, in $) and the Broad Trade Weighted U.S. Dollar Index (red line, right axis) from March 2017 to February 2018.
However, there might be another explanation. You see, tectonic shifts in the supply and demand for Treasuries are unfolding. The Fed unwinds its purchases, while the Congress unwisely widens the fiscal deficit (tax cuts and higher expenditure do the job), boosting issuance of bonds. The combination of weaker demand and stronger supply implies higher yields. In this scenario, gold could shine – despite the higher real interest rates. The fears of higher fiscal deficit – or even a twin deficit – may explain the recent breakdown of the well-established highly negative correlation between gold and real interest rates. Adding to the deficit when the economy is growing above the trend isn’t the smartest fiscal policy – but, hey, this is when gold enters the scene, as a hedge against policymakers’ foolishness.
Summing up, a few weeks have passed since the stock market sell-off. It is a good time to look from the distance. Contrary to many alarmist opinions, the sky is not falling. Inflation is not skyrocketing. The interest rates have been rising, but together with corporate earnings. Hence, the correction was needed, but the fundamentals remain healthy – and the stock market has more upside laying out before itself. It means that neither inflation nor the stock market bear market is likely to support the price of the yellow metal. Luckily, the unsound U.S. fiscal policy and the greenback are now doing both doing a good job. Two real friends of gold.
If you enjoyed the above analysis and would you like to know more about the most important macroeconomic trends influencing the price of gold, we invite you to read the March Market Overviewreport. If you’re interested in the detailed price analysis and price projections with targets, we invite you to sign up for our Gold & Silver Trading Alerts. If you’re not ready to subscribe yet and are not on our gold mailing list yet, we urge you to sign up. It’s free and if you don’t like it, you can easily unsubscribe. Sign me up!
Thank you.
Arkadiusz Sieron, Ph.D.
Market Overview Editor
Jordan Roy-Bryne produces some of the best charts, today he’s put together some very clear chart on the Treasury Bond market, its relationship to Gold and the Gold to Stocks ratio. Worth a look – Robert Zurrer for Money Talks
Gold was well bid during the equity correction but it could not breakout then and has retreated as equities have roared back. As a result, the Gold to stocks ratio has retraced most of its recent surge. Meanwhile, the US Dollar has rebounded and the oversold and overhated bond market could be starting a rally. The recent rise in long-term bond yields which has benefitted Gold appears due for a pause or correction. Meanwhile, Gold could also correct and consolidate as it waits for a breakout in long-term bond yields which should in turn benefit Gold.
As we noted in One Big, Potential Catalyst for Gold in 2018, Gold is no longer trading with bonds and therefore could benefit from a big breakdown in bonds. As the chart below shows, the bond market has experienced a major breakdown. In recent days, the 5-year, 10-year and 30-year bonds all touched multi-year lows.
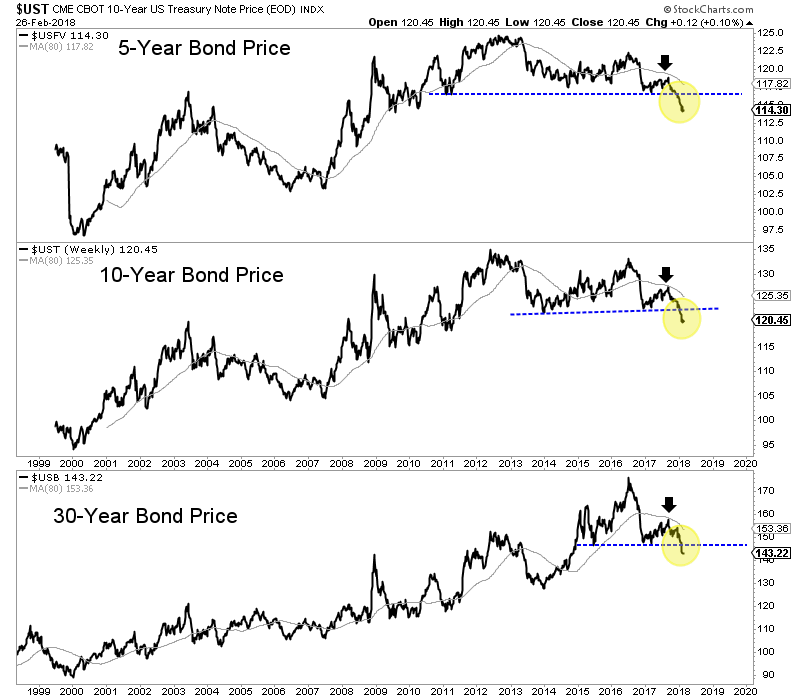
The breakdown in the bond market has helped Gold rally but why hasn’t Gold reached the corresponding multi-year highs?
First, we should remember that the correlation between Gold and bonds was positive until November 2017. The market has begun to sense inflation only recently.
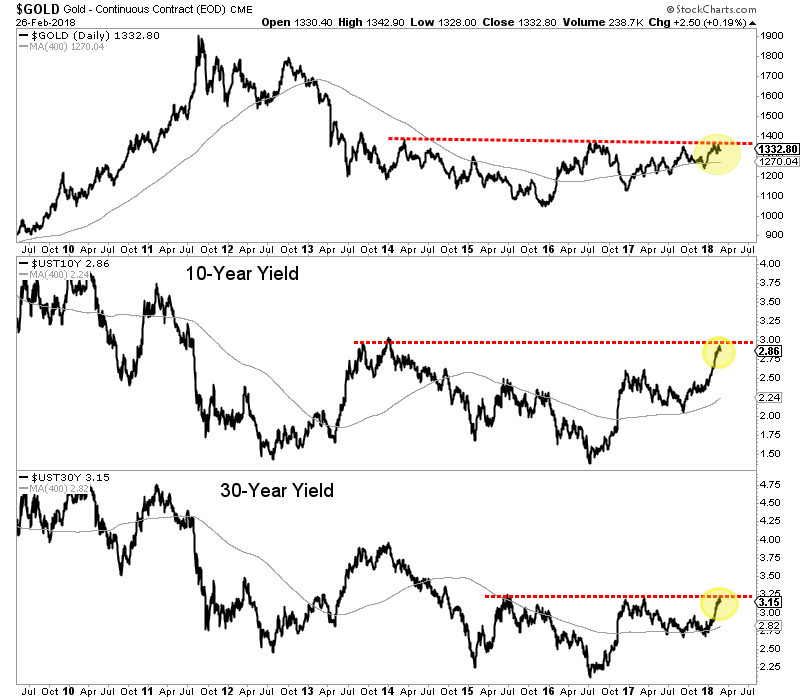
Second, while bond prices have broken down to multi-year lows, bond yields (and specifically long-term yields) have yet to breakout to multi-year highs.
The chart below shows long-term yields are testing multi-year resistance. For the 10-year yield, a strong push above 3.00% would mark more than a 6-year and almost 7-year high. A break above 3.25% in the 30-year yield would mark a 4-year high.
We have argued that Gold was unlikely to breakout immediately due to its lack of relative strength as well as the lack of strength from Silver and the gold shares.
If that remains the case then we would also expect bond yields to correct and digest their recent advance rather than breakout. We should also note that the daily sentiment index for bonds hit an 18-day average of 15% bulls. That is a bearish extreme and suggests the probability that bonds will rebound and yields will decline.
Gold could be waiting for a major breakout in bond yields, which would be a reflection of increasing inflation and inflation expectations. It would also result in more pressure on the economy and therefore the stock market. That would benefit Gold in both nominal and real terms. We expect a counter-trend move in Gold and bond yields before a breakout. This will allow us a bit more time to position in the juniors that should deliver fantastic returns.
Jordan Roy-Bryne
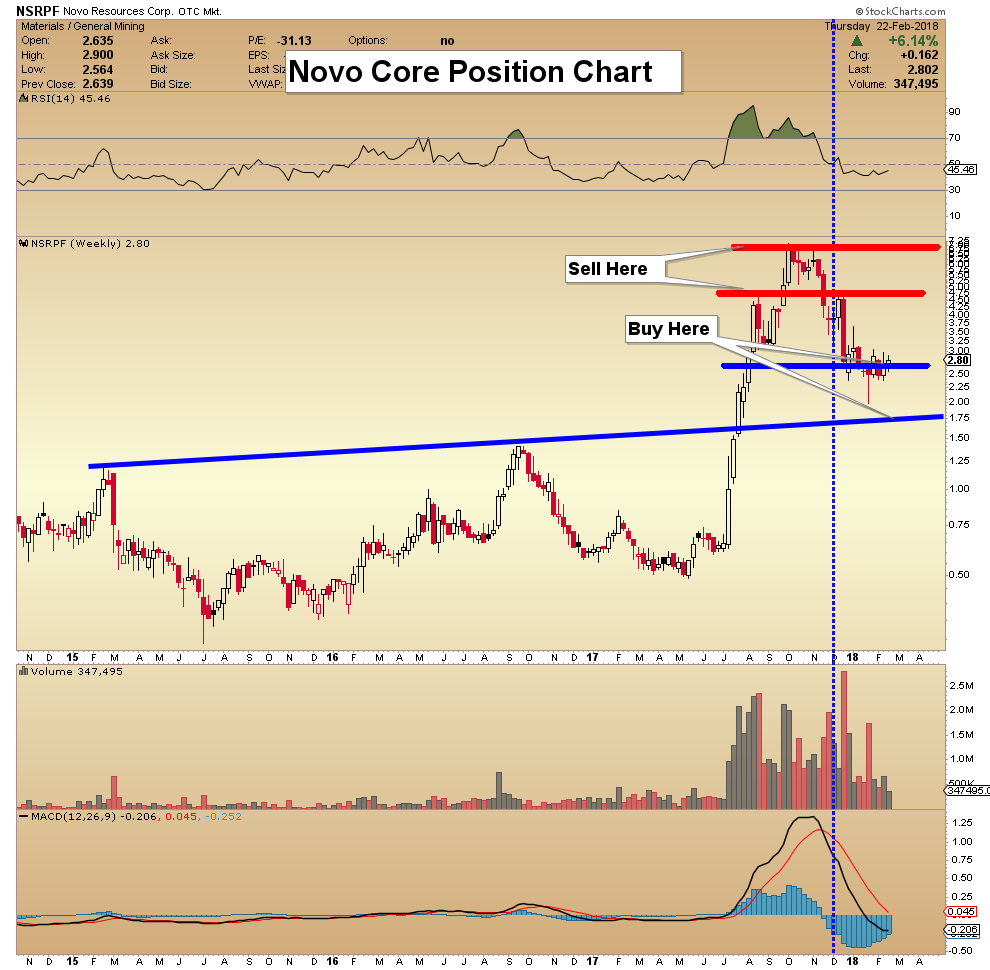
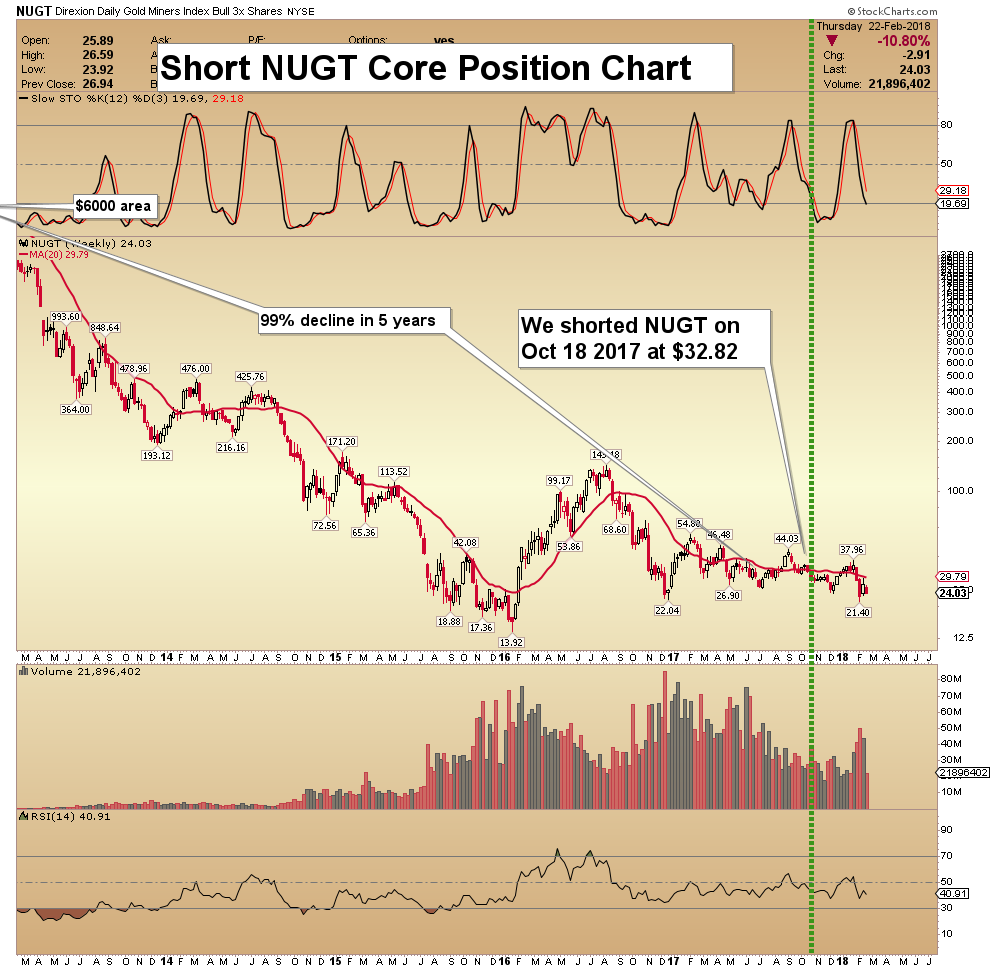
Put options are how you protect your investments from devastation yet allow yourself to participate in all upside a market has in store. For information on how to use them well, go watch Michael Campbell’s “How to Invest in Options”. Just register as for Michael’s Free E-Service on moneytalks.net and bingo,navigate to the Options video and watch – Robert Zurrer for Money Talks
Today’s videos and charts (double click to enlarge):


SF60 Key Charts & Video Update


SF Juniors Key Charts & Video Analysis


SF Trader Time Key Charts & Video Analysis


Morris
website: www.superforcesignals.com
email: trading@superforcesignals.com
email: trading@superforce60.com

-
I know Mike is a very solid investor and respect his opinions very much. So if he says pay attention to this or that - I will.
~ Dale G.
-
I've started managing my own investments so view Michael's site as a one-stop shop from which to get information and perspectives.
~ Dave E.
-
Michael offers easy reading, honest, common sense information that anyone can use in a practical manner.
~ der_al.
-
A sane voice in a scrambled investment world.
~ Ed R.
Inside Edge Pro Contributors

Greg Weldon

Josef Schachter

Tyler Bollhorn

Ryan Irvine

Paul Beattie

Martin Straith

Patrick Ceresna

Mark Leibovit

James Thorne

Victor Adair